

Reaching the UK’s target of net zero greenhouse gas emissions by 2050 means every aspect of the economy, from shops to super computers, must reduce its carbon footprint – all the way down their supply chains – as close to zero as possible.
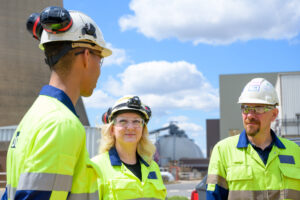
But as the country transforms, one thing is certain: demand for electricity will remain. In fact, with increased electrification of heating and transport, there will be a greater demand for power from renewable, carbon dioxide (CO2)-free sources. Bioenergy is one way of providing this power without reliance on the weather and can offer essential grid-stability services, as provided by Drax Power Station in North Yorkshire.

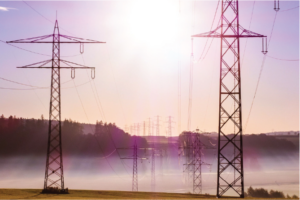
Close up of electricity pylon tower
Beyond just power generation, more and more reports highlight the important role the next evolution of bioenergy has to play in a net zero UK. And that is bioenergy with carbon capture and storage or BECCS.
A carbon negative source of power, abating emissions from other industries
The Committee on Climate Change (CCC) says negative emissions are essential for the UK to offset difficult-to-decarbonise sectors of the economy and meet its net zero target. This may include direct air capture (DAC) and other negative emissions technologies, as well as BECCS.
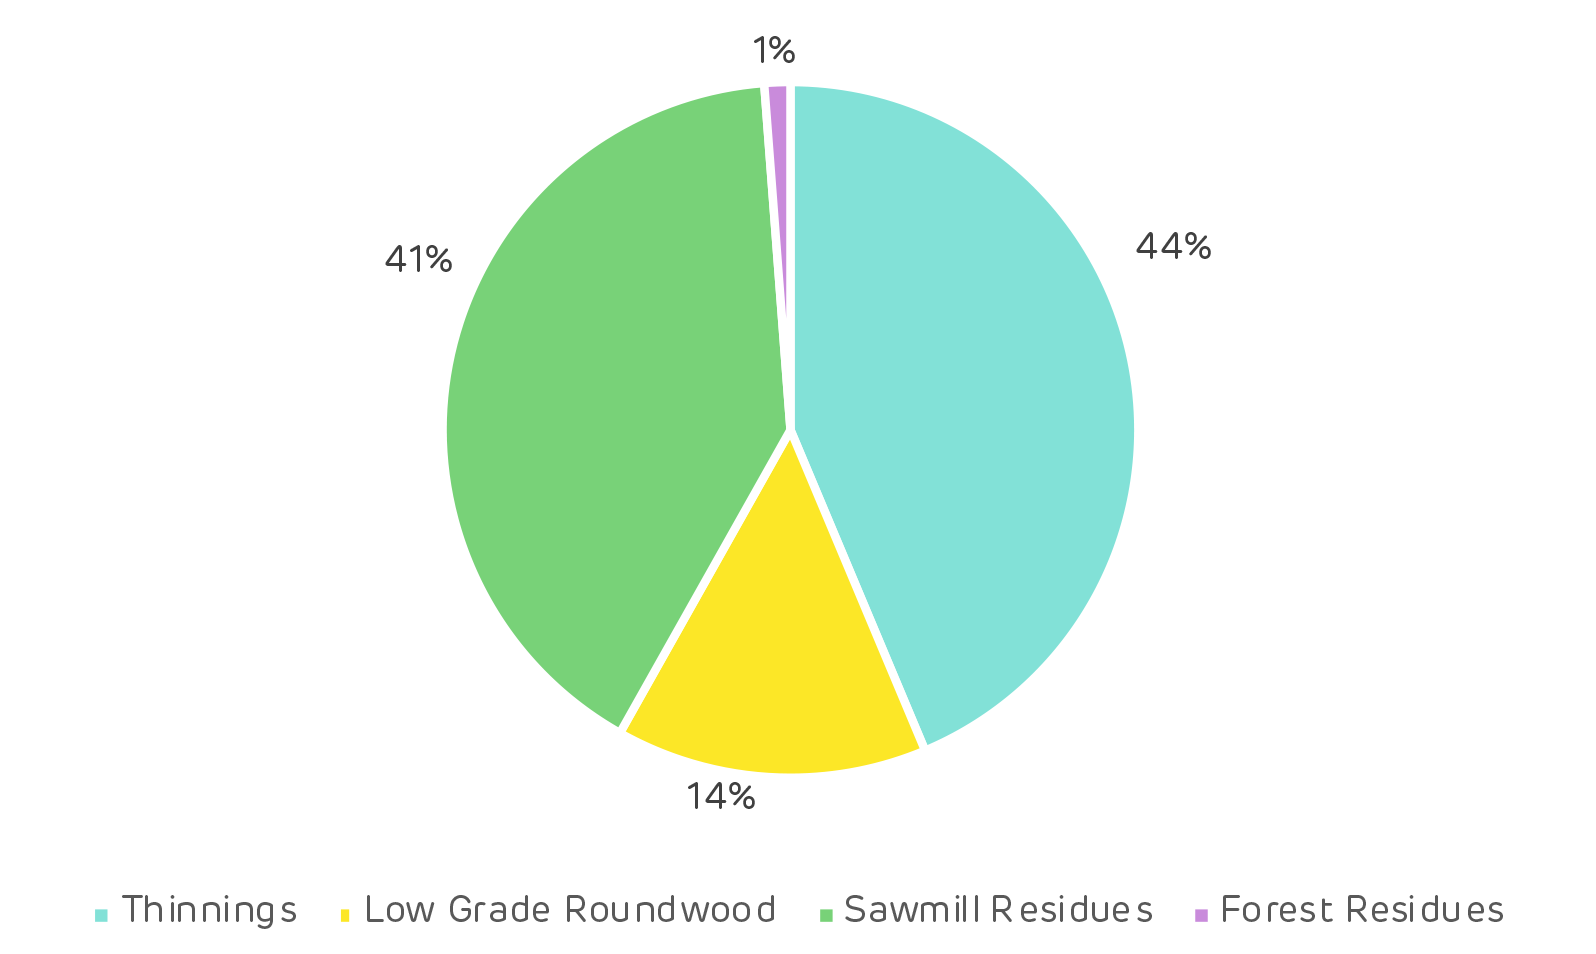
BECCS power generation uses biomass grown in sustainably managed forests as fuel to generate electricity. As these forests absorb CO2 from the atmosphere while growing, they offset the amount of CO2 released by the fuel when used, making the whole power production process carbon neutral. Adding carbon capture and storage to this process results in removing more CO2 from the atmosphere than is emitted, making it carbon negative.
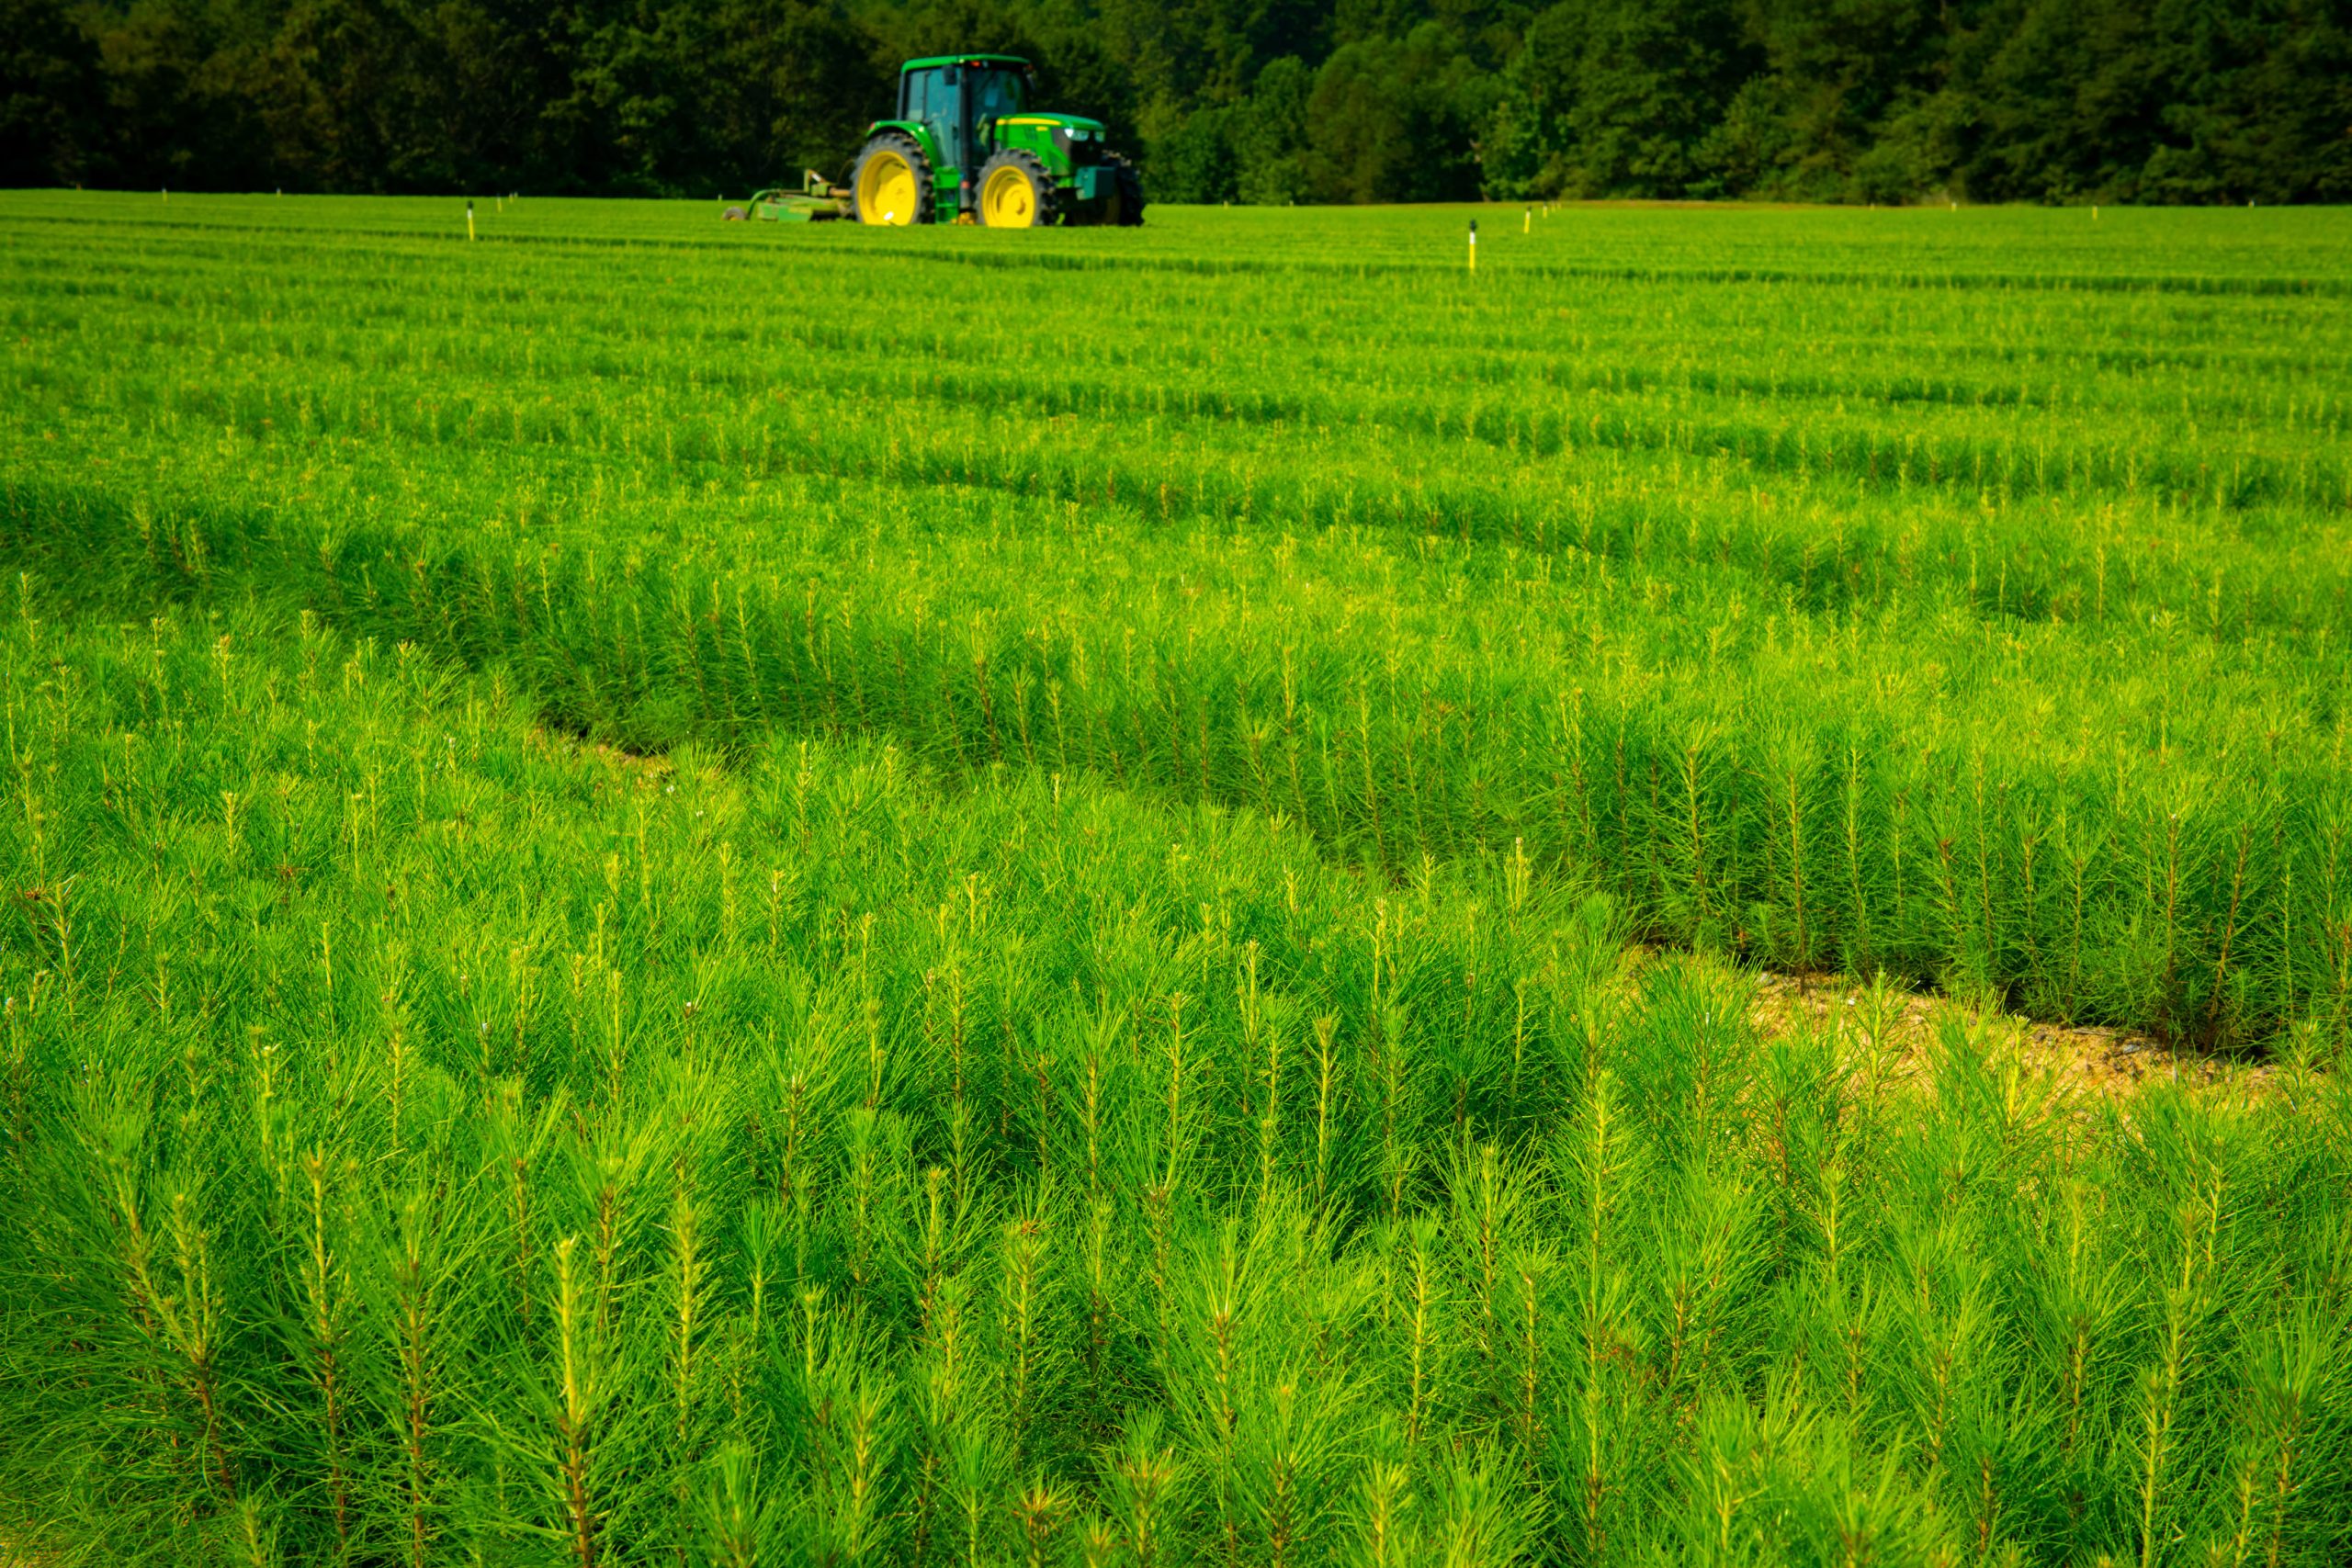
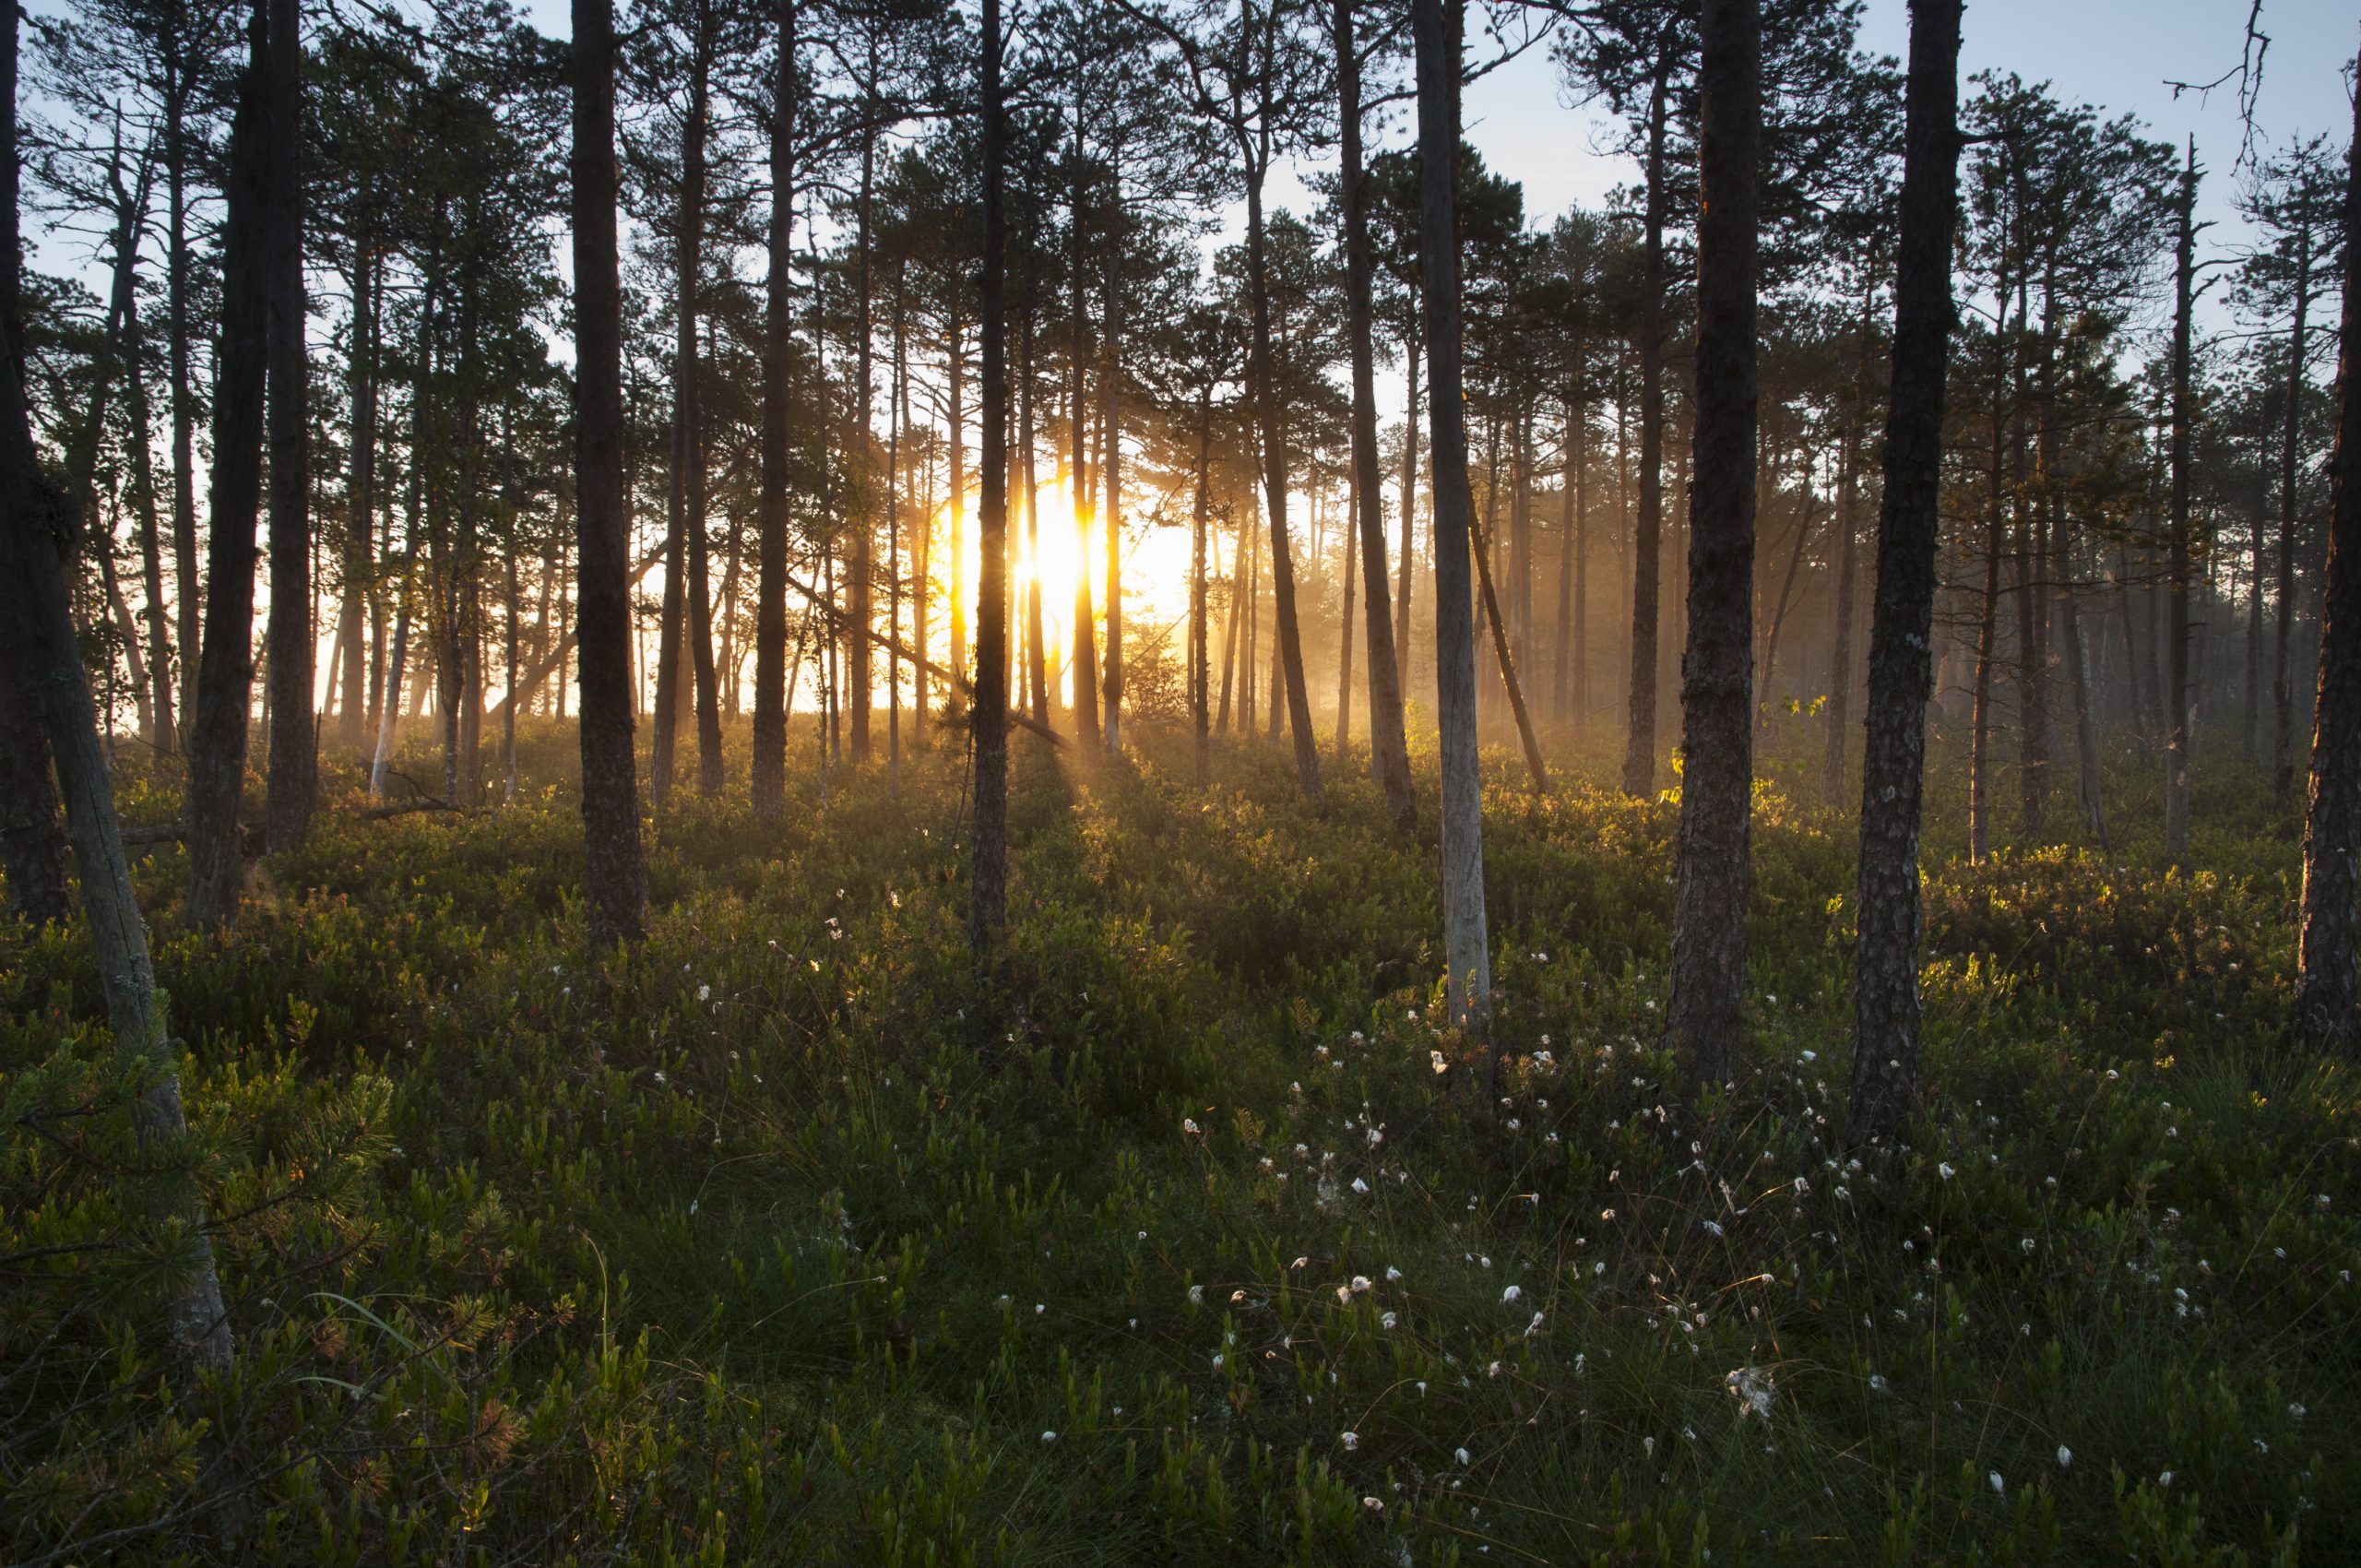
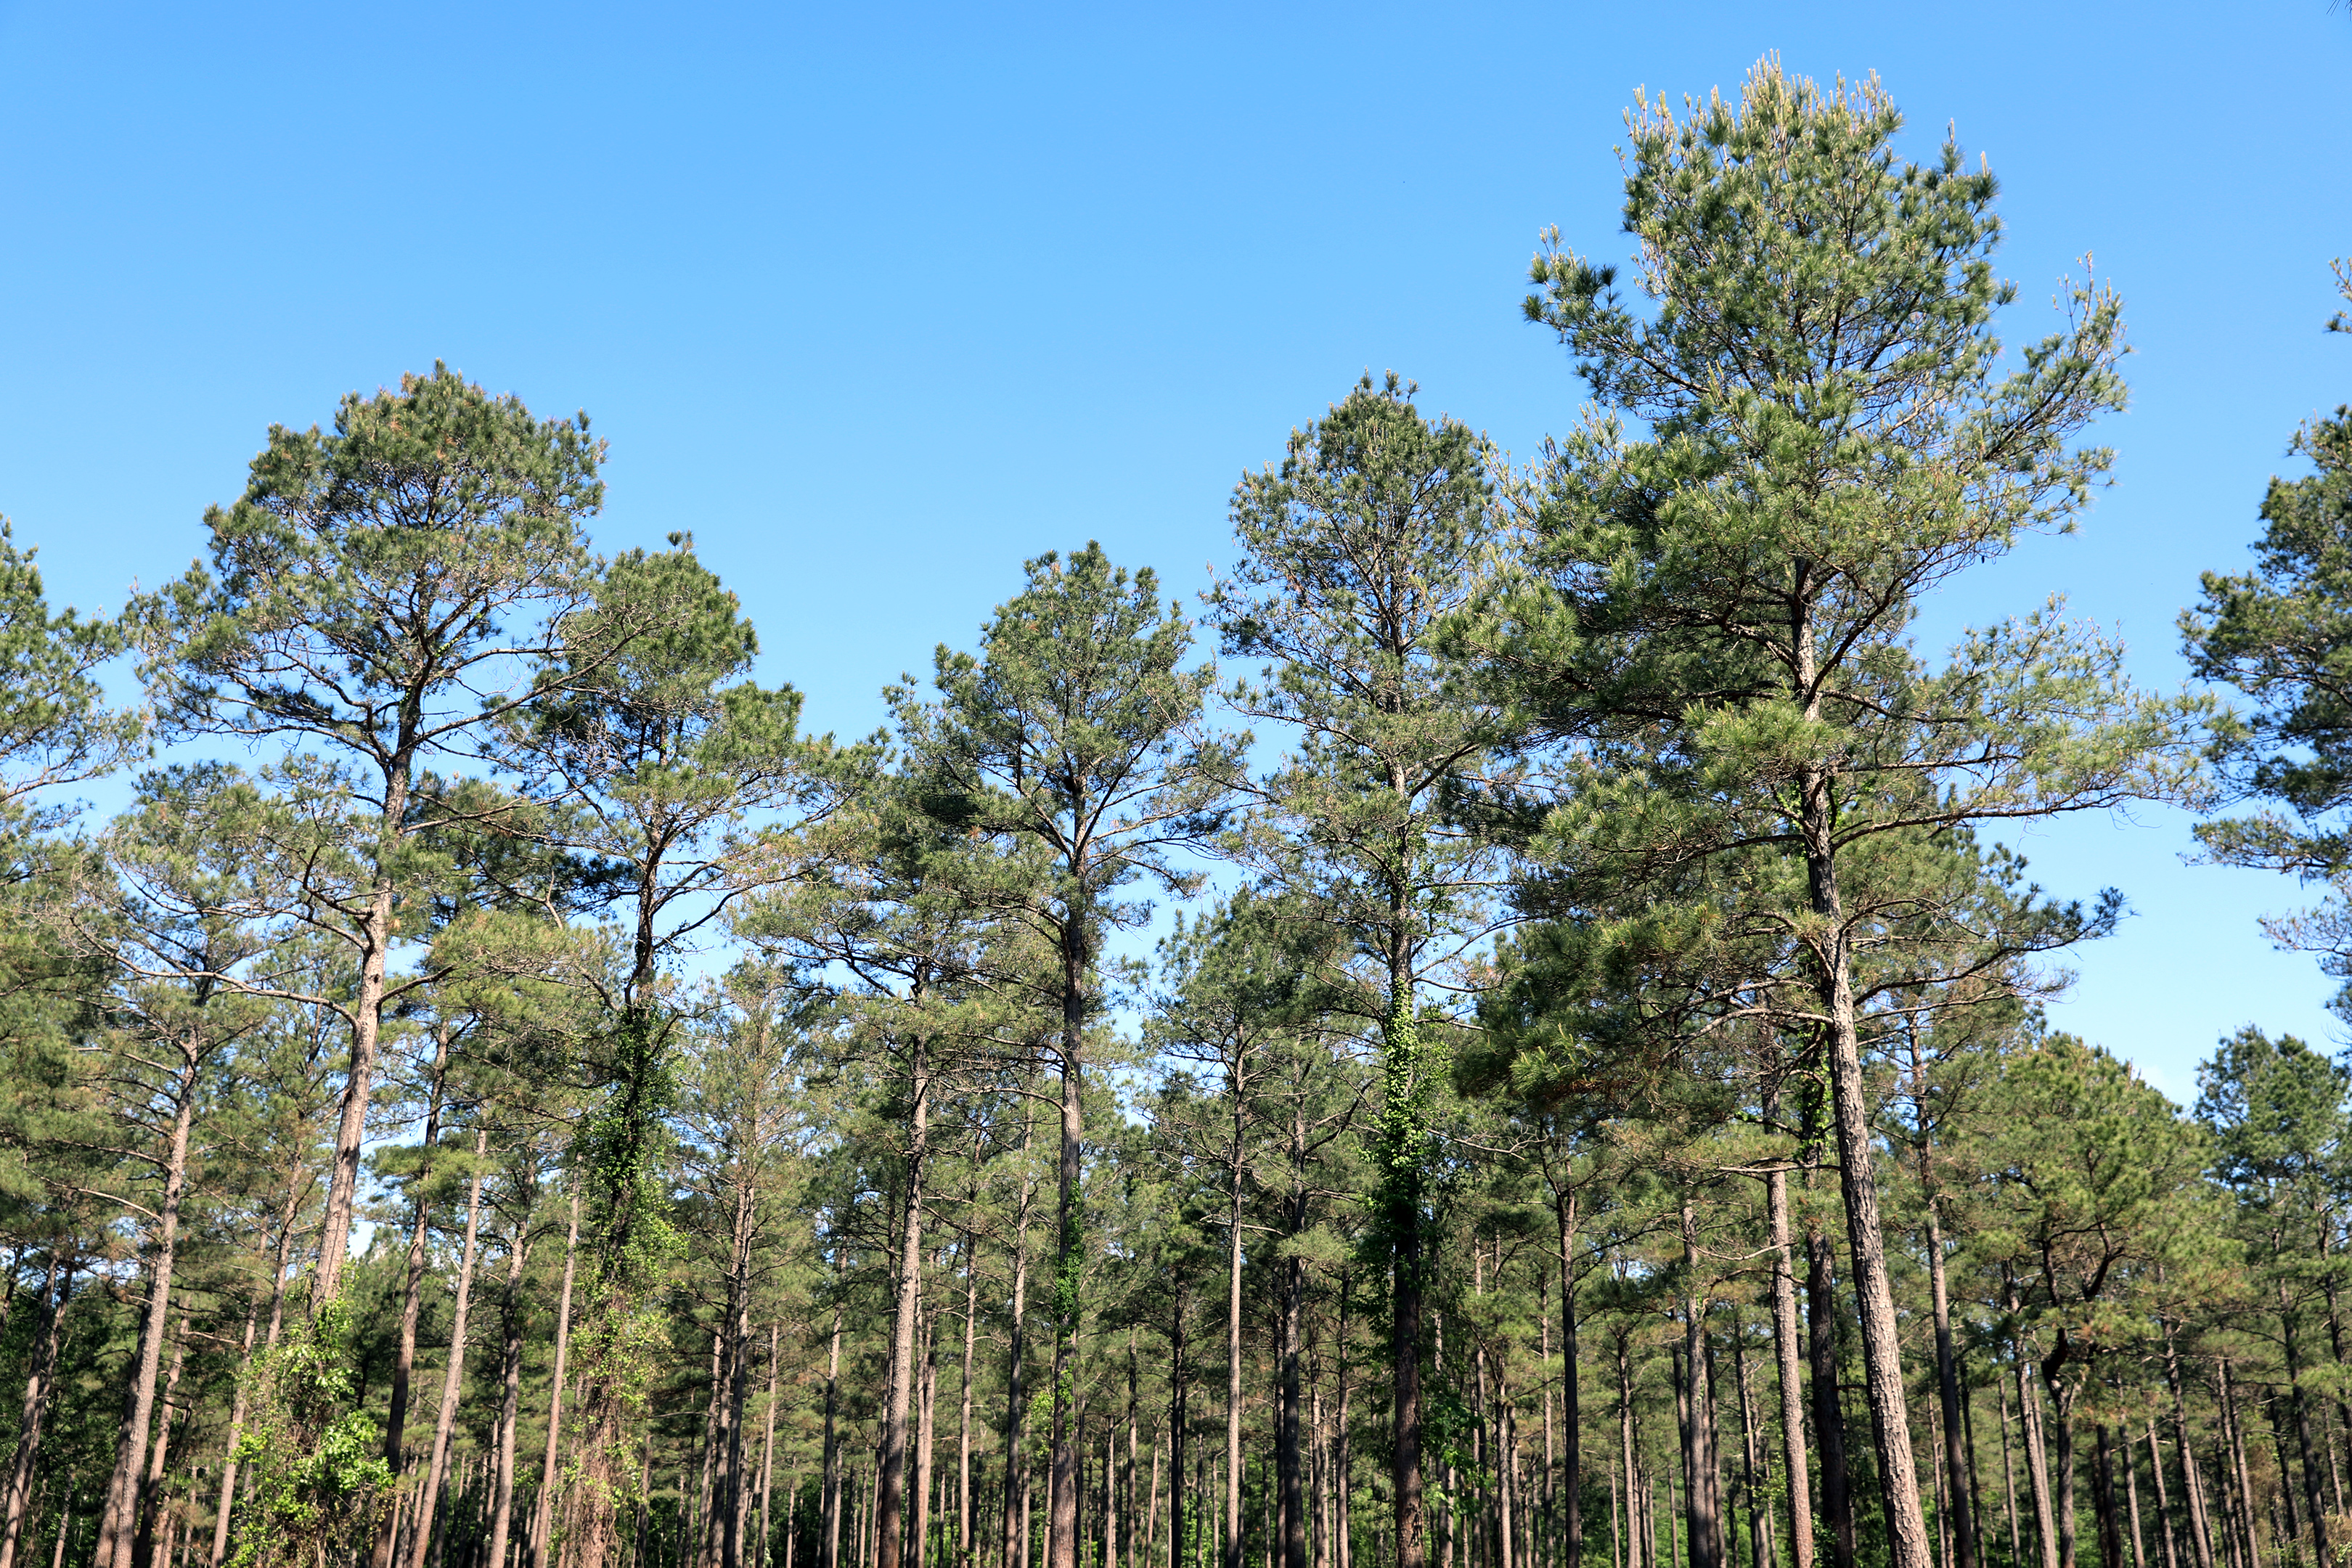
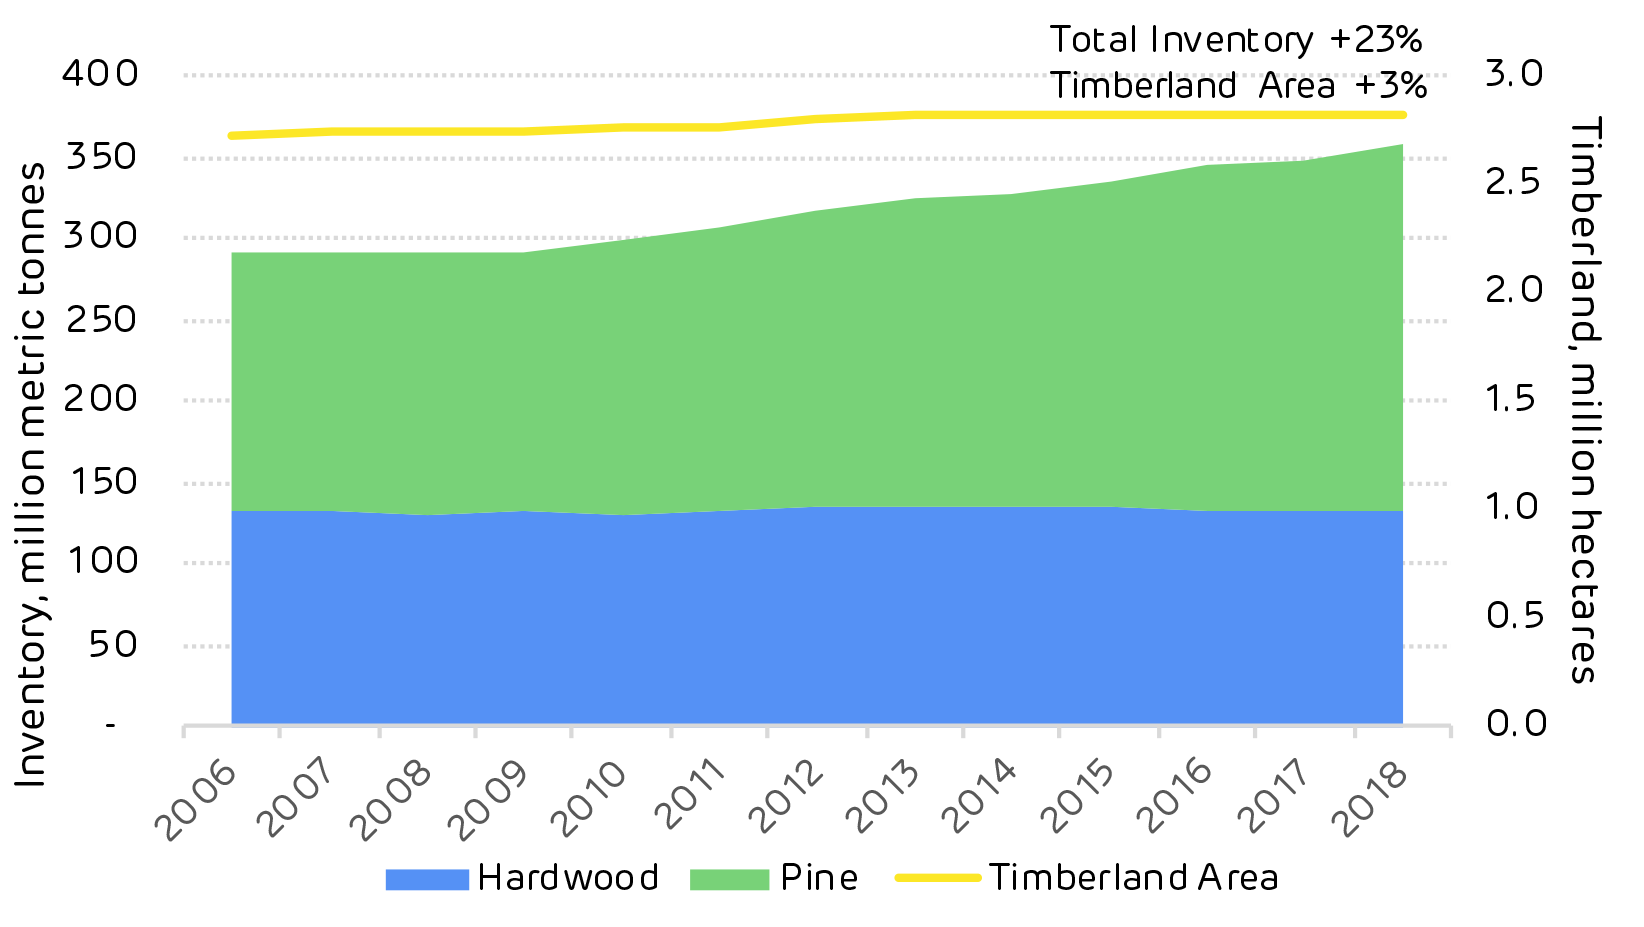
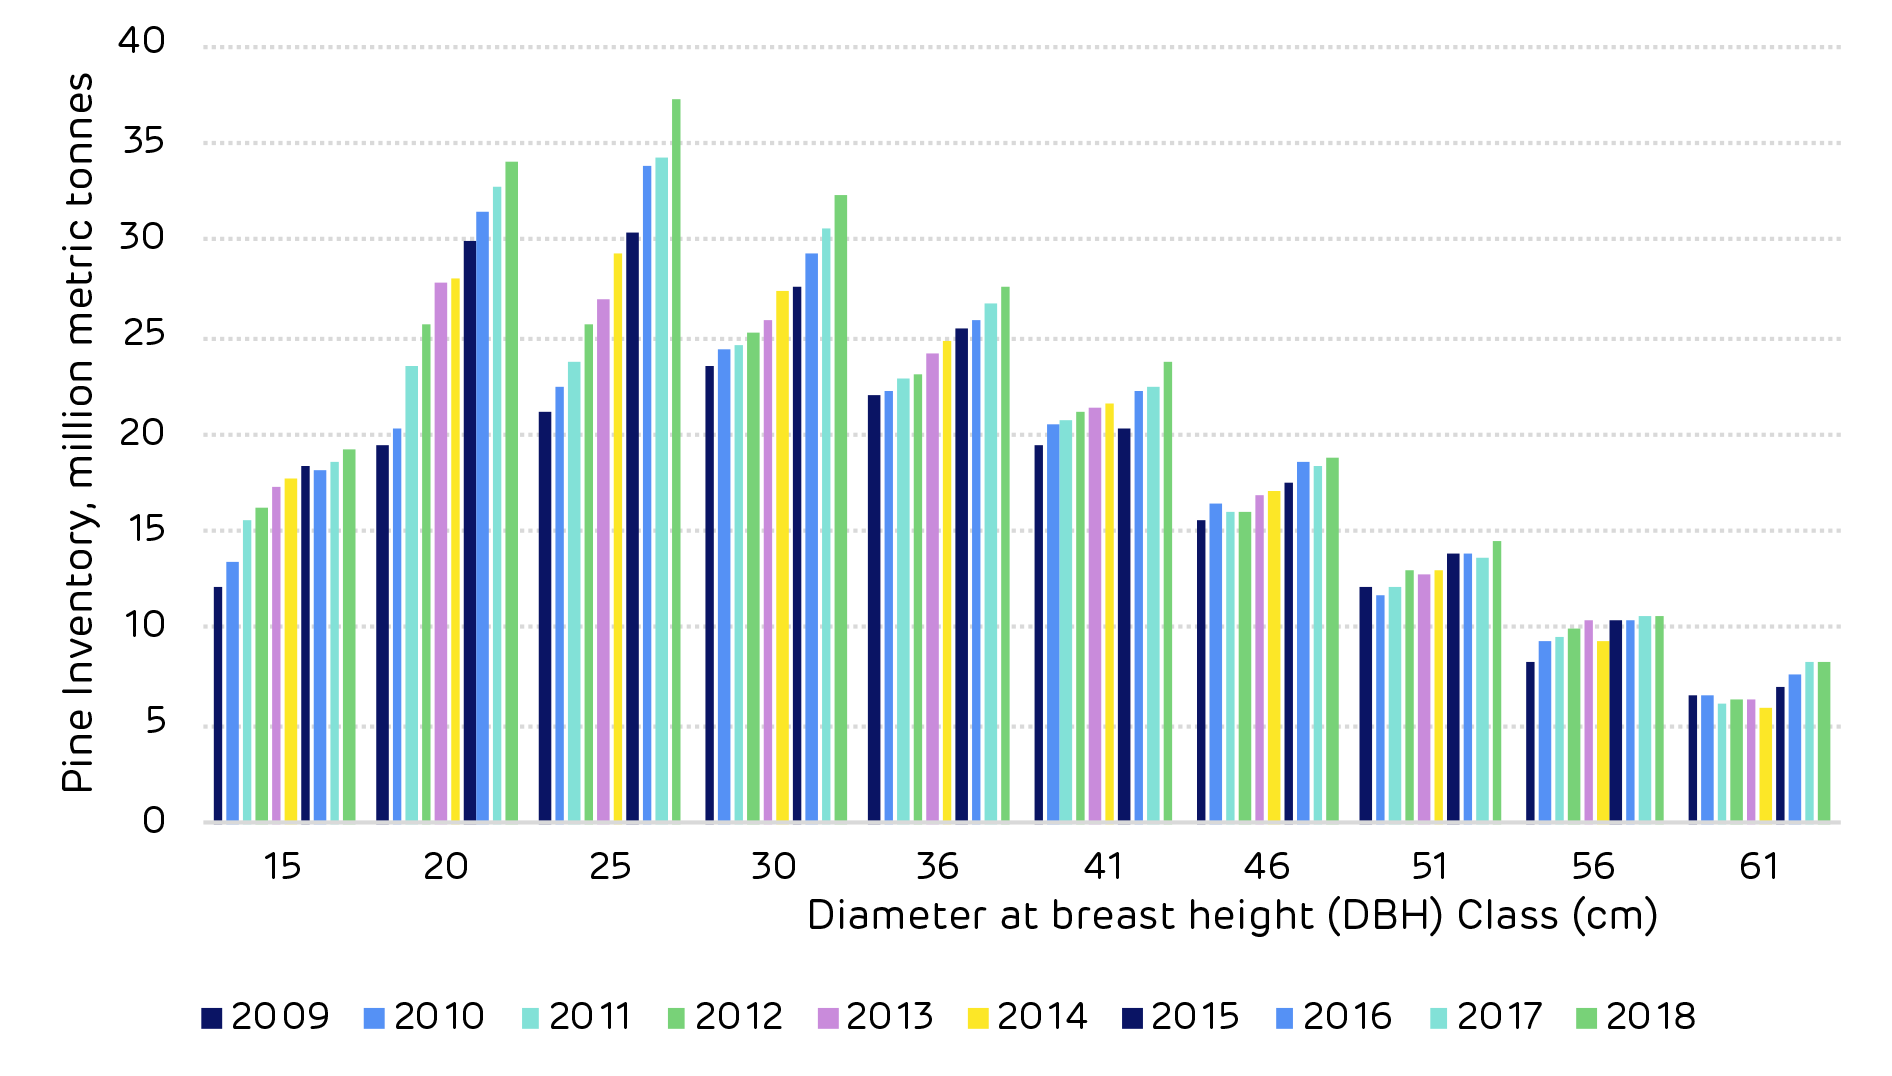
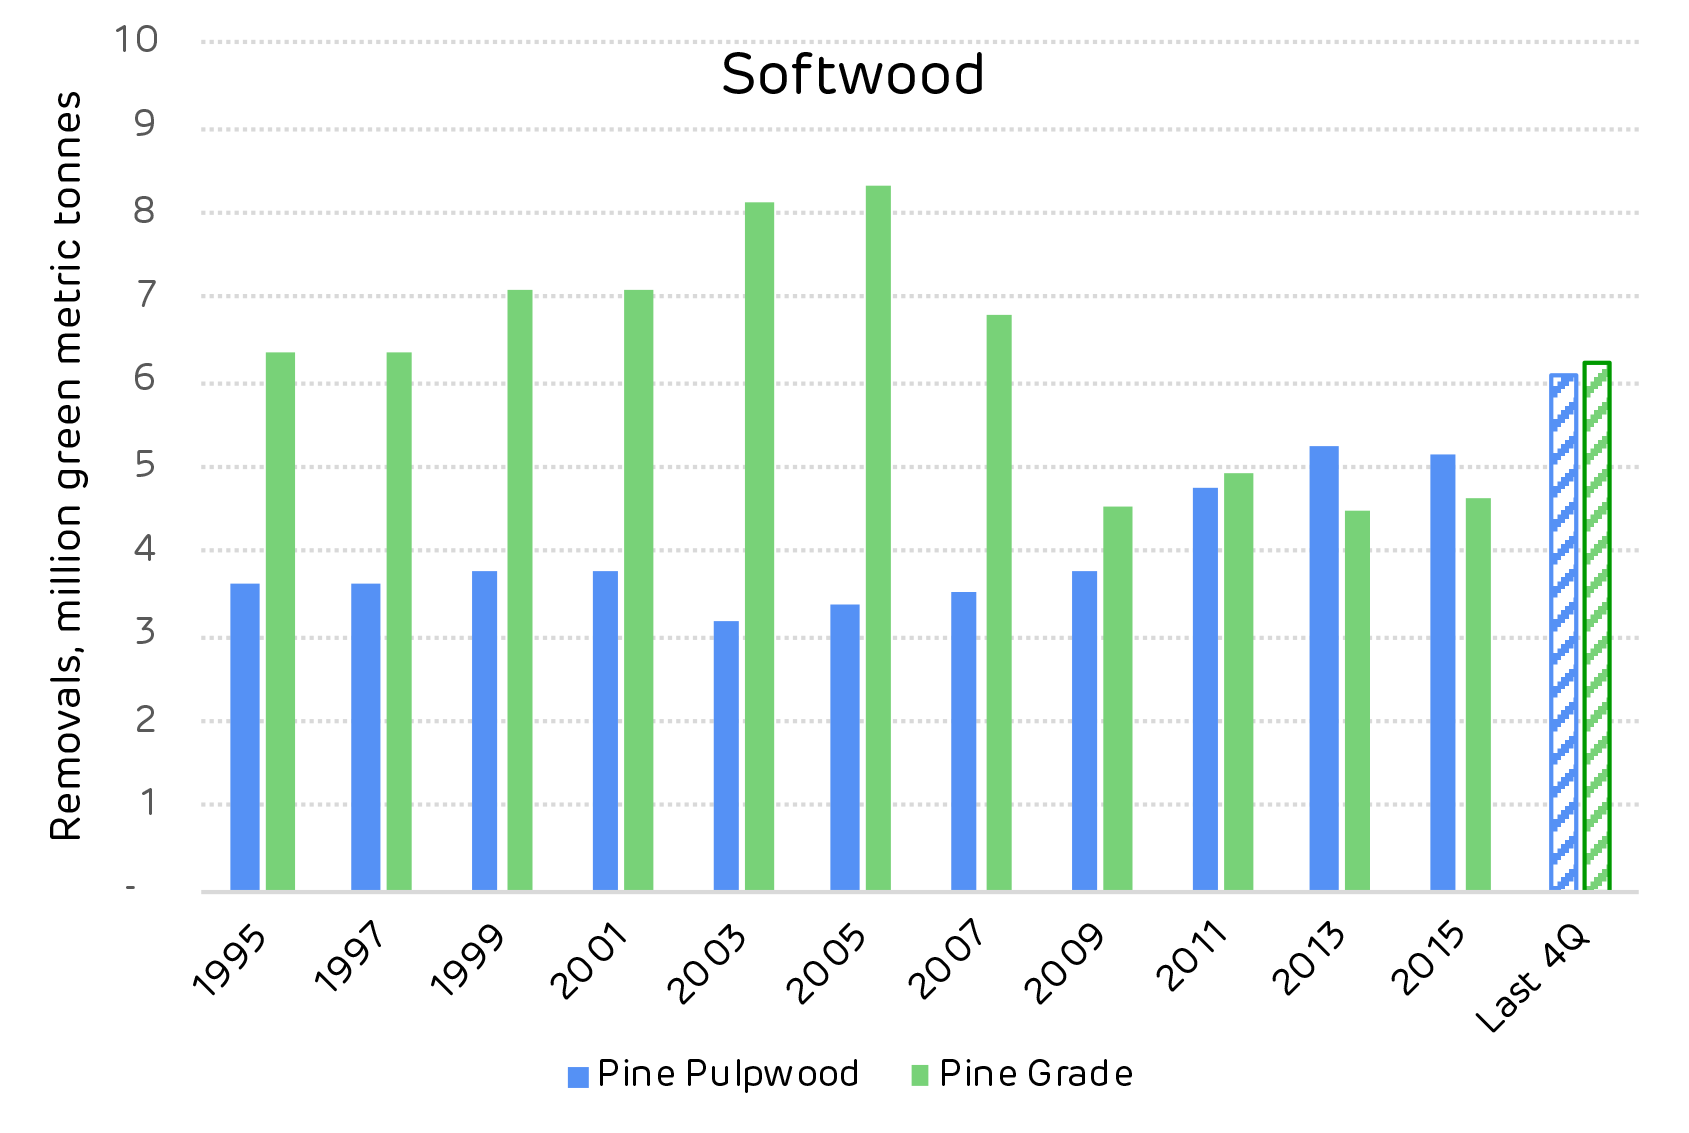
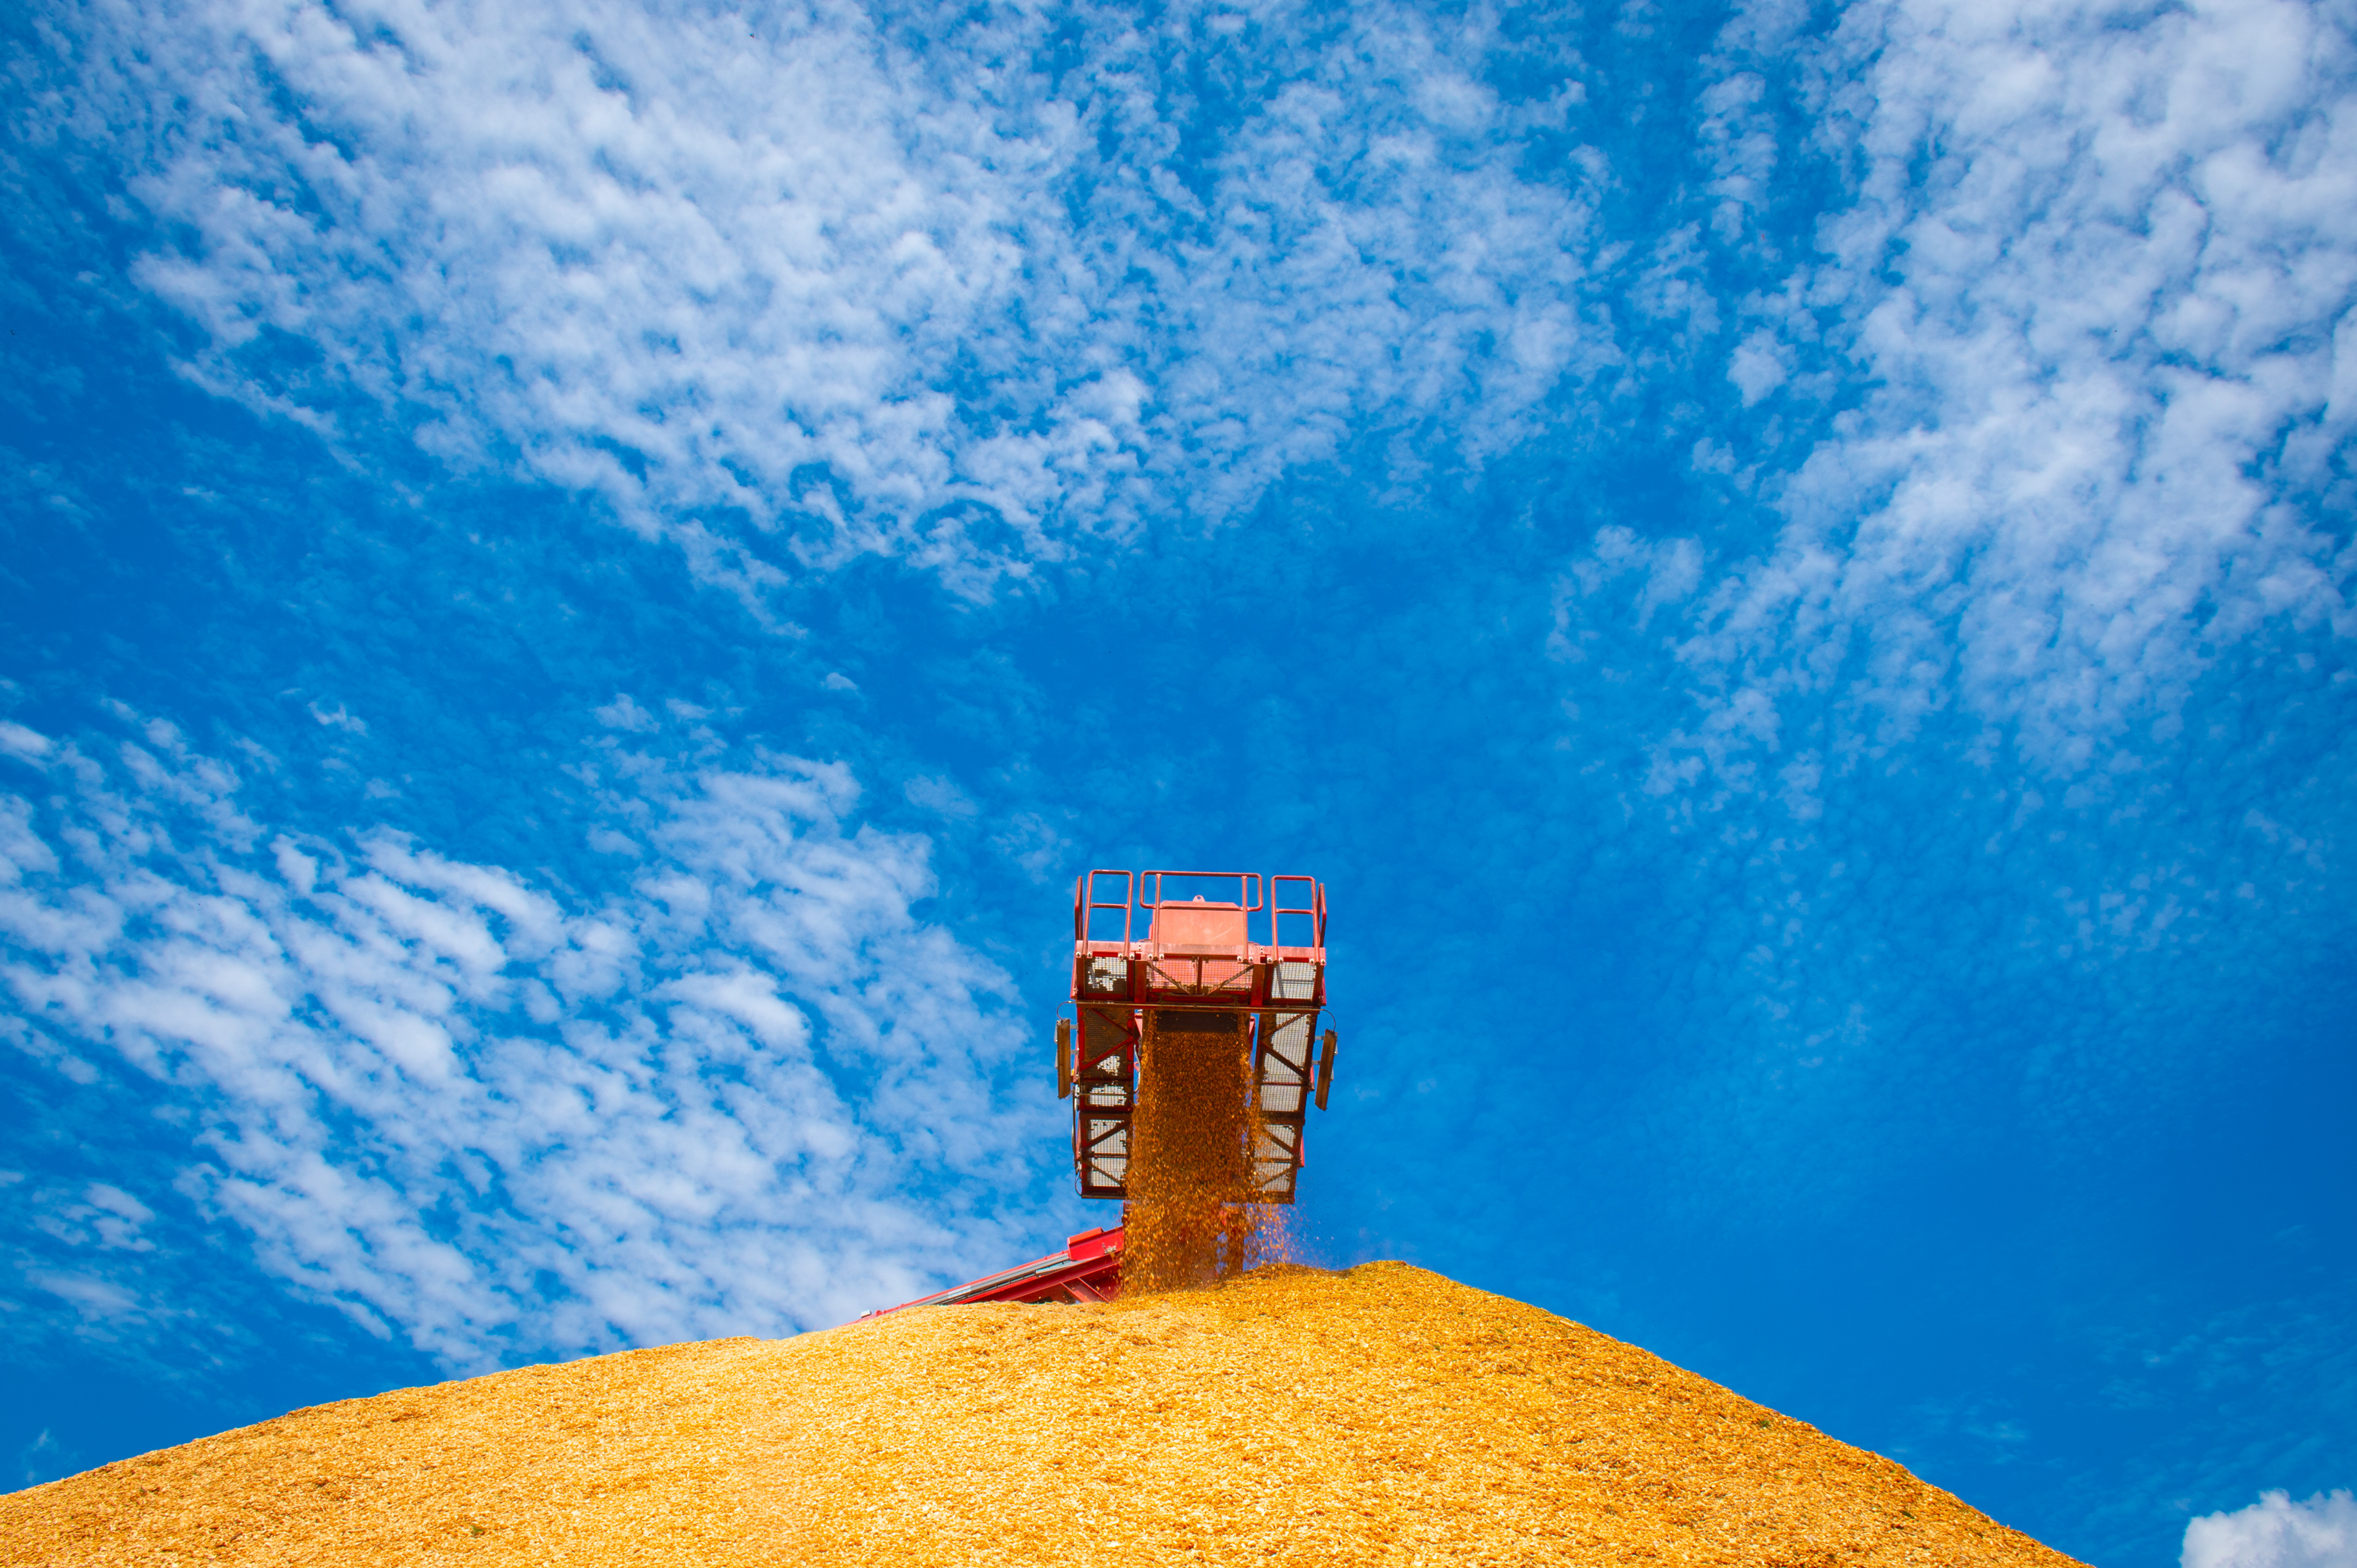
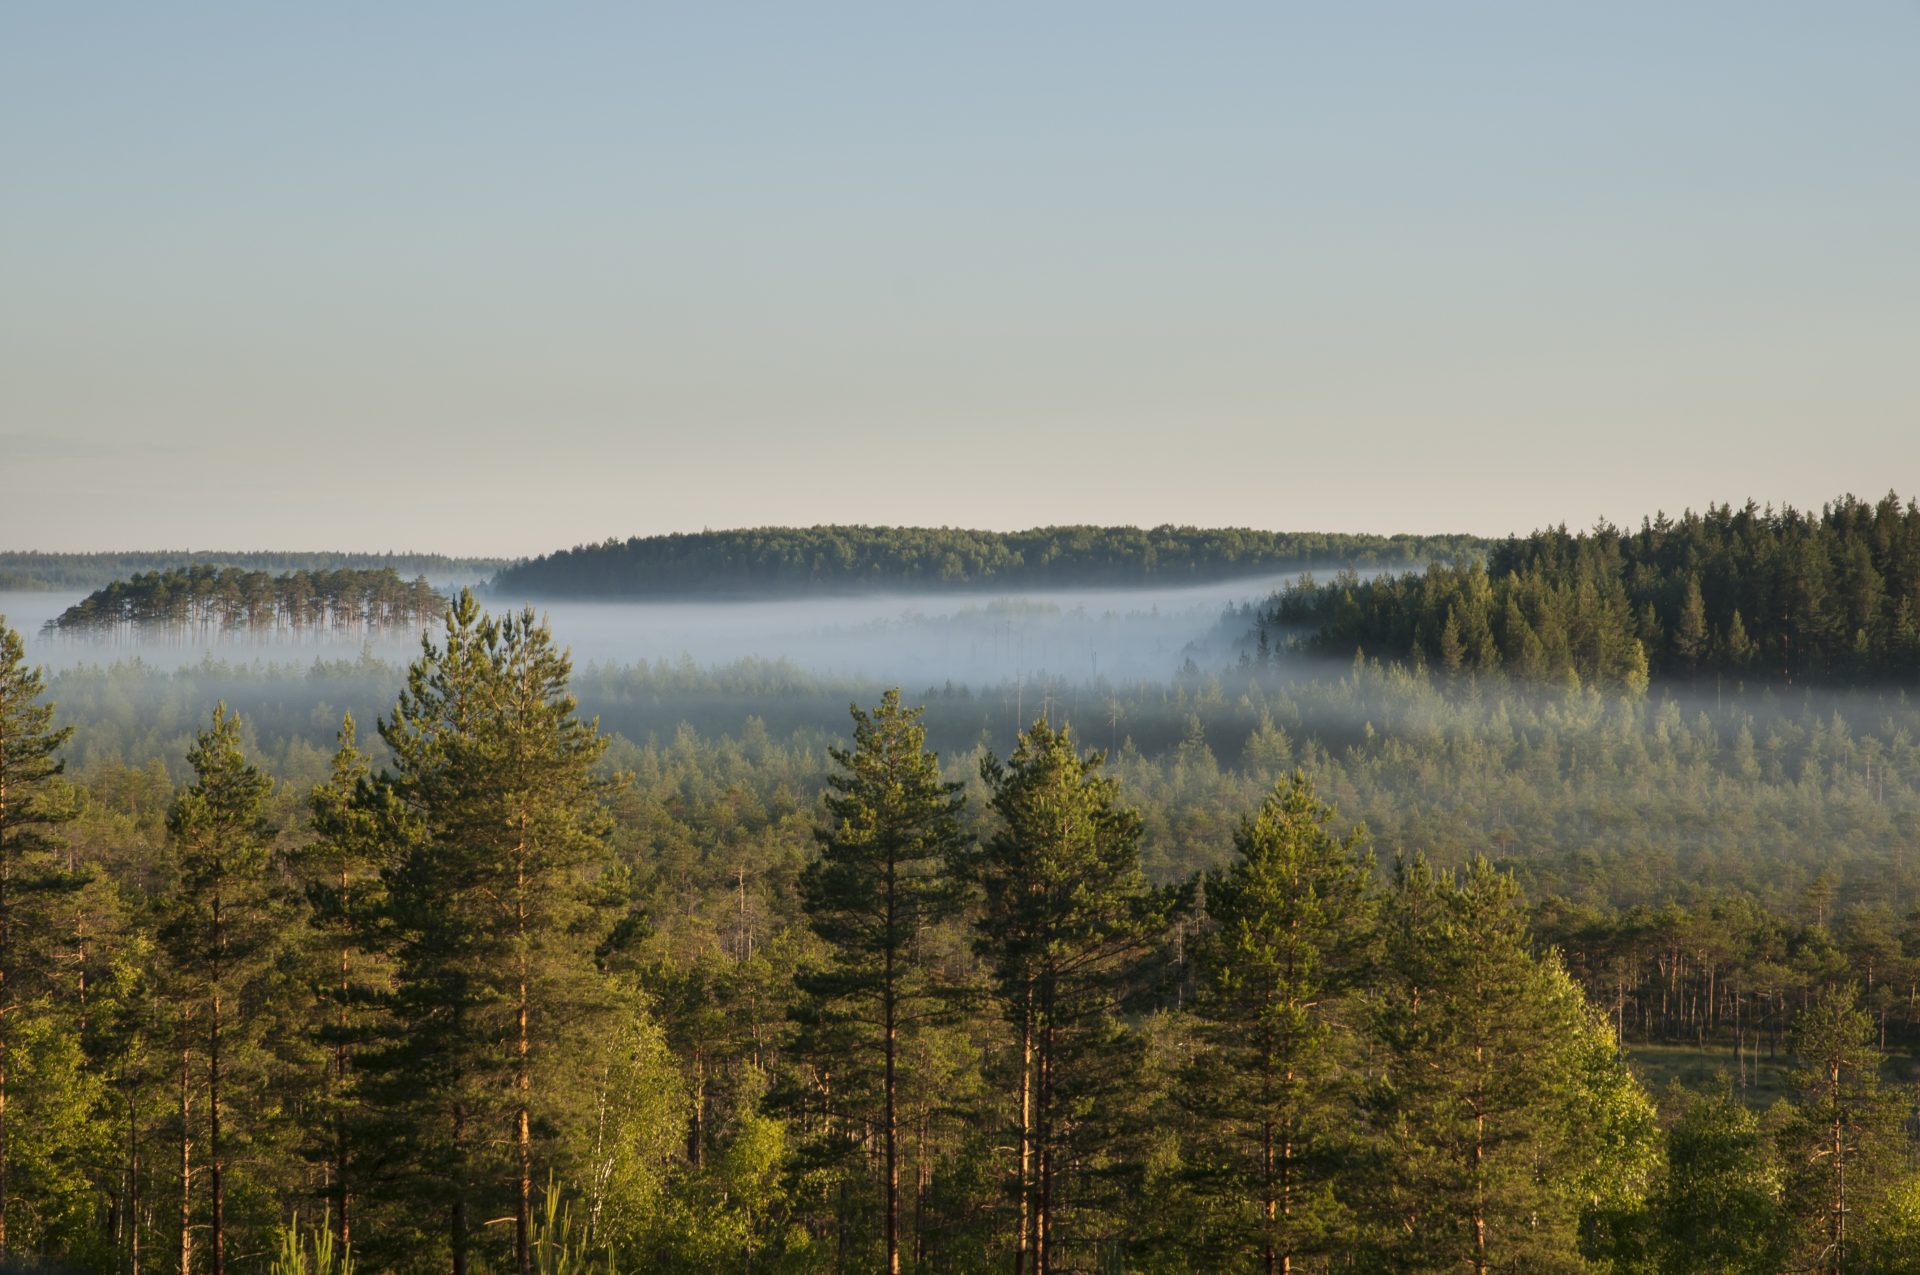
Pine trees grown for planting in the forests of the US South where more carbon is stored and more wood inventory is grown each year than fibre is extracted for wood products such as biomass pellets
This means BECCS can be used to abate, or offset, emissions from other parts of the economy that might remain even as it decarbonises. A report by The Energy Systems Catapult, modelling different approaches for the UK to reach net zero by or before 2050, suggests carbon-intensive industries such as aviation and agriculture will always produce residual emissions.
The need to counteract the remaining emissions of industries such as these make negative emissions an essential part of reaching net zero. While the report suggests that direct air carbon capture and storage (DACCS) will also play an important role in bringing CO2 levels down, it will take time for the technology to be developed and deployed at the scale needed.
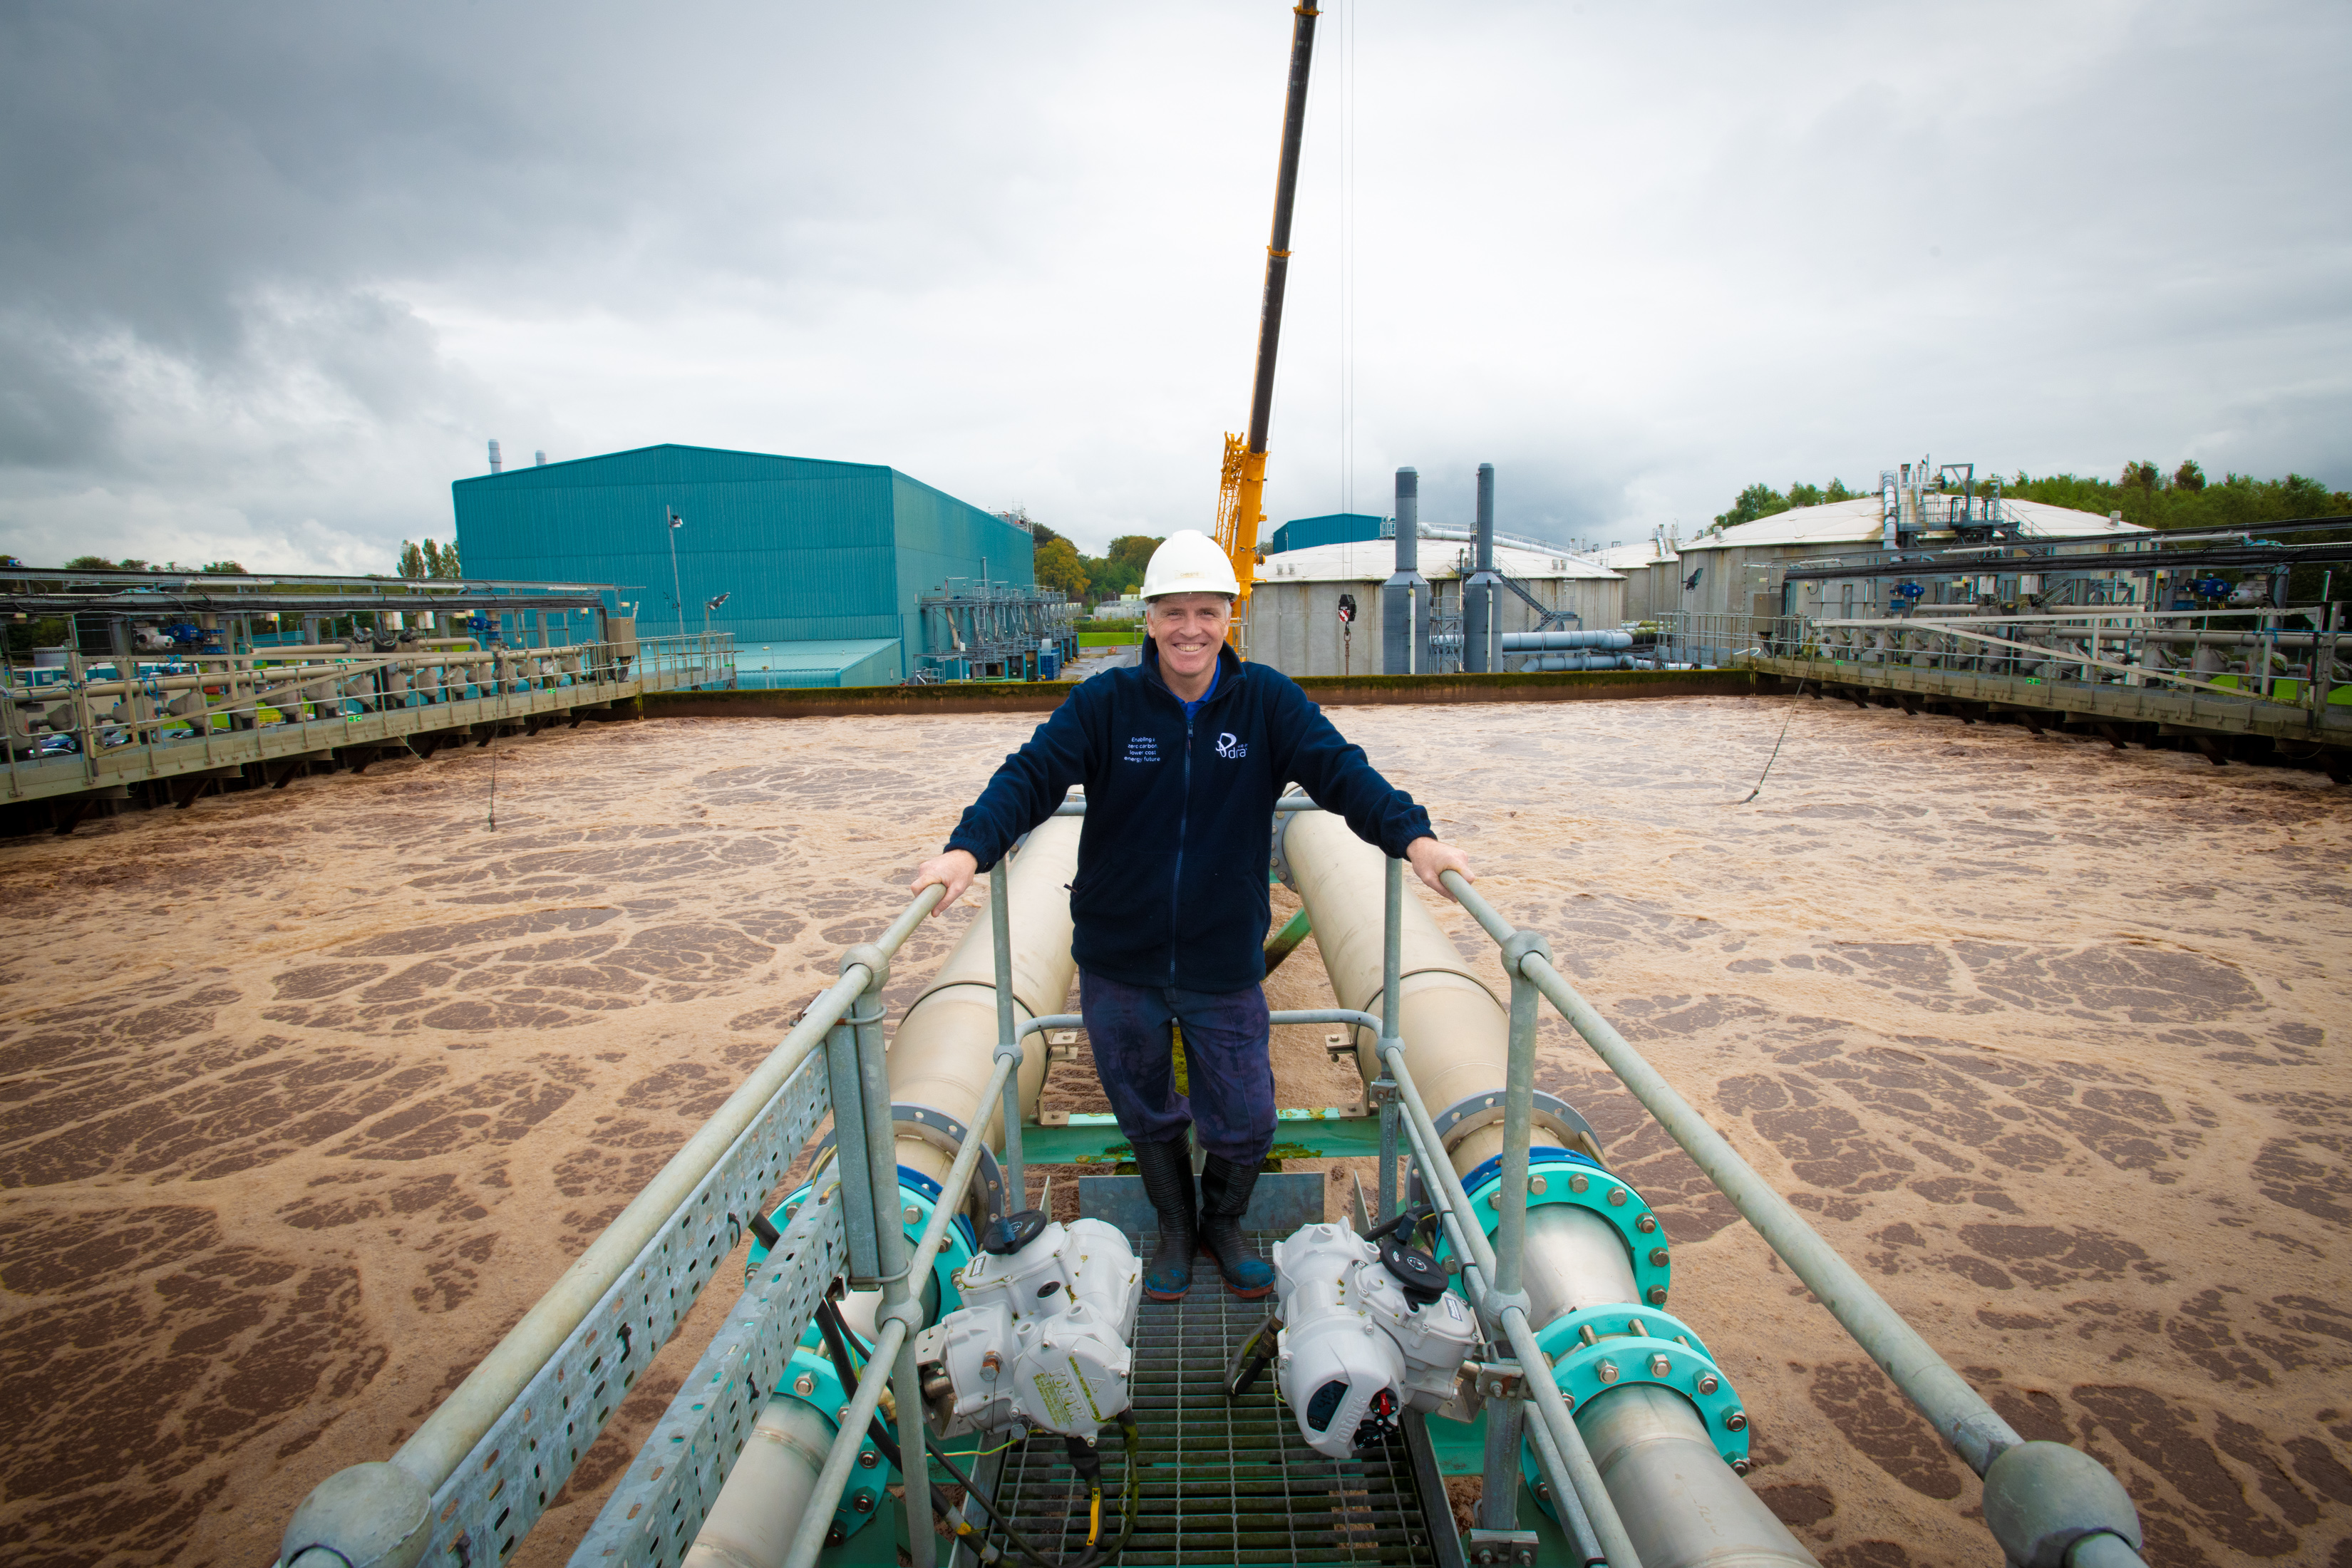
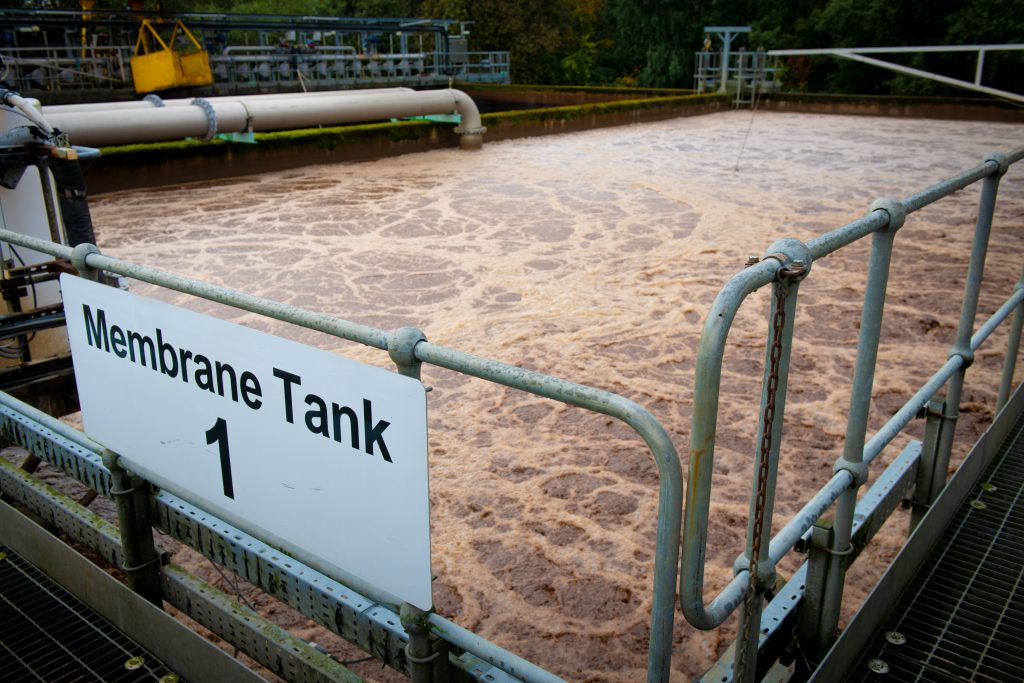
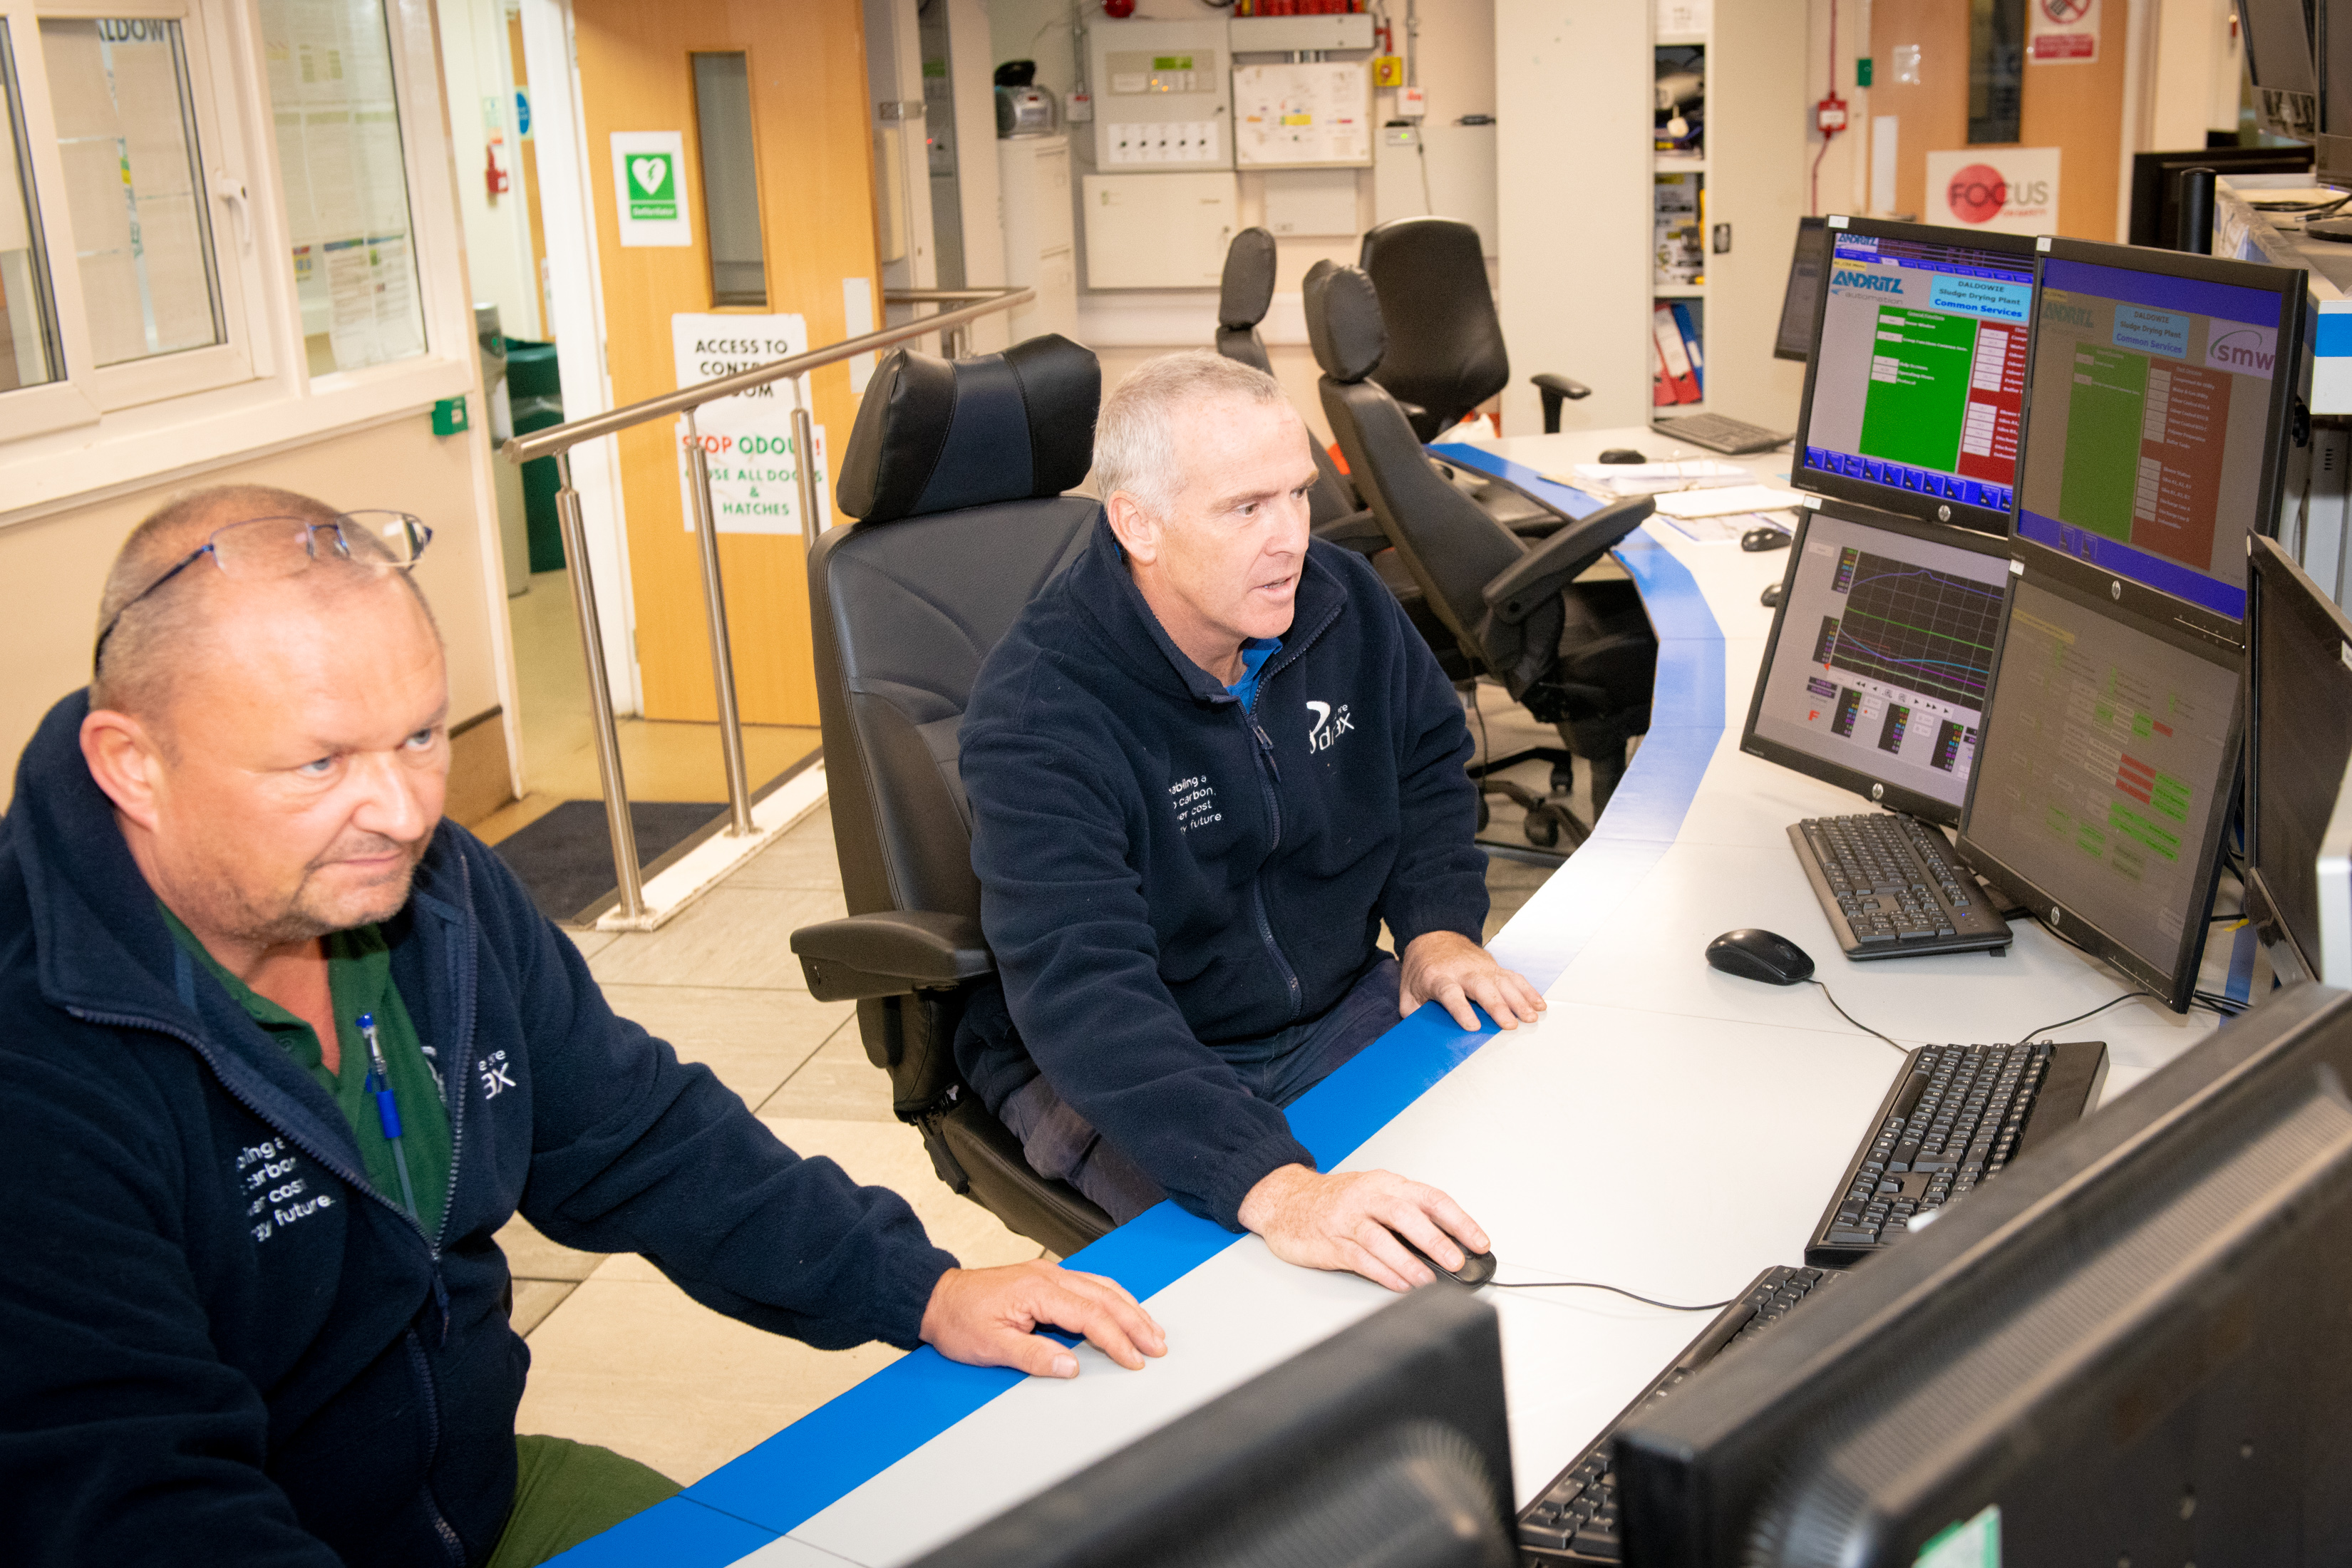
Meanwhile, carbon capture use and storage (CCUS) technology is already deployed at scale in Norway, the US, Australia and Canada. These processes for capturing and storing carbon are applicable to biomass power generation, such as at Drax Power Station, which means BECCS is ready to deploy at scale from a technology perspective today.
As well as counteracting remaining emissions, however, BECCS can also help to decarbonise other industries by enabling the growth of a different low carbon fuel: hydrogen.
Enabling a hydrogen economy
The CCC’s ‘Hydrogen in a low-carbon economy report’ highlights the needs for carbon zero alternatives to fossil fuels – in particular, hydrogen or H2.

Hydrogen produced in a test tube
When combusted, hydrogen only produces heat and water vapour, while the ability to store it for long periods makes it a cleaner replacement to the natural gas used in heating today. Hydrogen can also be stored as a liquid, which, coupled with its high energy density makes it a carbon zero alternative to petrol and diesel in heavy transport.
There are various ways BECCS can assist the creation of a hydrogen economy. Most promising is the use of biomass to produce hydrogen through a method known as gasification. In this process solid organic material is heated to more than 700°C but prevented from combusting. This causes the material to break down into gases: hydrogen and carbon monoxide (CO). The CO then reacts with water to form CO2 and more H2.
While CO2 is also produced as part of the process, biomass material absorbs CO2 while it grows, making the overall process carbon neutral. However, by deploying carbon capture here, the hydrogen production can also be made carbon negative.
BECCS can more indirectly become an enabler of hydrogen production. The Zero Carbon Humber partnership envisages Drax Power Station as the anchor project for CCUS infrastructure in the region, allowing for the production of ‘blue’ hydrogen. Blue hydrogen is produced using natural gas, a fossil fuel. However, the resulting carbon emissions could be captured. The CO2 would then be transported and stored using the same system of pipelines and a natural aquifer under the North Sea as used by BECCS facilities at Drax.
This way of clustering BECCS power and hydrogen production would also allow other industries such as manufactures, steel mills and refineries, to decarbonise.
Lowering the cost of flexible electricity
One of the challenges in transforming the energy system and wider economy to net zero is accounting for the cost of the transition.
The Energy Systems Catapult’s analysis found that it could be kept as low as 1-2% of GDP, while a report by the National Infrastructure Commission (NIC) projects that deploying BECCS would have little impact on the total cost of the power system if deployed for its negative emissions potential.
The NIC’s modelling found, when taking into consideration the costs and generation capacity of different sources, BECCS would likely be run as a baseload source of power in a net zero future. This would maximise its negative emissions potential.
This means BECCS units would run frequently and for long periods, uninterrupted by changes in the weather, rather than jumping into action to account for peaks in demand. This, coupled with its ability to abate emissions, means BECCS – alongside intermittent renewables such as wind and solar – could provide the UK with zero carbon electricity at a significantly lower cost than that of constructing a new fleet of nuclear power stations.
The report also goes on to say that a fleet of hydrogen-fuelled power stations could also be used to generate flexible back-up electricity, which therefore could be substantially cheaper than relying on a fleet of new baseload nuclear plants.
However, for this to work effectively, decisions need to be made sooner rather than later as to what approach the UK takes to shape the energy system before 2050.
The time to act is now
What is consistent across many different reports is that BECCS will be essential for any version of the future where the UK reaches net zero by 2050. But, it will not happen organically.

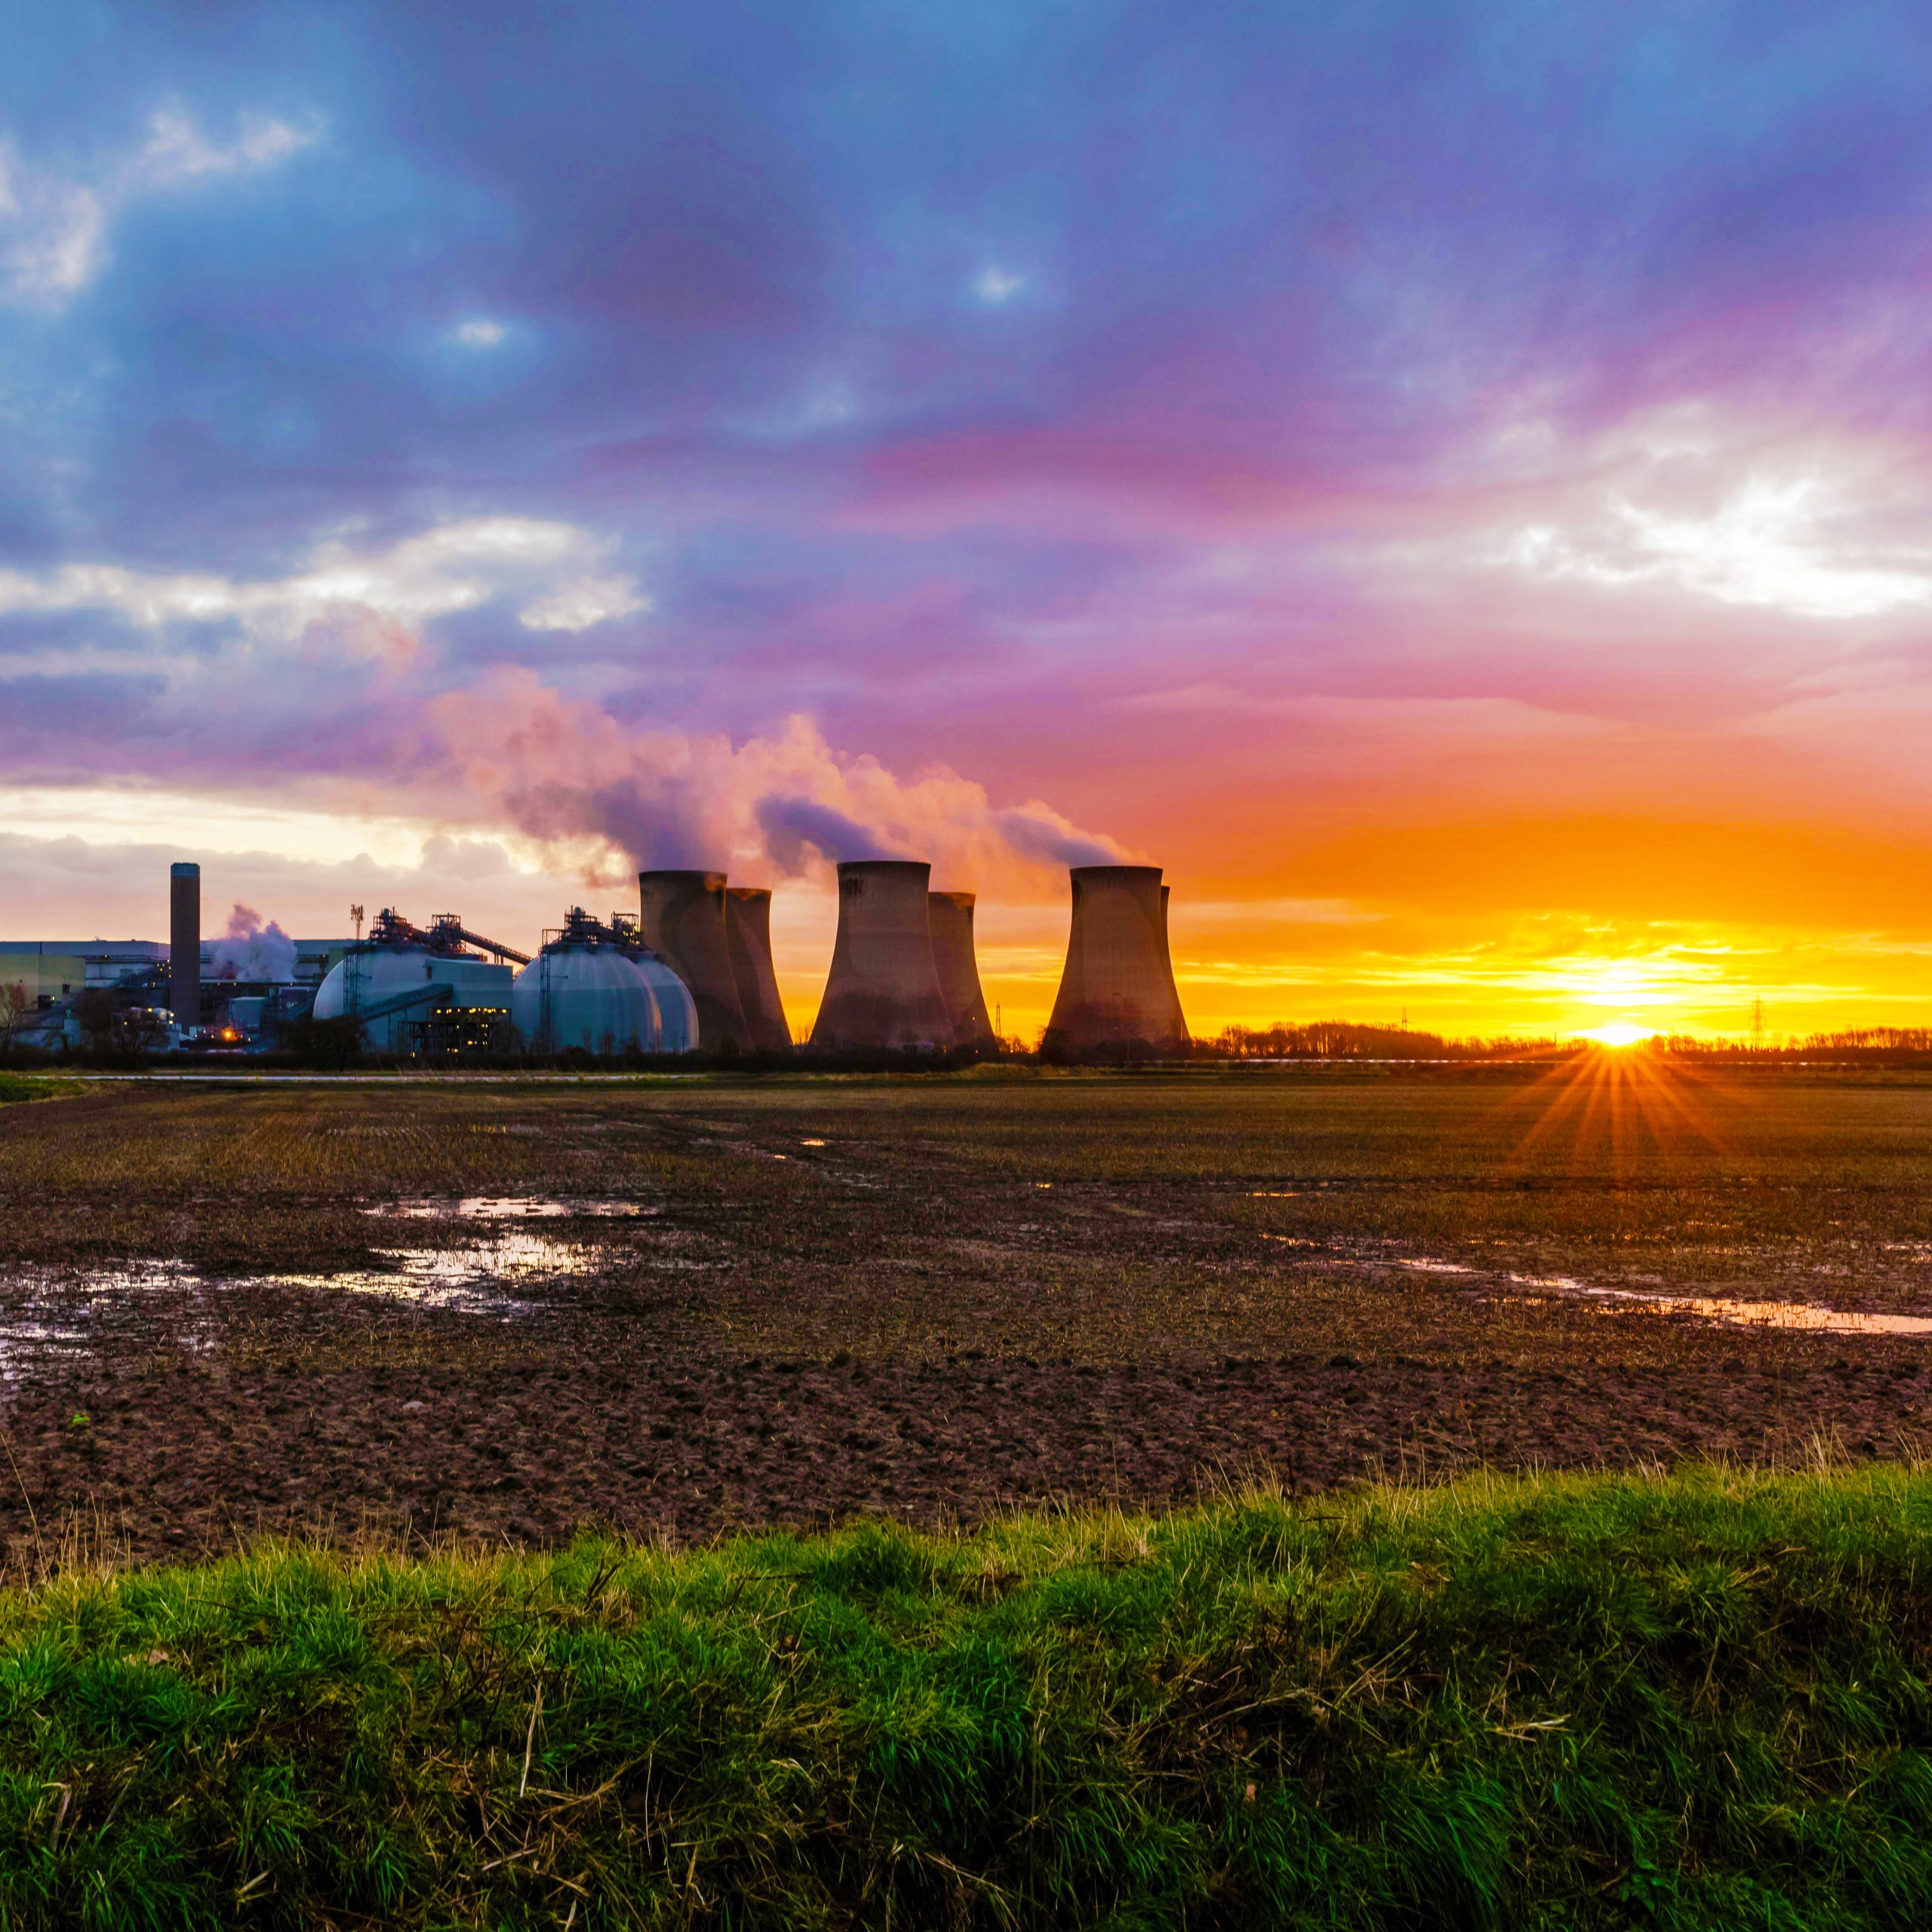
Sunset and evening clouds over the River Humber near Sunk Island, East Riding of Yorkshire
A joint Royal Society and Royal Academy of Engineering Greenhouse Gas Removal report, includes research into BECCS, DACCS and other forms of negative emissions in its list of key actions for the UK to reach net zero. It also calls for the UK to capitalise on its access to natural aquifers and former oil and gas wells for CO2 storage in locations such as the North Sea, as well as its engineering expertise, to establish the infrastructure needed for CO2 transport and storage.
However, this will require policies and funding structures that make it economical. A report by Vivid Economics for the Department for Business, Energy and Industrial Strategy (BEIS) highlights that – just as incentives have made wind and solar viable and integral parts of the UK’s energy mix – BECCS and other technologies, need the same clear, long-term strategy to enable companies to make secure investments and innovate.
However, for policies to make the impact needed to ramp BECCS up to the levels necessary to bring the UK to net zero, action is needed now. The report outlines policies that could be implemented immediately, such as contracts for difference, or negative emissions obligations for residual emitters. For BECCS deployment to expand significantly in the 2030s, a suitable policy framework will need to be put in place in the 2020s.
Beyond just decarbonising the UK, a report by the Intergovernmental Panel on Climate Change (IPCC) highlights that BECCS could be of even more importance globally. Differing scales of BECCS deployment are illustrated in its scenarios where global warming is kept to within 1.5oC levels of pre-industrial levels, as per the Paris Climate agreement.
BECCS has the potential to play a vital role in power generation, creating a hydrogen economy and offsetting other emissions. As it continues to progress, it is becoming increasingly effective and cost efficient, offering a key component of a net zero UK.
Learn more about carbon capture, usage and storage in our series:
- Planting, sinking, extracting – some of the ways to absorb carbon from the atmosphere
- From capture methods to storage and use across three continents, these companies are showing promising results for CCUS
- The science of safely and permanently putting carbon in the ground
- The numbers must add up to enable negative emissions in a zero carbon future, says Drax Group CEO Will Gardiner.
- The power industry is leading the charge in carbon capture and storage but where else could the technology make a difference to global emissions?
- From NASA to carbon capture, chemical reactions could have a big future in electricity
- A roadmap for the world’s first zero carbon industrial cluster: protecting and creating jobs, fighting climate change, competing on the world stage
- Can we tackle two global challenges with one solution: turning captured carbon into fish food?
- How algae, paper and cement could all have a role in a future of negative emissions
- How the UK can achieve net zero
- Transforming emissions from pollutants to products
- Drax CEO addresses Powering Past Coal Alliance event in Madrid, unveiling our ambition to play a major role in fighting the climate crisis by becoming the world’s first carbon negative company


![Reforestation in Estonia. * Note: Since 2014 it has not been compulsory for private and other forest owners to submit reforestation data. [Click to view/download]](https://www.drax.com/wp-content/uploads/2020/03/figure_3.13.png)
![Species mix in Estonian forests [Click to view/download]](https://www.drax.com/wp-content/uploads/2020/03/figure_3.3.png)
![Comparison of sawlog and pulpwood prices [click to view/download]](https://www.drax.com/wp-content/uploads/2020/03/Picture-1.pdf2_-1.png)