This announcement contains inside information
RNS Number: 2805O
Drax Group PLC
(“Drax”, “the Group”, “Drax Group”, “the Company”; Symbol: DRX)
Drax is pleased to announce that it has signed an agreement (the “Acquisition Agreement”) with Pinnacle Renewable Energy Inc. (PL.TO) (“Pinnacle”), providing for the acquisition by Drax Canadian Holdings Inc., an indirect, wholly-owned subsidiary of Drax, of the entire issued share capital of Pinnacle (the “Acquisition”). The Acquisition will be implemented by way of a statutory plan of arrangement in accordance with the laws of the Province of British Columbia, Canada, at a price of C$11.30 per share (representing a premium of 13% based on the closing market price as at 5 February of C$10.04 per share and valuing the fully diluted equity of Pinnacle at C$385 million (£226 million(1)), with an implied enterprise value of C$741 million, including C$356 million of net debt(2)). The Acquisition, which remains subject to Drax and Pinnacle shareholder approval, court approval, regulatory approvals and the satisfaction of certain other customary conditions, has been unanimously recommended by the board of Pinnacle and has the full support of Pinnacle’s major shareholder, affiliates of ONCAP (which, together hold shares representing approximately 31% of Pinnacle’s shares as at 5 February 2021). Completion is expected to occur in the second or third quarter of 2021.
The Board believes that the Acquisition advances Drax’s biomass strategy by more than doubling its biomass production capacity, significantly reducing its cost of biomass production and adding a major biomass supply business underpinned by long-term contracts with high-quality Asian and European counterparties. The Acquisition positions Drax as the world’s leading sustainable biomass generation and supply business alongside the continued development of Drax’s ambition to be a carbon negative company by 2030, using Bioenergy Carbon Capture and Storage (BECCS).
Highlights
- Compelling opportunity to advance Drax biomass strategy
- Adds 2.9 million tonnes of biomass production capacity
- Significantly reduces Drax average cost of production(3)
- Increased global reach and presence in third-party markets
- C$6.7 billion of contracted sales to counterparties in Asia and Europe
- 99% of capacity contracted through to 2026, significant volumes contracted post 2027
- Strong return on investment
- Cash generative with 2022 EBITDA consensus of C$99 million
- Expected returns significantly ahead of Drax’s WACC
- Funded from cash and existing agreements
- Reinforces sustainable and growing dividend
The world’s leading sustainable biomass generation and supply business
- Drax and Pinnacle combined
- 17 pellets plants, three major fibre baskets, four deep water ports
- 4.9Mt capacity from 2022 – 2.9Mt available for self-supply
- 2.6GW of renewable biomass generation, with potential for BECCS
- Global growth opportunities for sustainable biomass
Commenting on today’s announcement Will Gardiner, Chief Executive Officer of Drax, said:
“I am excited about this deal which positions Drax as the world’s leading sustainable biomass generation and supply business, progressing our strategy to increase our self-supply, reduce our biomass production cost and create a long-term future for sustainable biomass.

Drax Group CEO Will Gardiner in the control room at Drax Power Station [Click to view/download]
“We expect to benefit greatly from Pinnacle’s operational and commercial expertise, and I am looking forward to what we can achieve together.
“It will pave the way for our plans to use Bioenergy with Carbon Capture and Storage (BECCS), and become a carbon negative company by 2030 – permanently removing millions of tonnes of carbon dioxide from the atmosphere each year. Negative emissions from BECCS are vital if we are to address the global climate emergency whilst also providing renewable electricity needed in a net zero economy, supporting jobs and clean growth in a post-COVID recovery.”
Duncan Davies, Chief Executive Officer of Pinnacle, said:
“Pinnacle’s Board of Directors has unanimously determined that the transaction represents the best course of action for the company and its shareholders. On closing, the transaction will deliver immediate, significant and certain cash value to our shareholders. At the same time, the combination of Pinnacle and Drax will create a global leader in sustainable biomass with the vision, technical expertise and financial strength to help meet the growing demand for renewable energy products, which is exciting for our employees, customers and others around the world.”
Drax’s sustainable biomass strategy
Sustainable biomass has an important role to play in global energy markets as a flexible and sustainable source of renewable energy, as well as having the potential to deliver negative emissions. Drax believes that the Acquisition accelerates the Group’s strategic objectives to increase its available self-supply of sustainable biomass to five million tonnes per annum (Drax currently operates 1.6 million tonnes of capacity with 0.4 million tonnes in development) and reduce the cost of biomass to £50/MWh(4) by 2027. Through the delivery of these strategic objectives Drax aims to create a long-term future for sustainable biomass, including third-party supply, BECCS and merchant biomass generation.

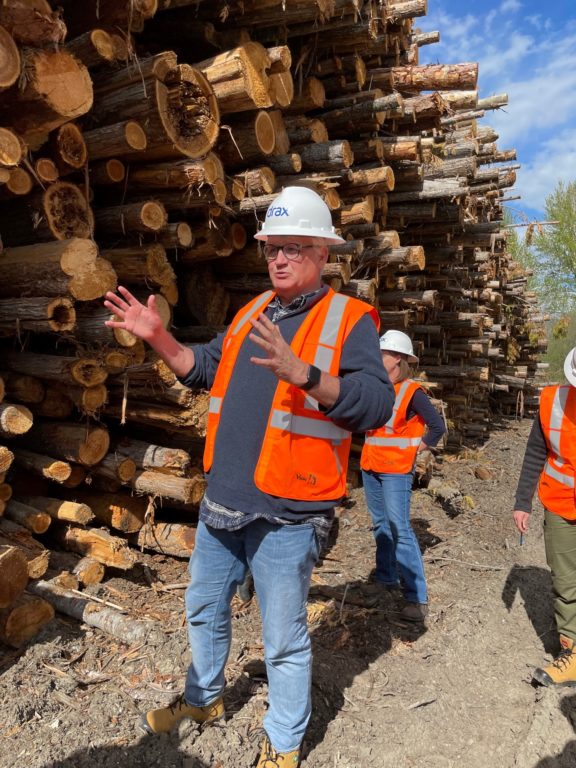
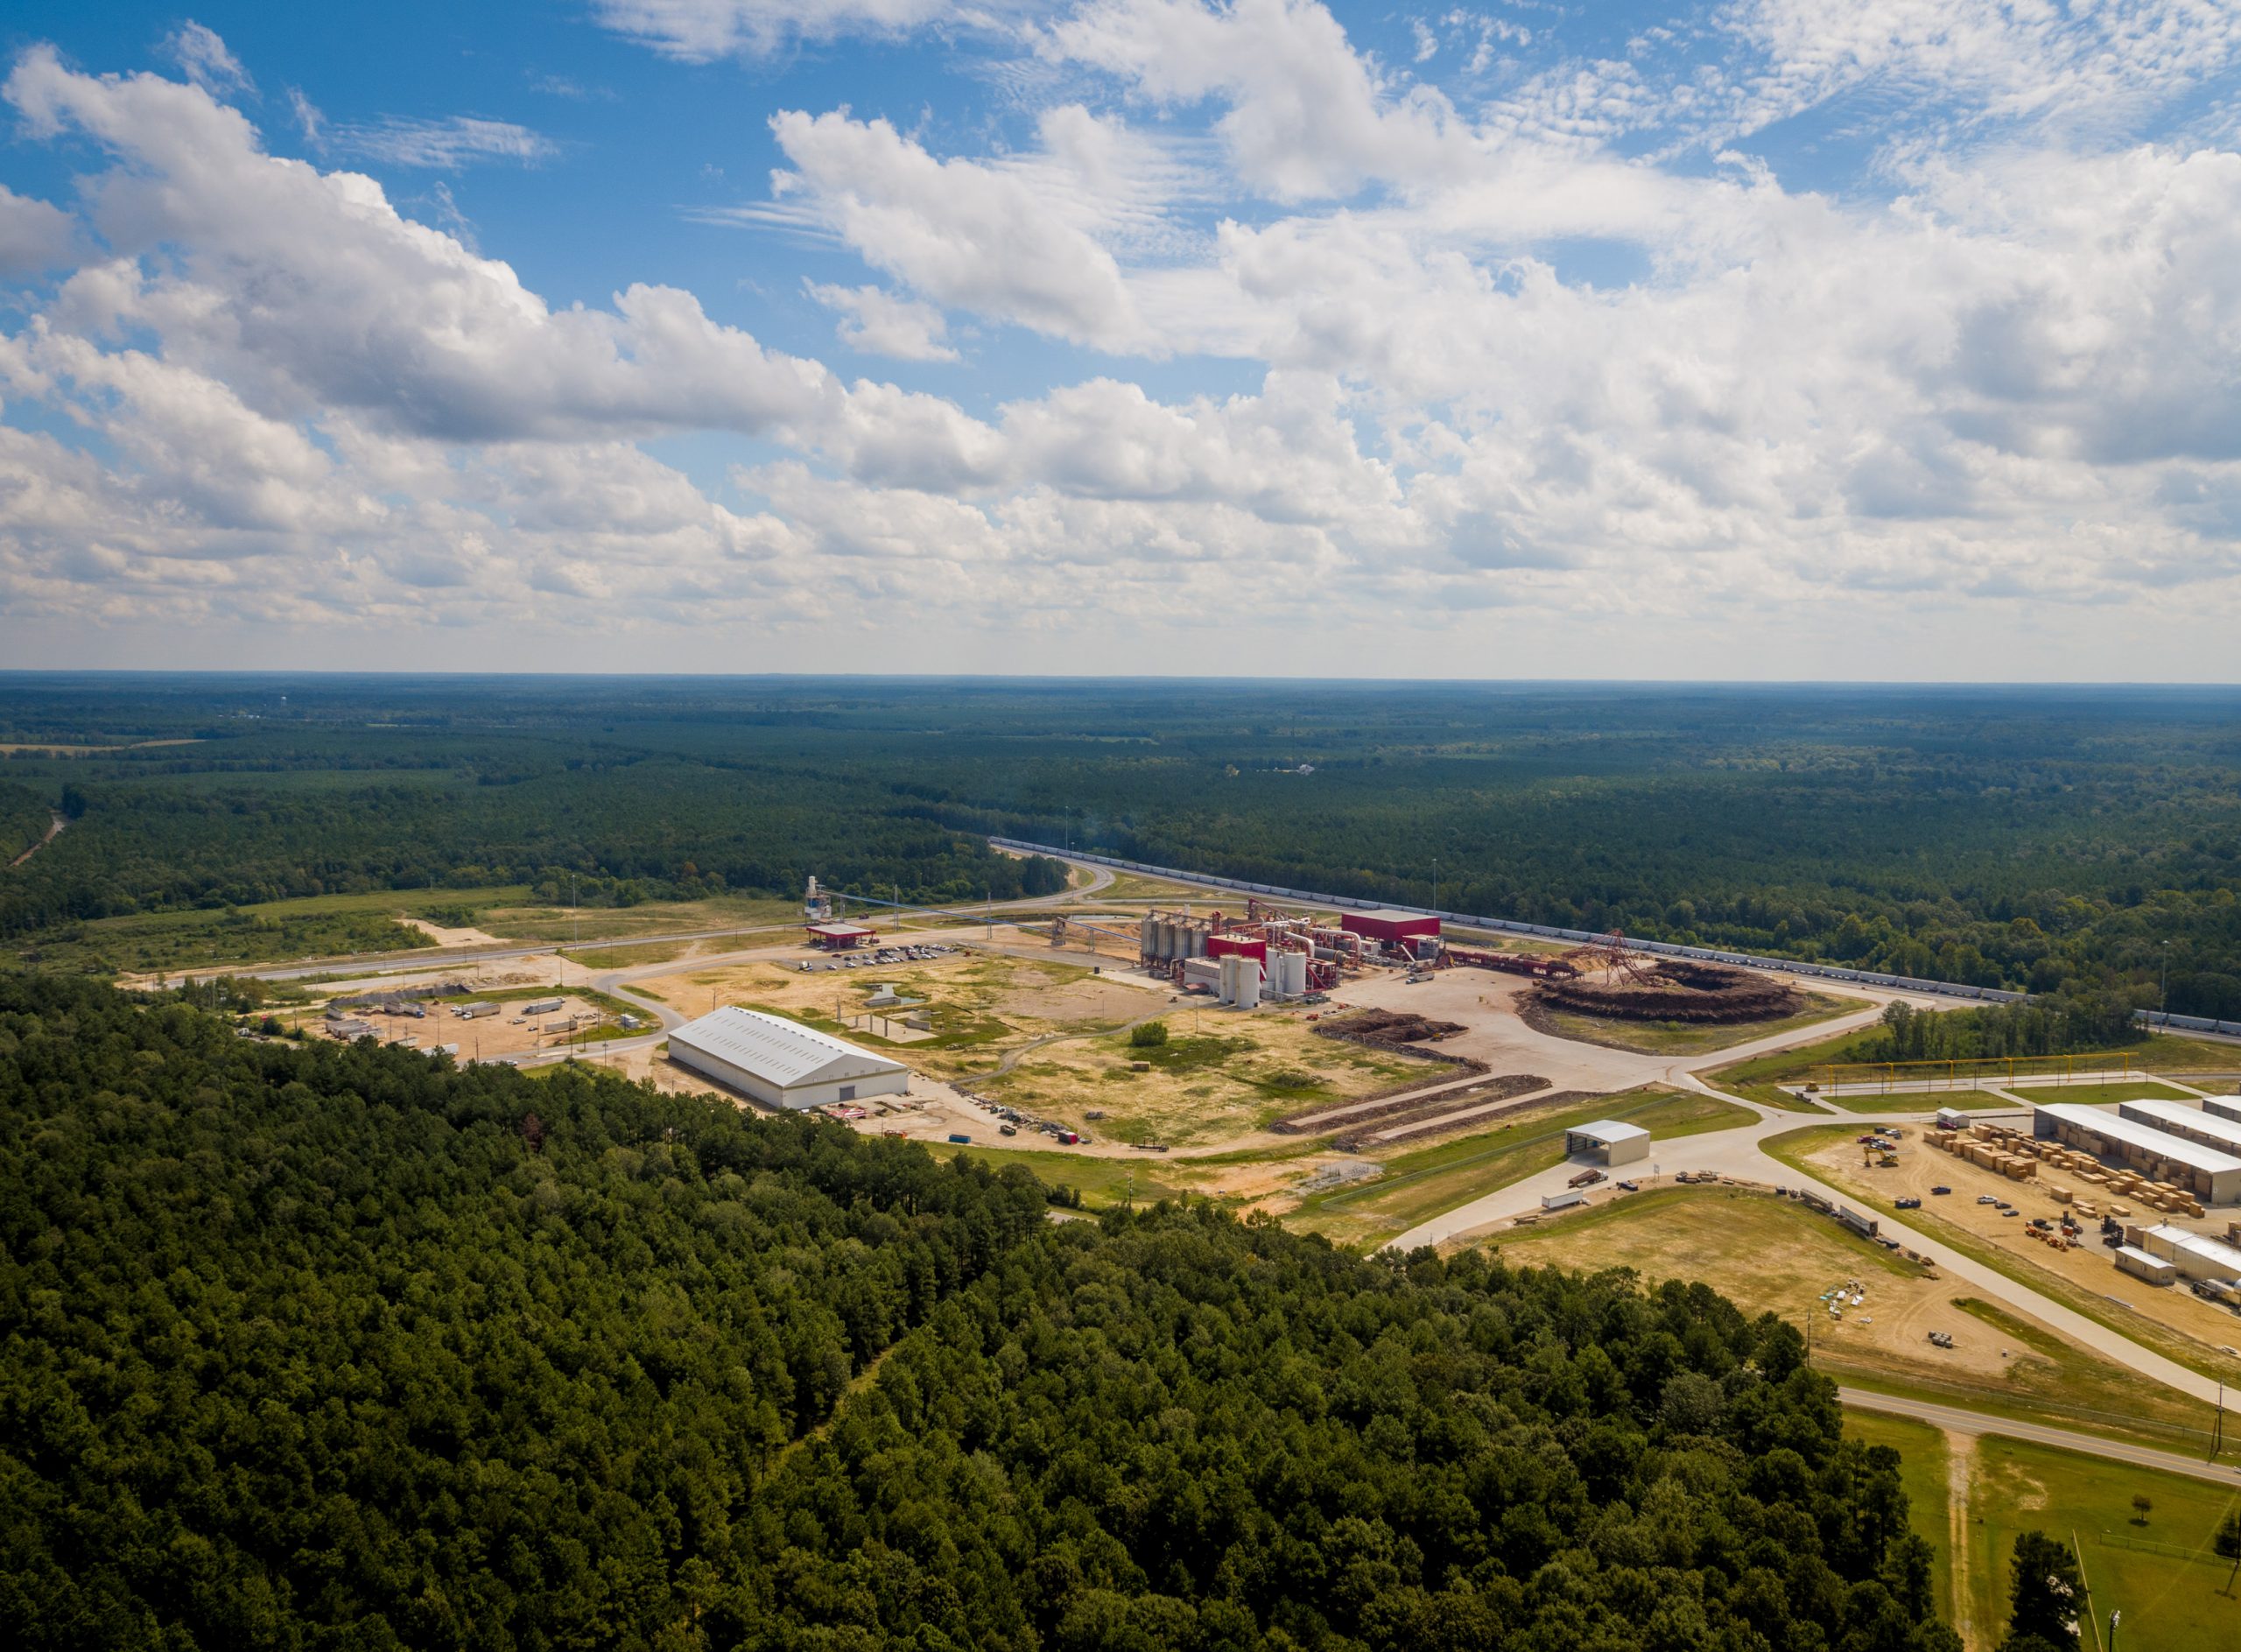
Employee at Morehouse BioEnergy in Louisiana
The Group’s enlarged supply chain will have access to 4.9 million tonnes of operational capacity from 2022. Of this total, 2.9 million tonnes are available for Drax’s self-supply requirements in 2022 (increasing to 3.4 million tonnes in 2027). Drax aims to increase the level of third-party sales and further expand its capacity to meet its target of five million tonnes of self-supply by 2027.
Drax believes that the Acquisition is highly complementary to the Group’s other long-term strategic options for biomass. Once optimised, the enlarged group’s biomass supply chain will support Drax’s own generation requirements, including the potential development of BECCS, whilst also serving the growing biomass markets in Europe and Asia via long-term off-take agreements.
A major producer and supplier of good-quality, low-cost sustainable biomass
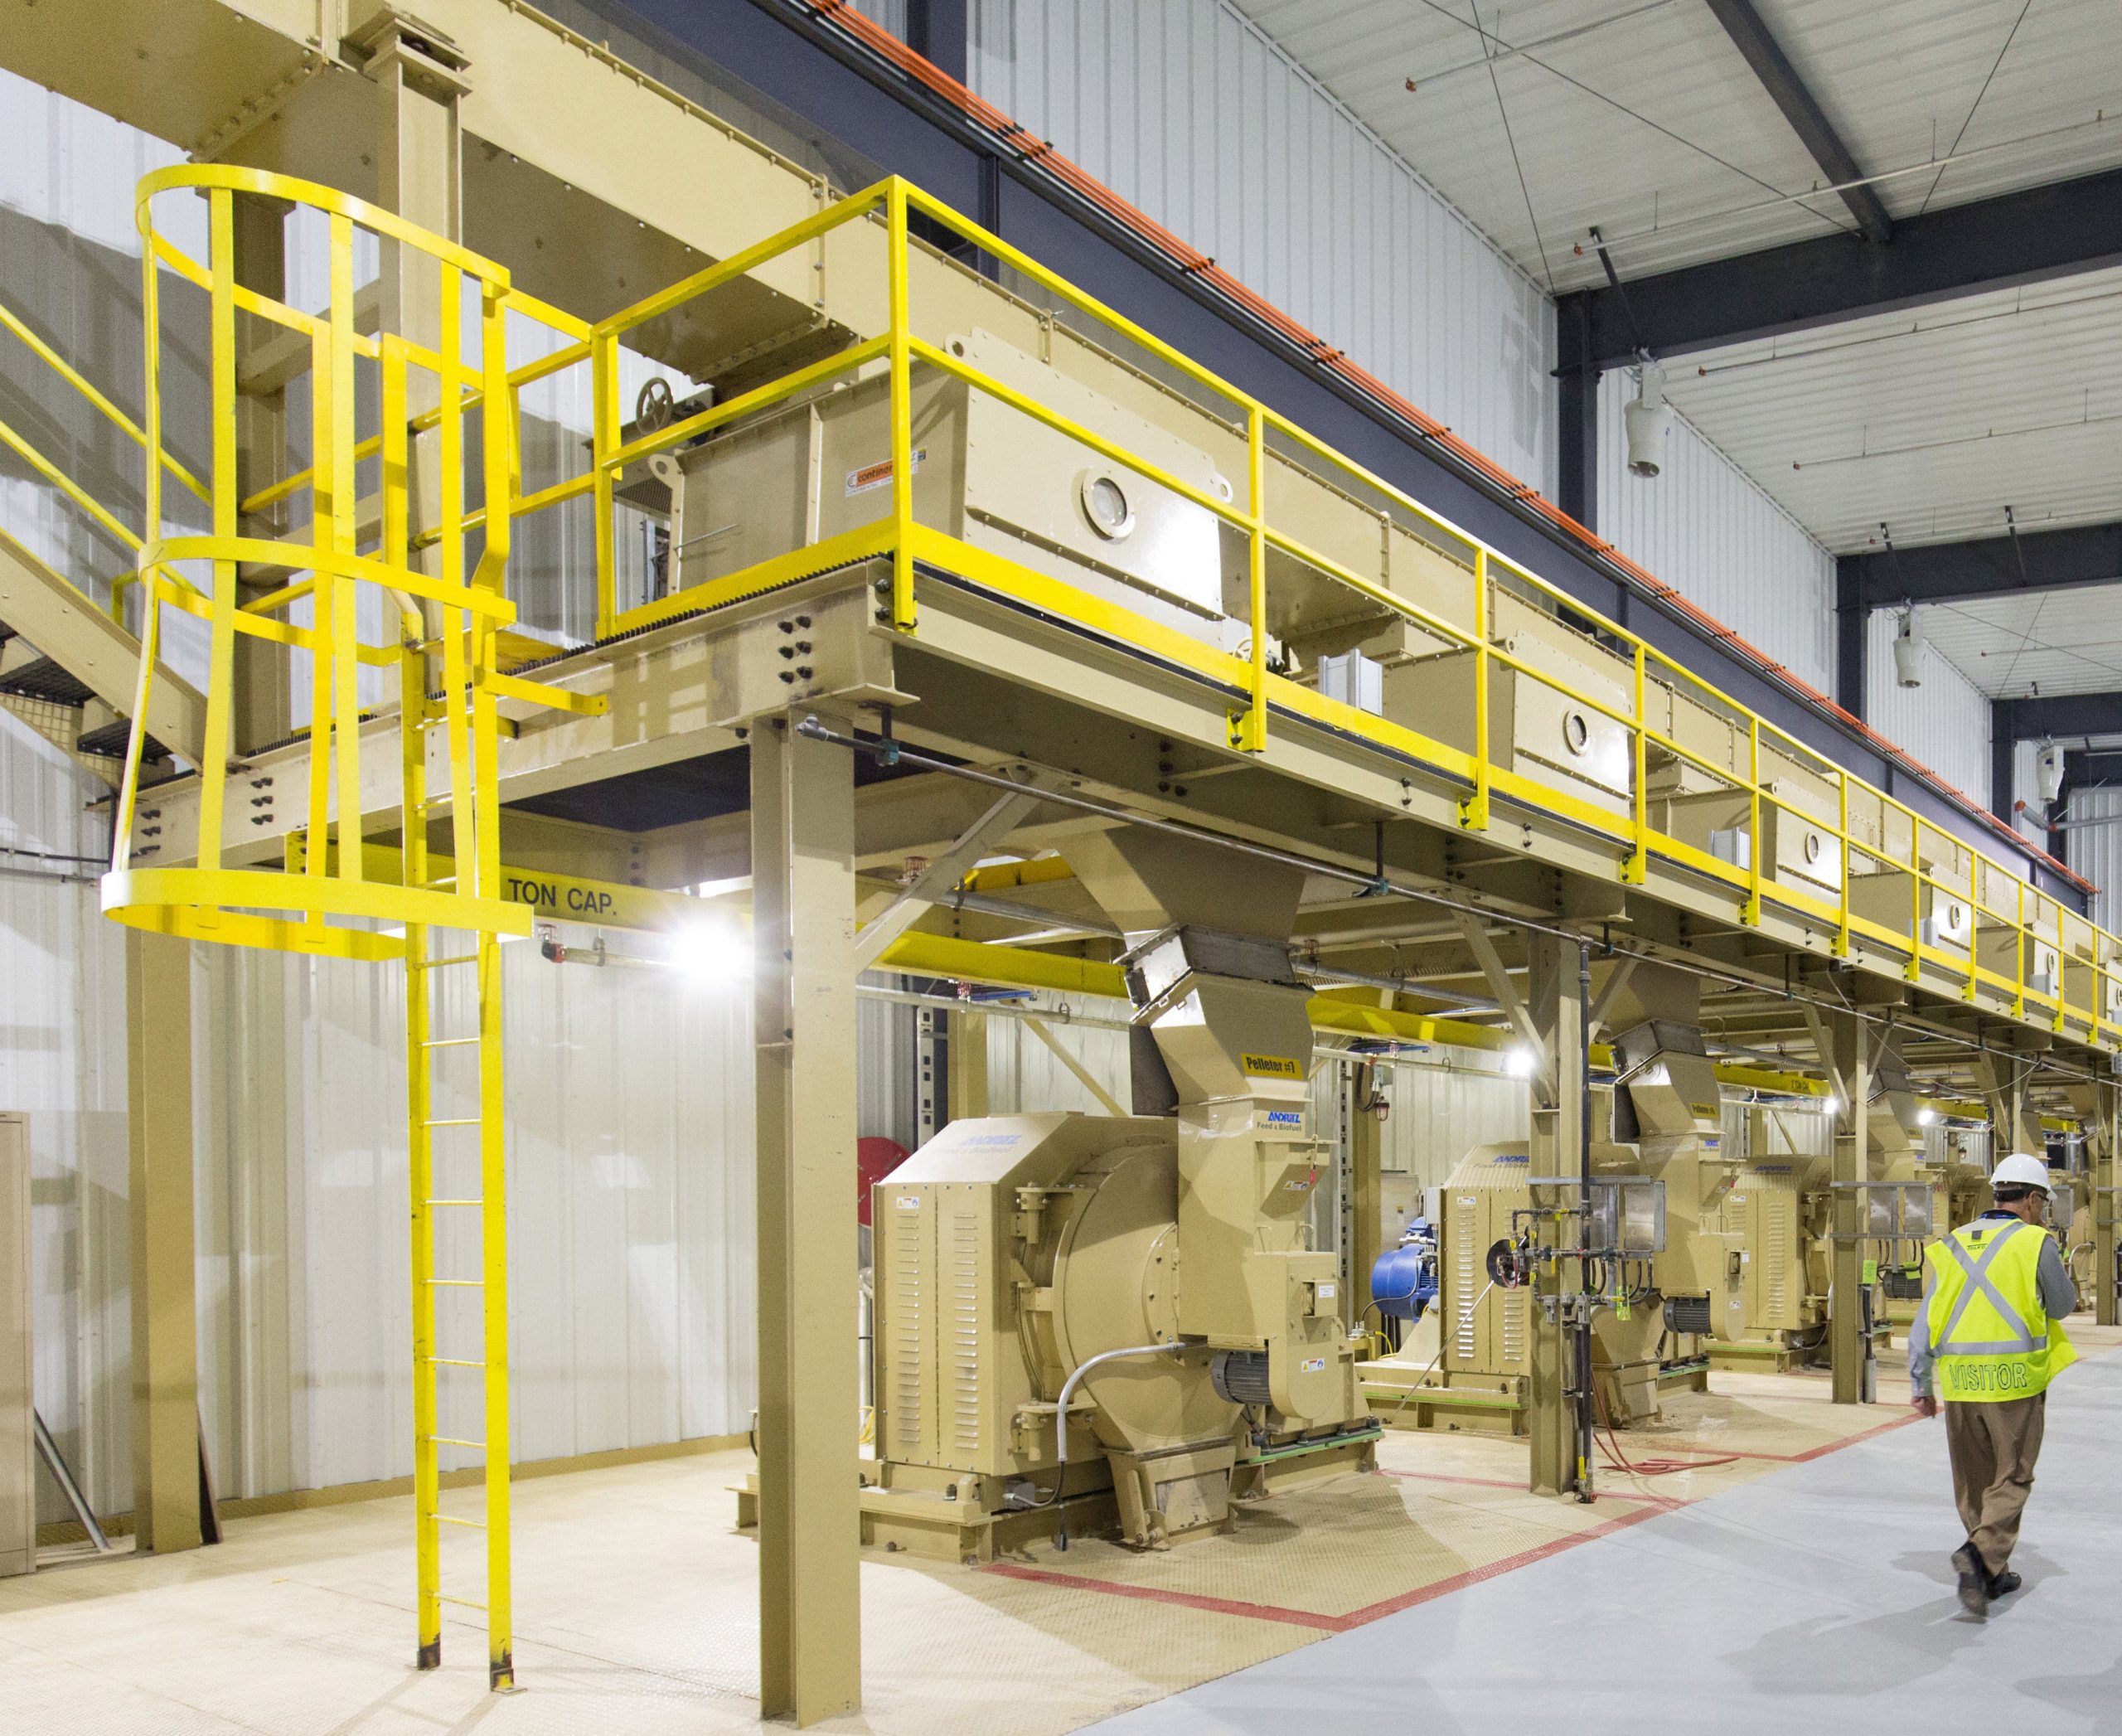
Pinnacle, which is listed on the Toronto Stock Exchange, operates 2.5 million tonnes of biomass capacity at sites in Western Canada and the Southeastern US, with a further 0.4 million tonnes of capacity in development (commissioning in 2021). Investment in this new capacity is expected to be substantially complete in the first half of 2021. Once the new capacity is commissioned, Pinnacle’s nameplate production capacity is expected to increase to 2.9 million tonnes per annum.
Pinnacle has ownership of c.80% of this nameplate capacity, with the remaining c.20% co-owned with its forestry industry joint venture partners, ensuring strong commercial relationships and shared interests in security of supply. Pinnacle has sales and marketing rights to 100% of the output from all sites.
Pinnacle is a key supplier of wood pellets for Drax and other third parties in Asia and Europe, with C$6.7 billion of contracted third-party sales (including sales to Drax).

Wood pellets loaded onto vessel at Westview Terminal, British Columbia
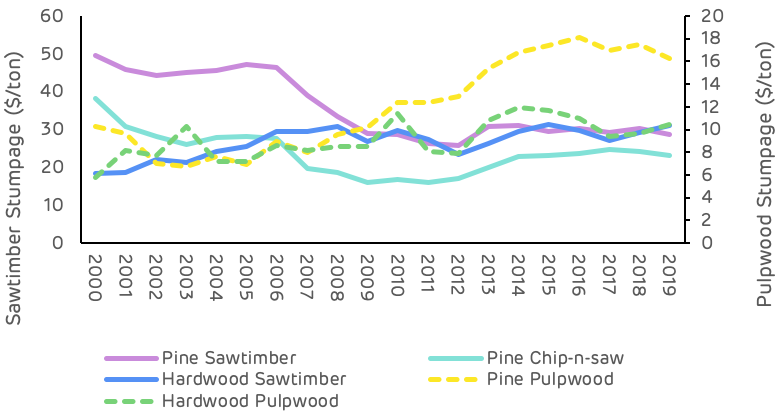
Through scale, operational efficiency and low-cost fibre sourcing, Pinnacle is currently produces biomass at a lower cost than Drax, with a like-for-like 2019 production cost of US$124/tonne(3), compared to Drax’s 2019 production cost of US$161/tonne(3). The pro forma 2019 production cost for the combined business is US$141/tonne.
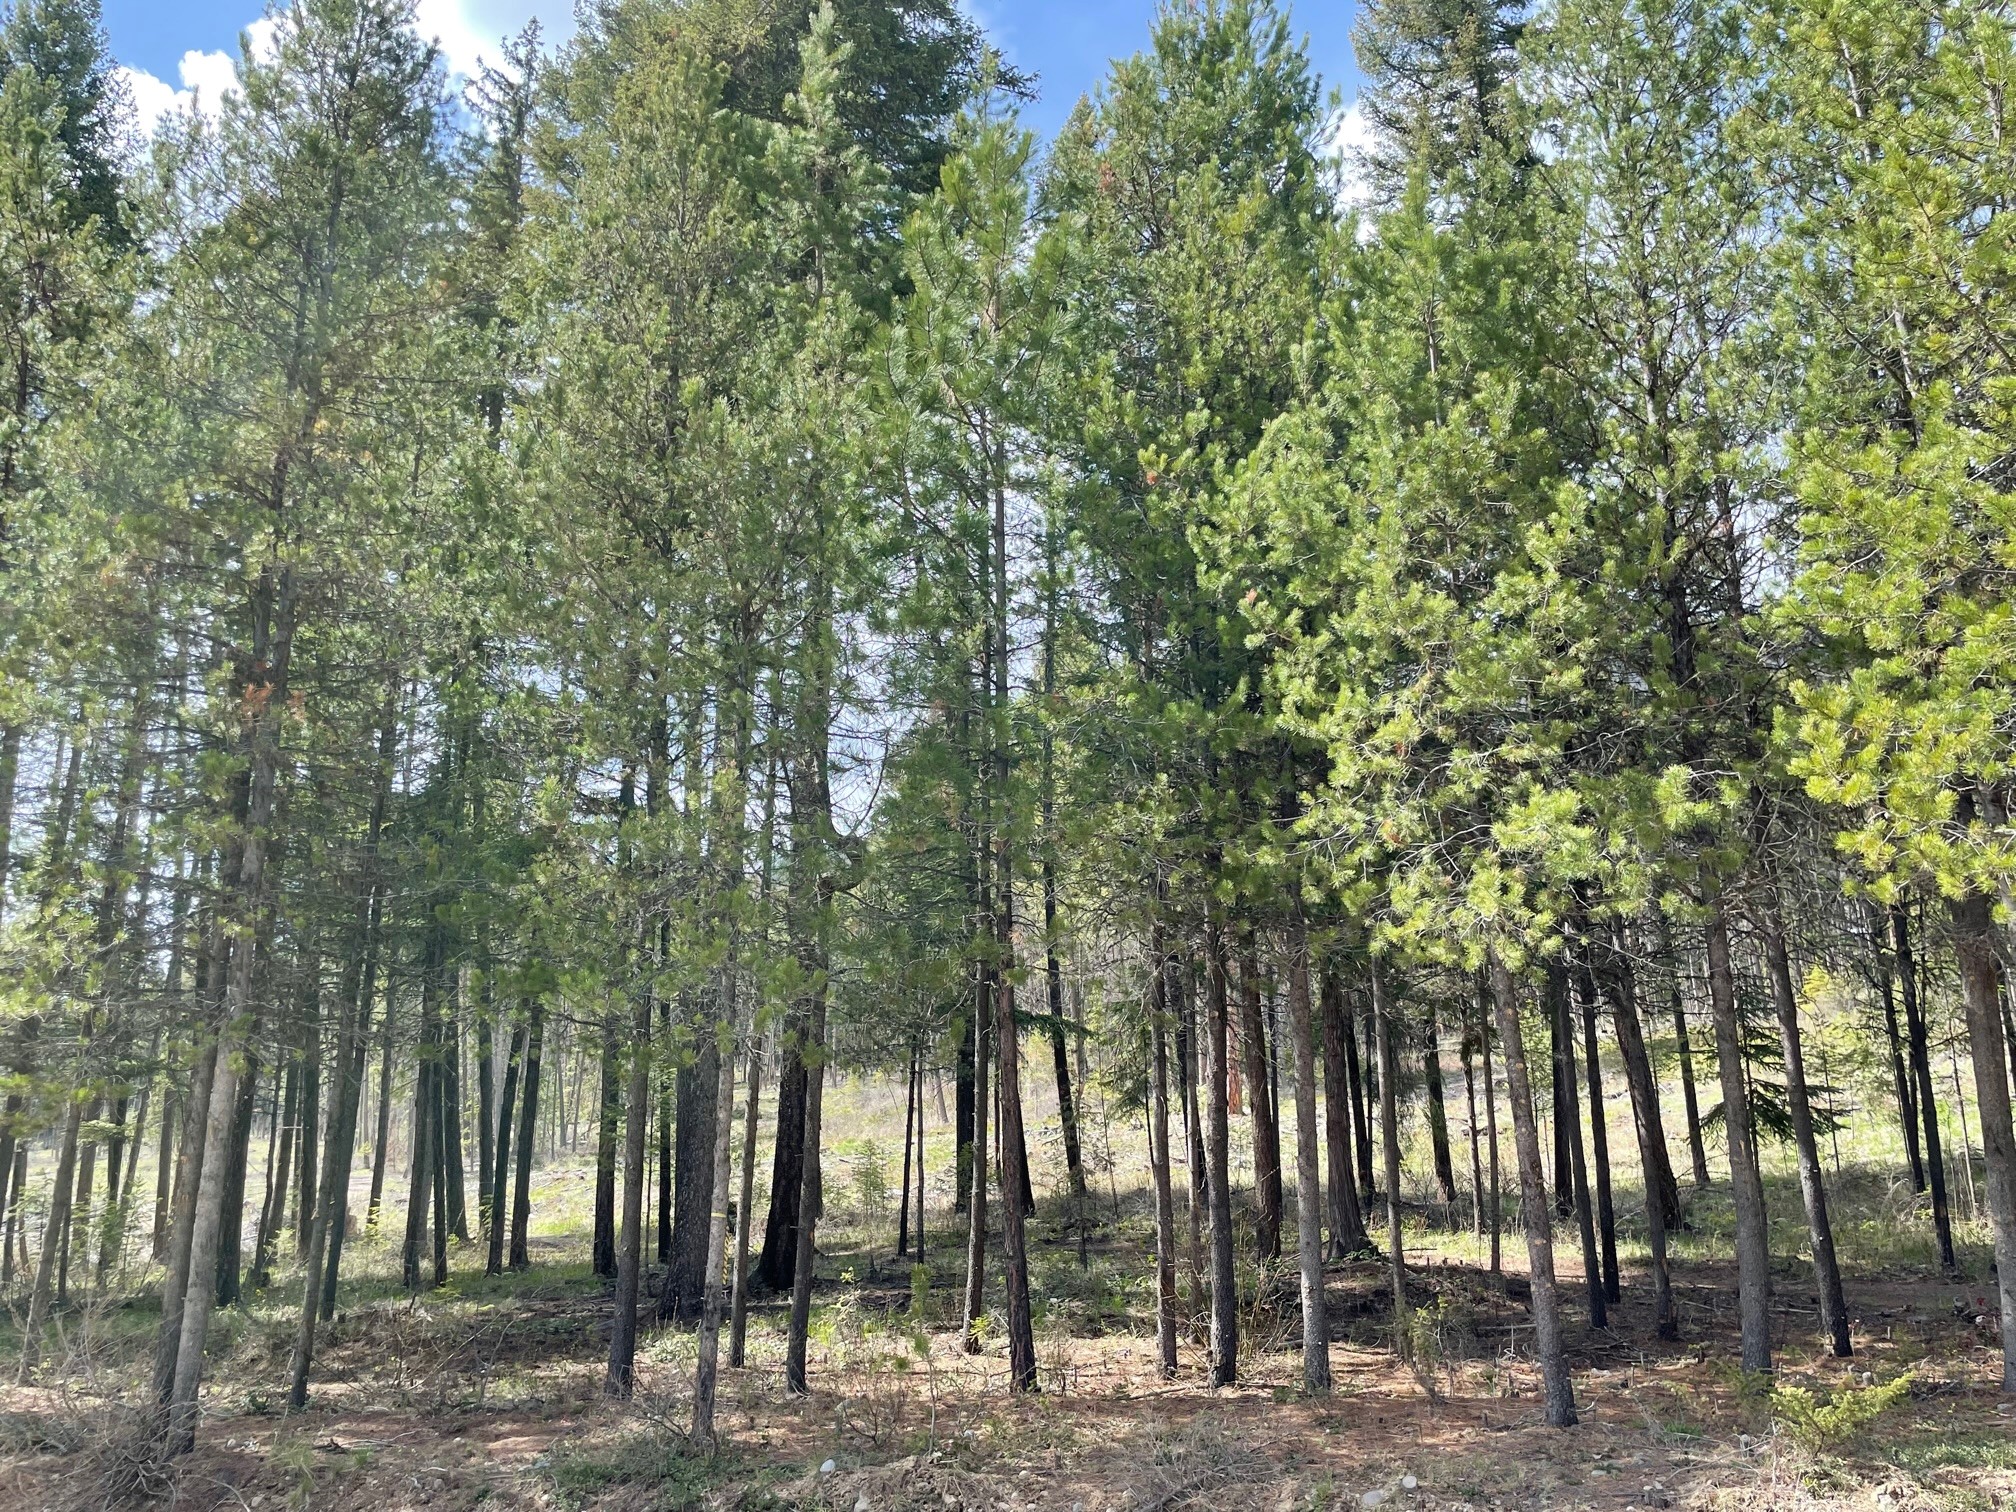
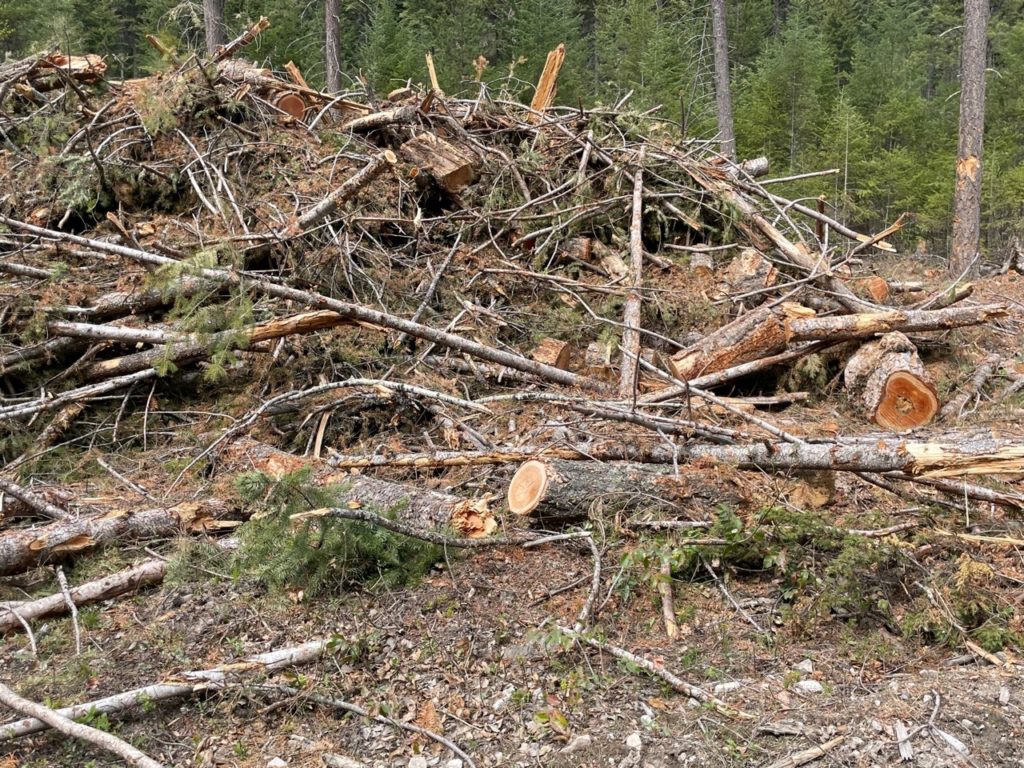
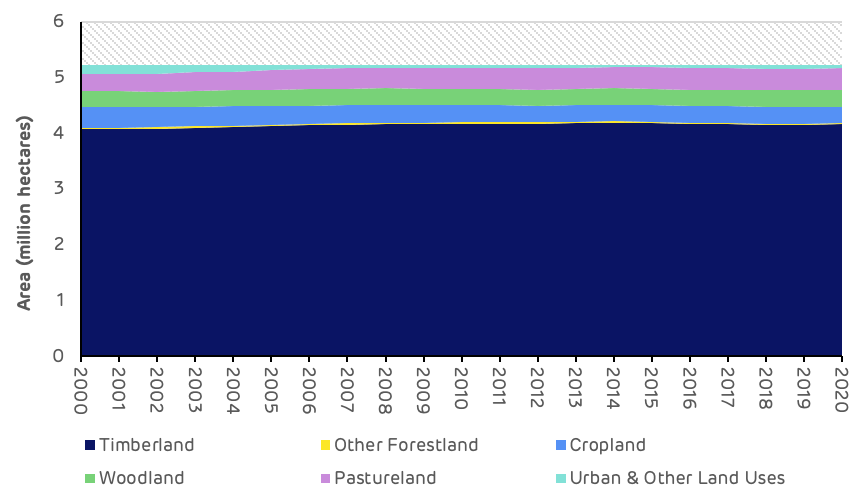
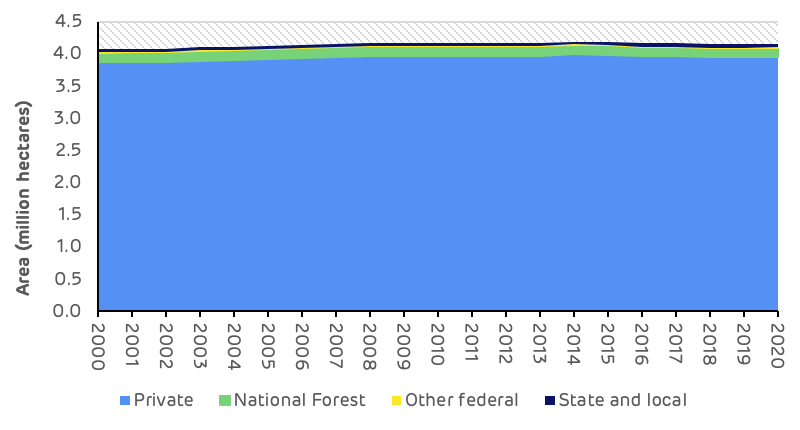
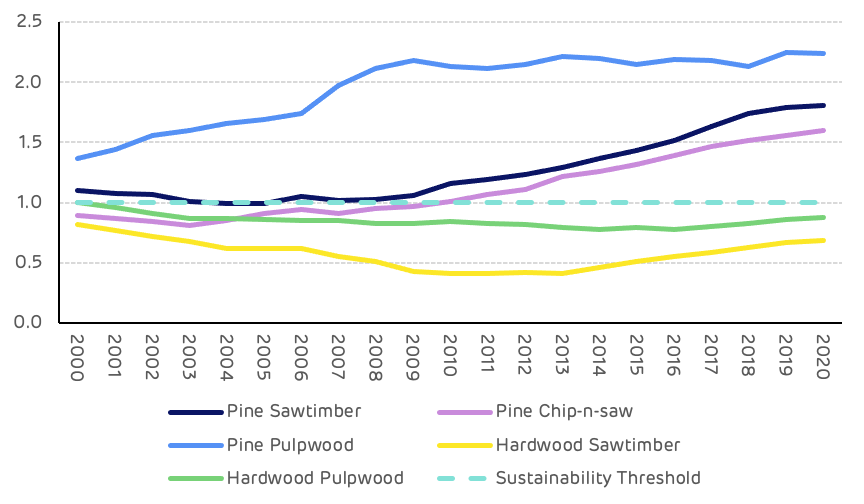
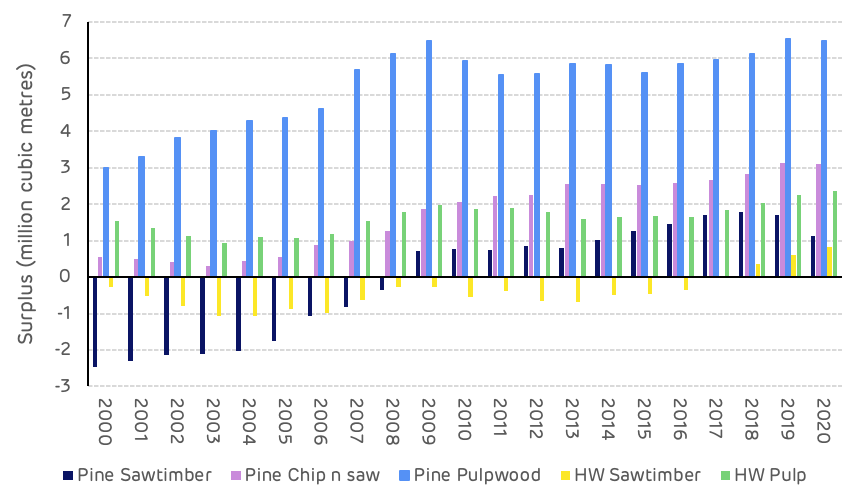
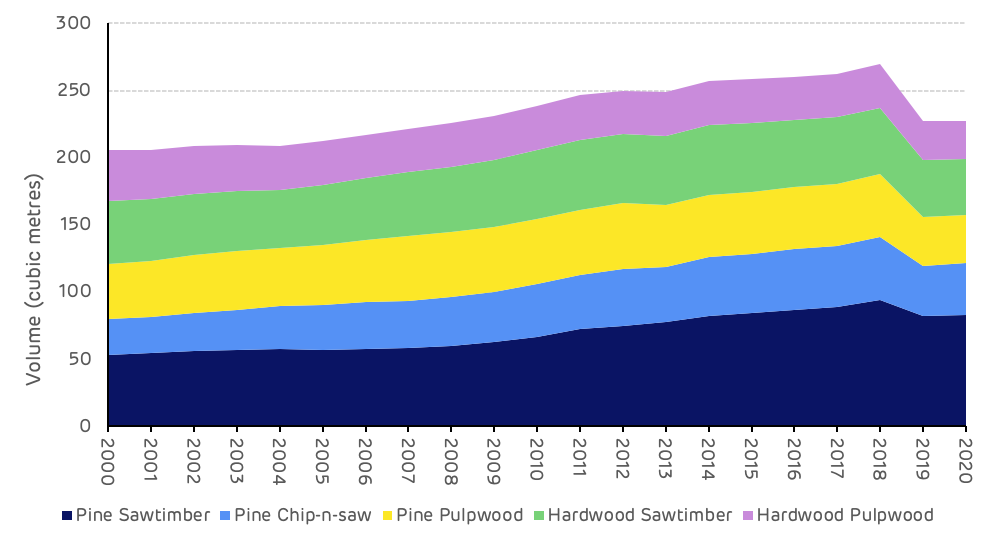
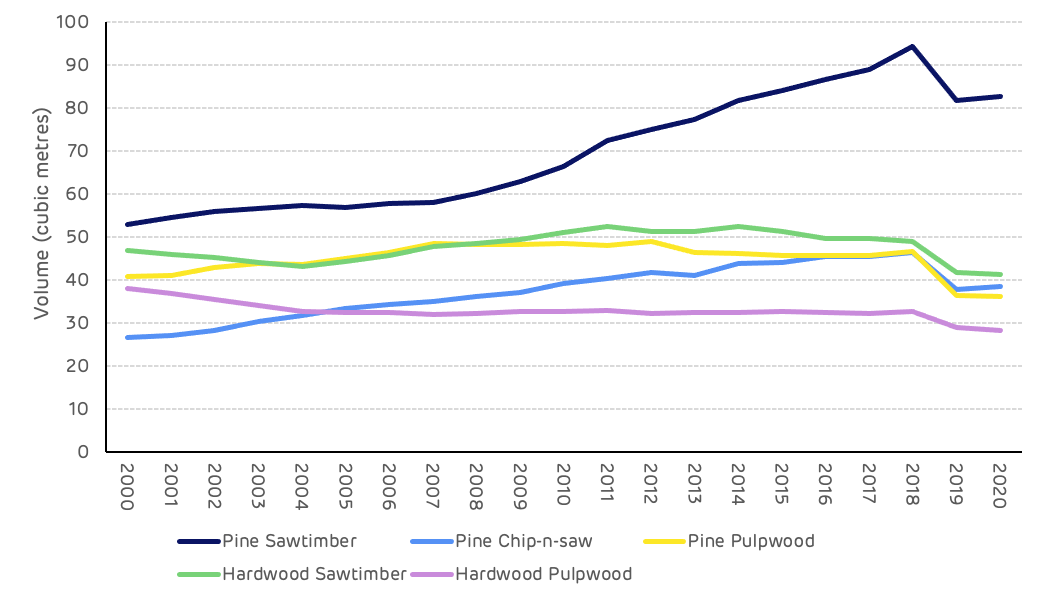
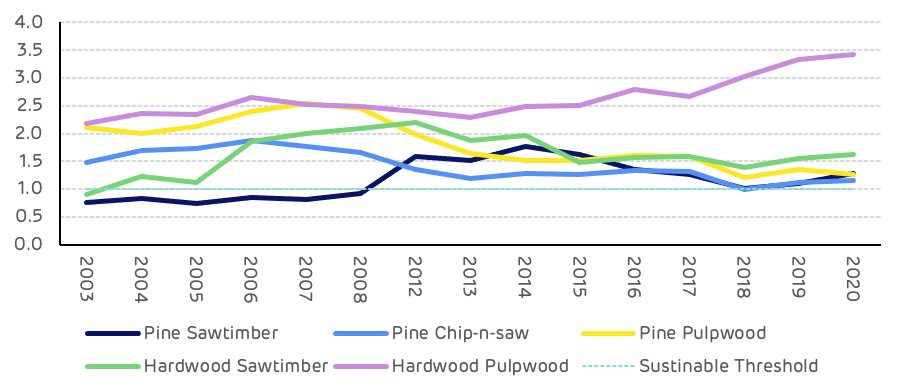
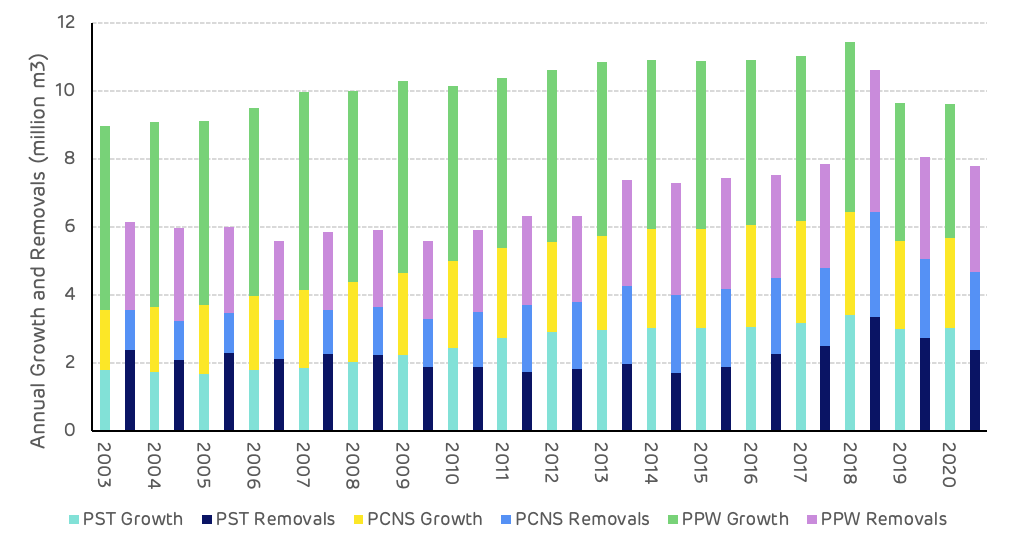
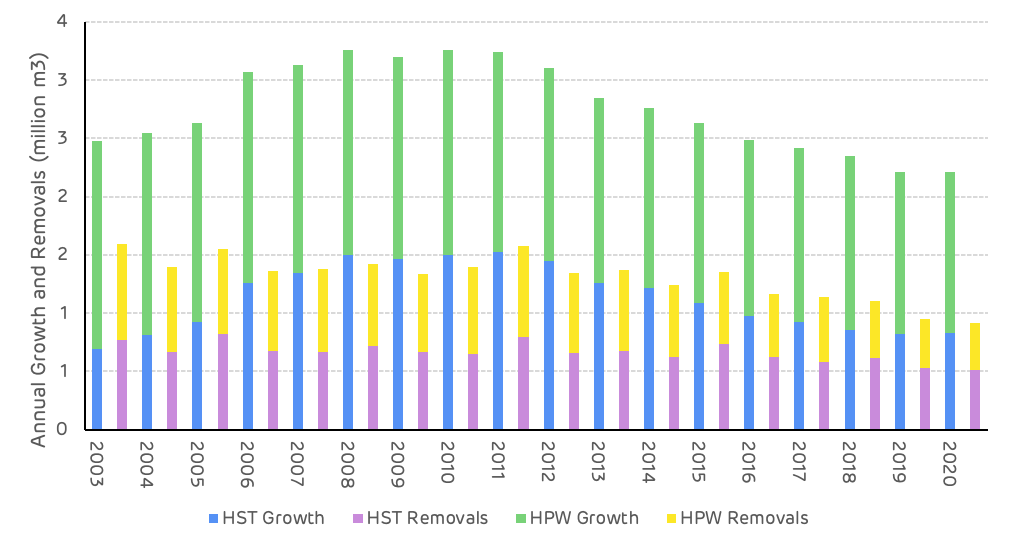
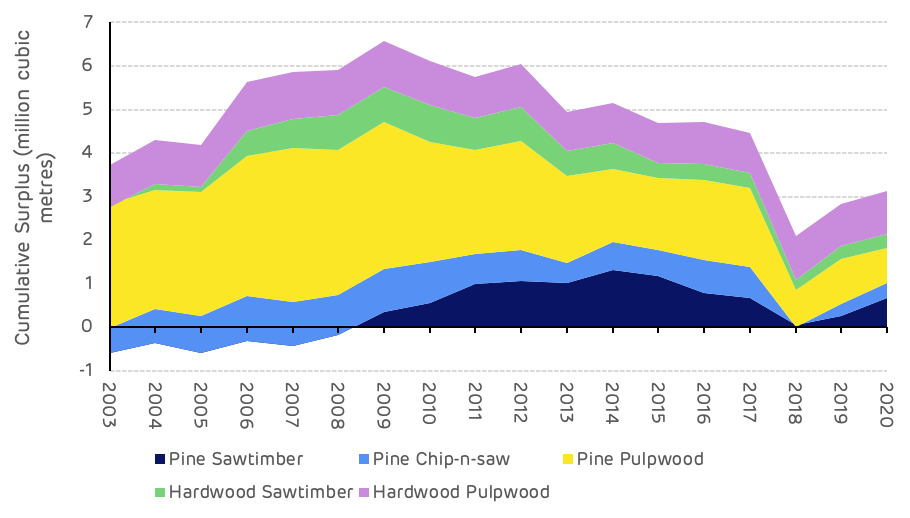
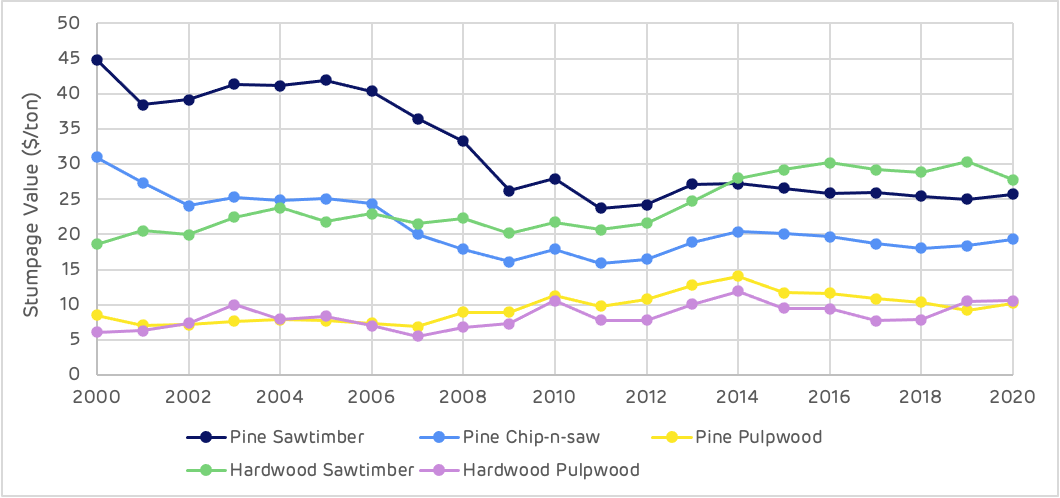
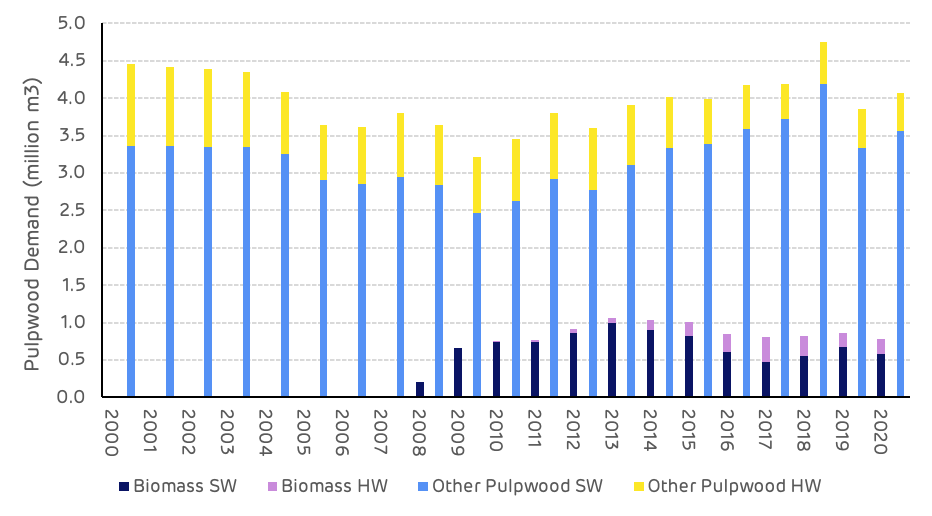
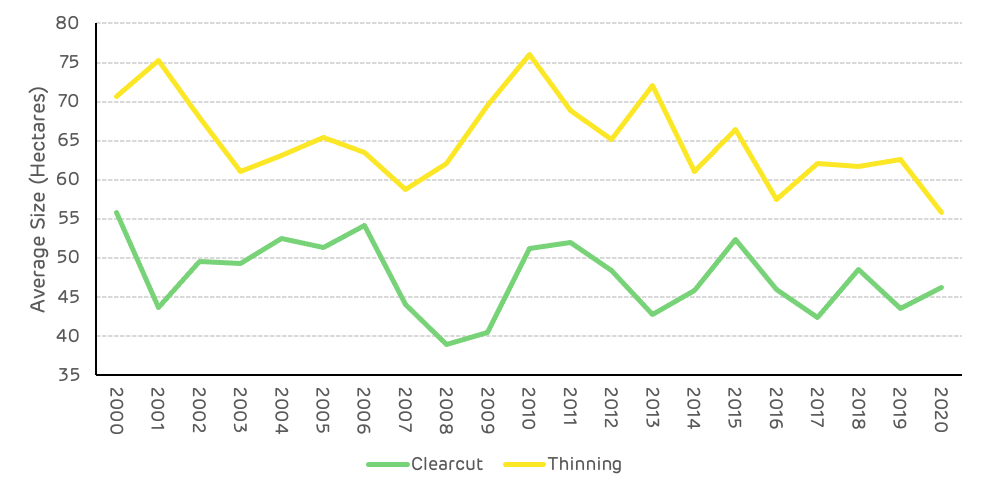
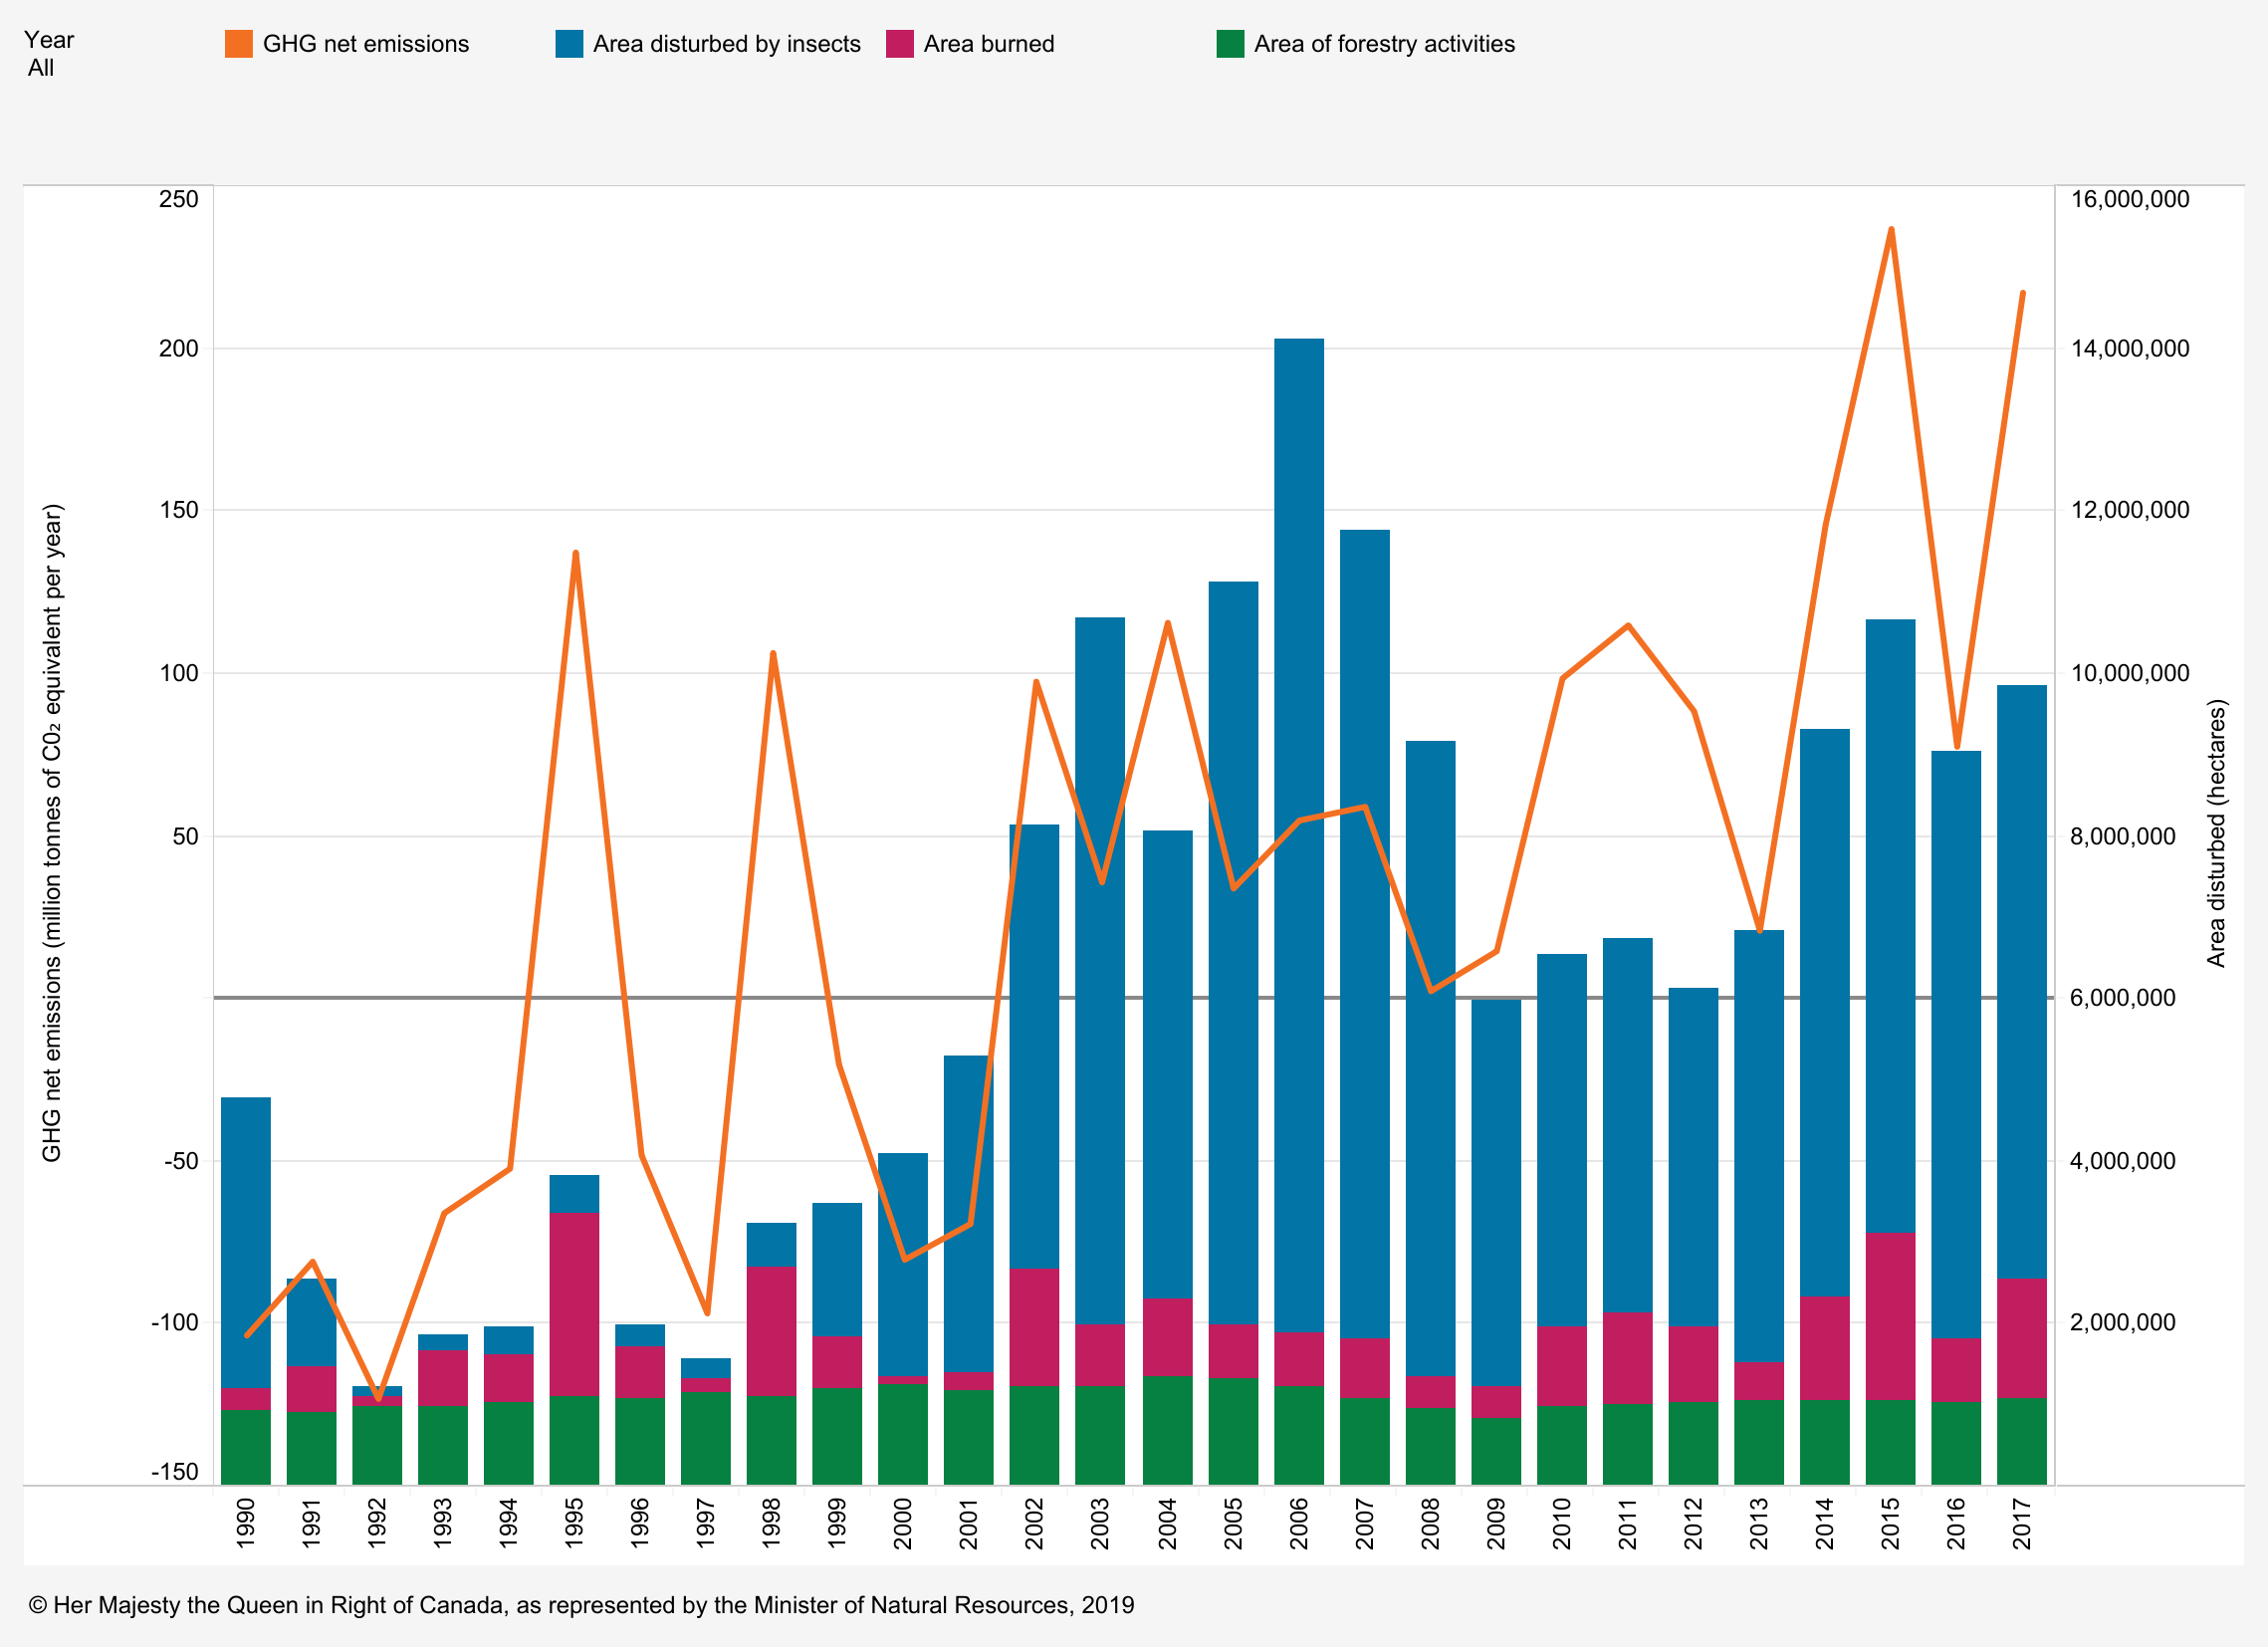
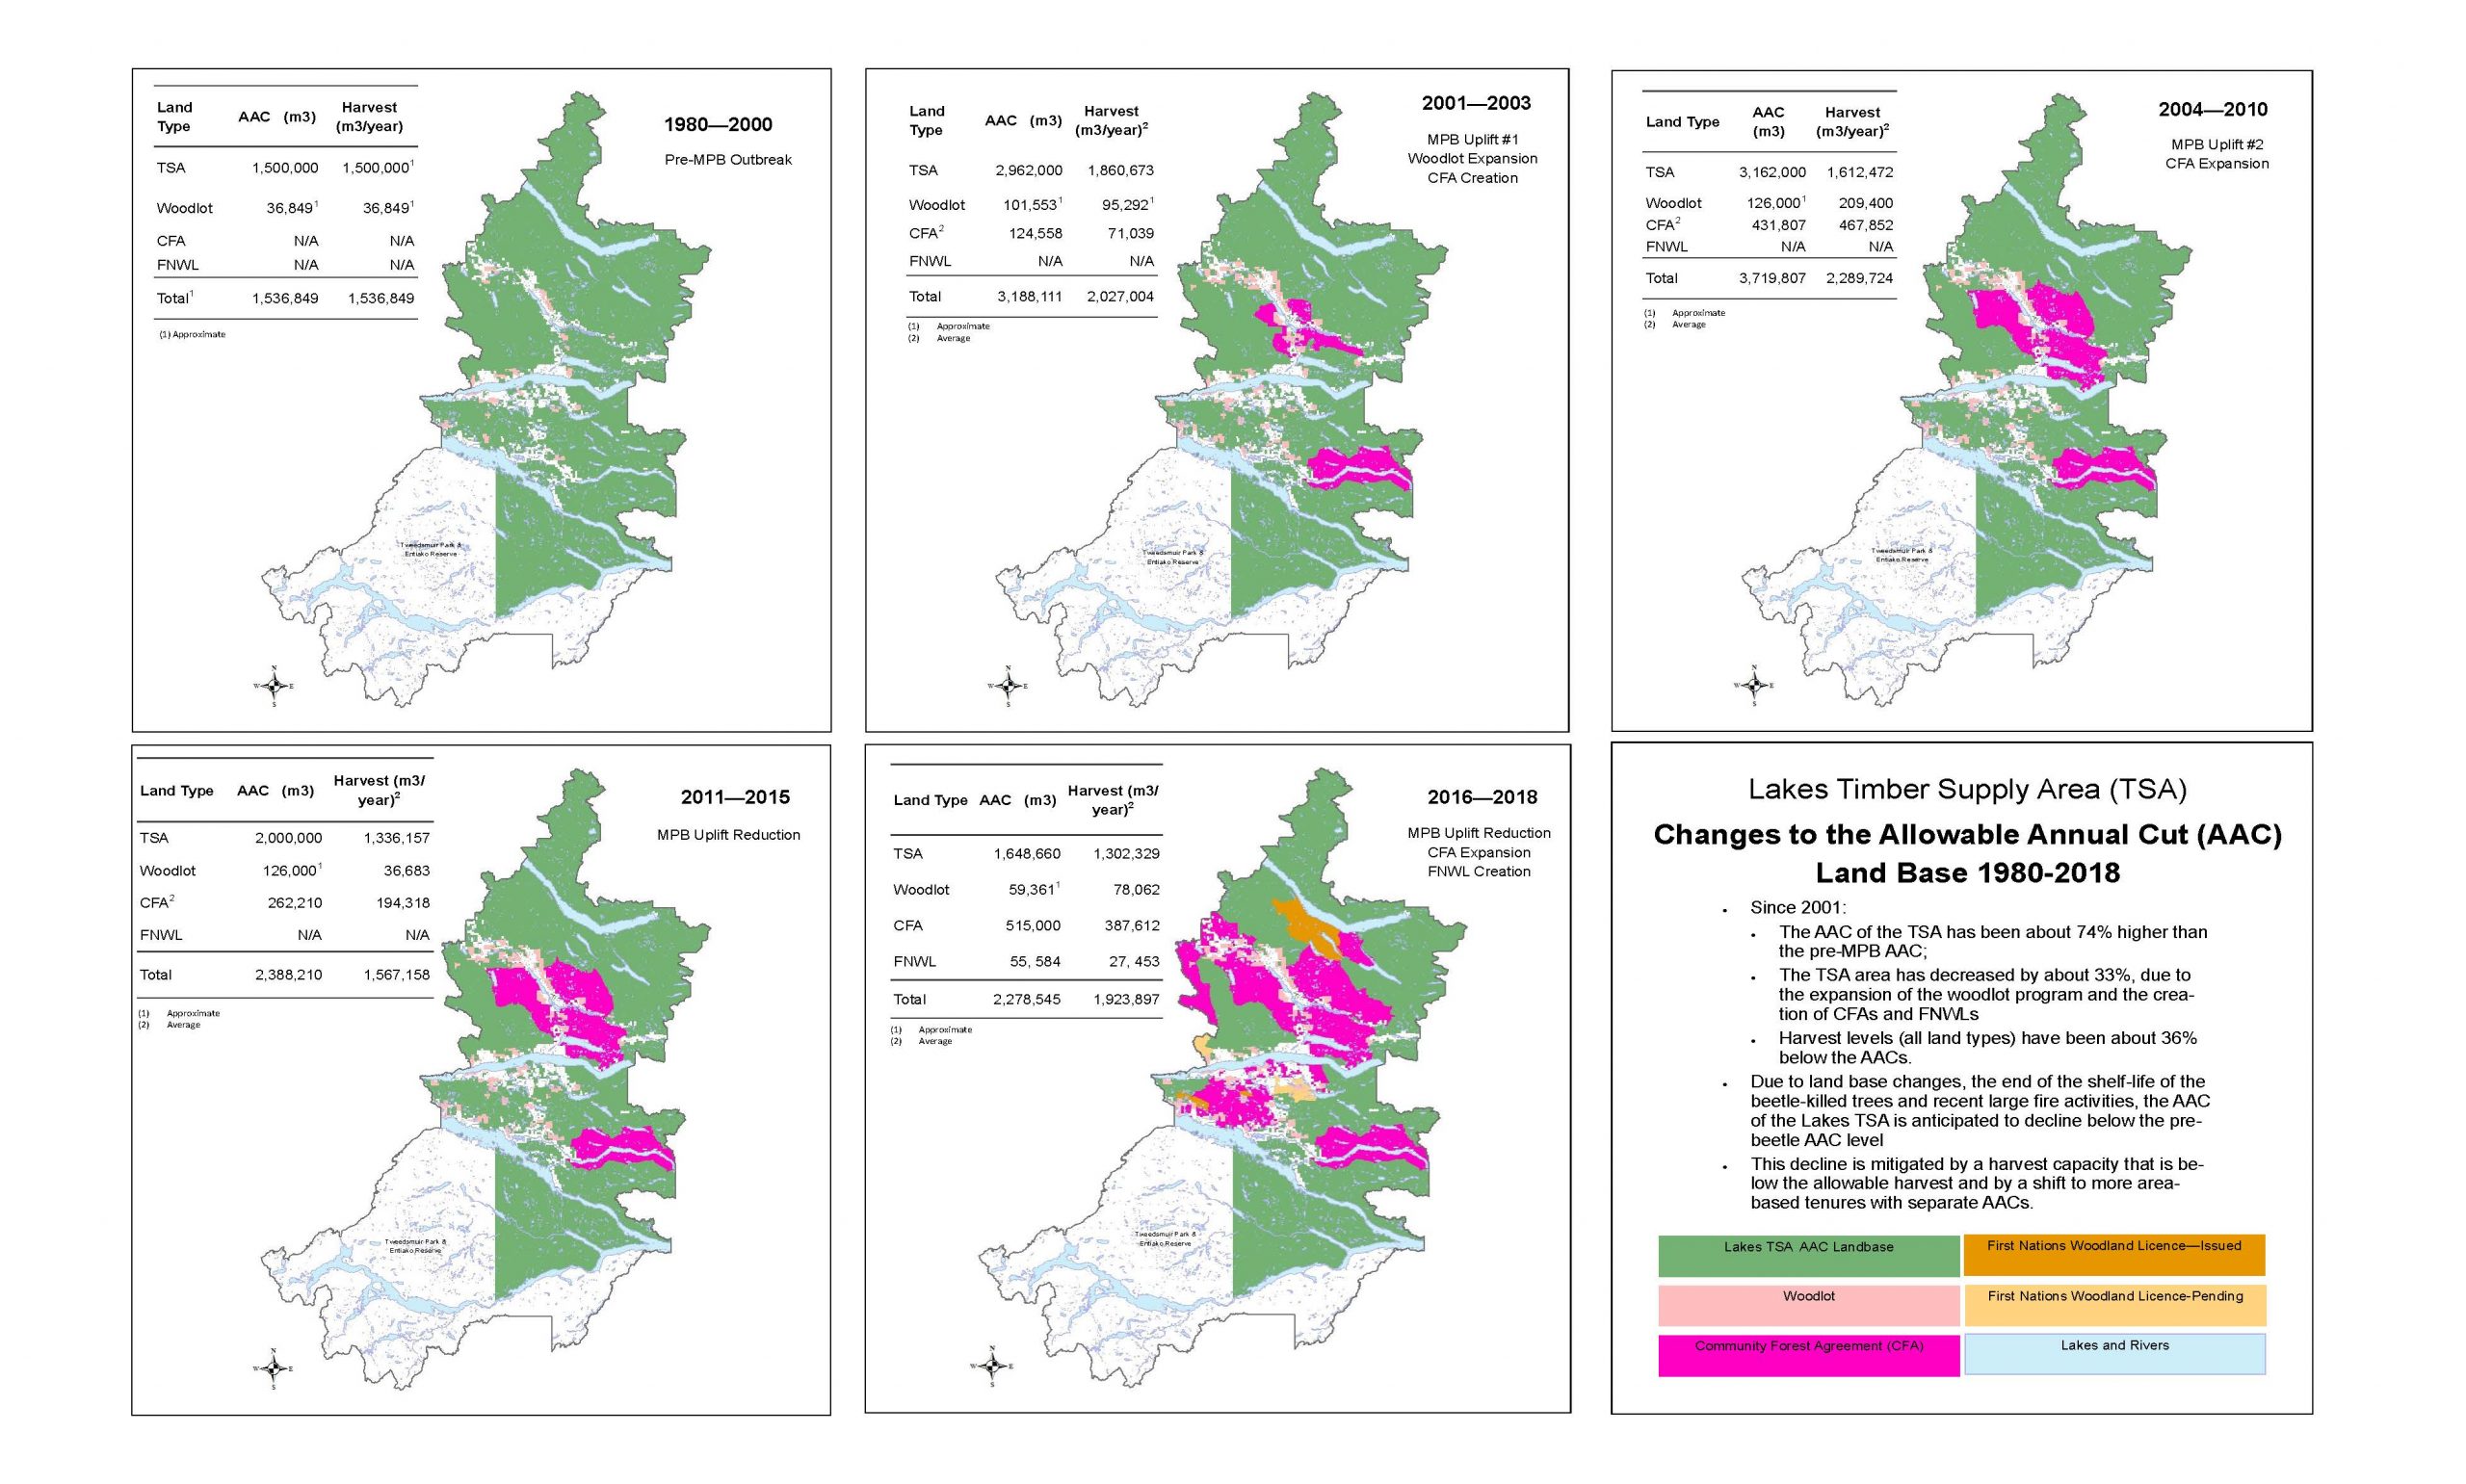
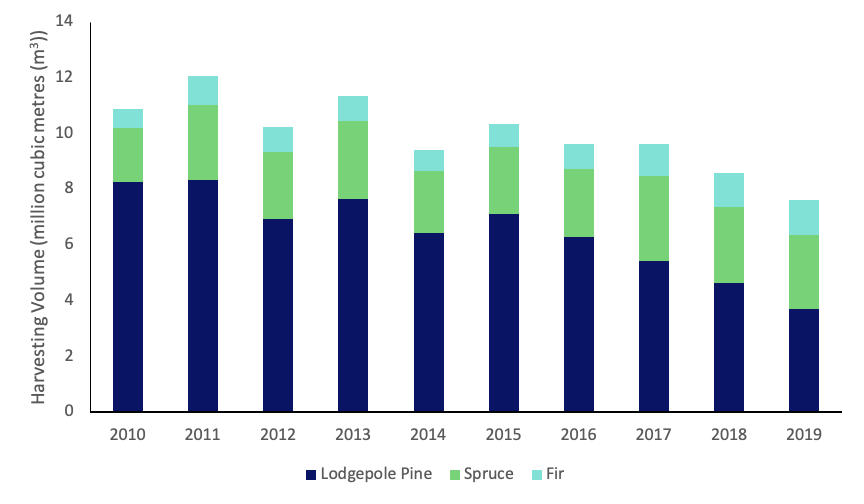
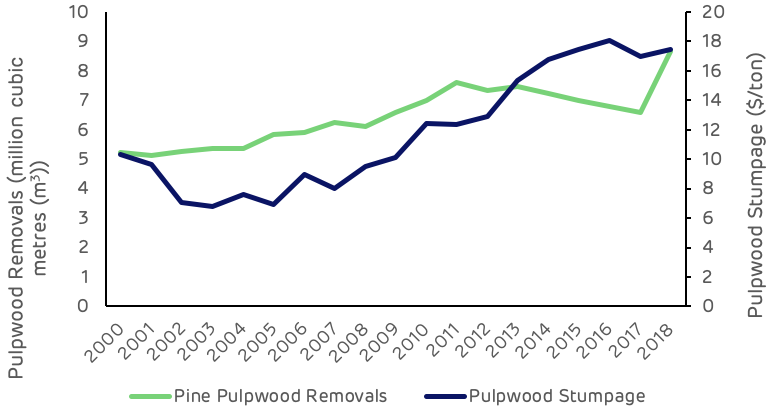
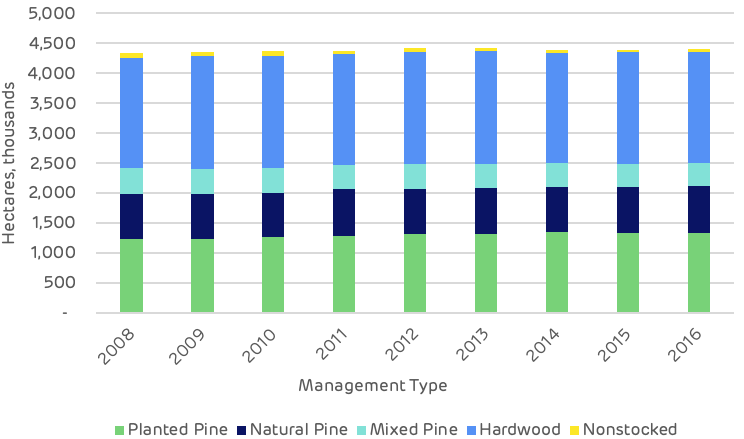
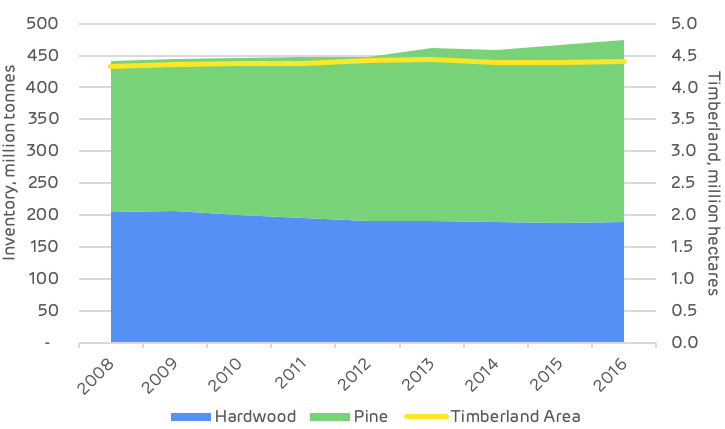
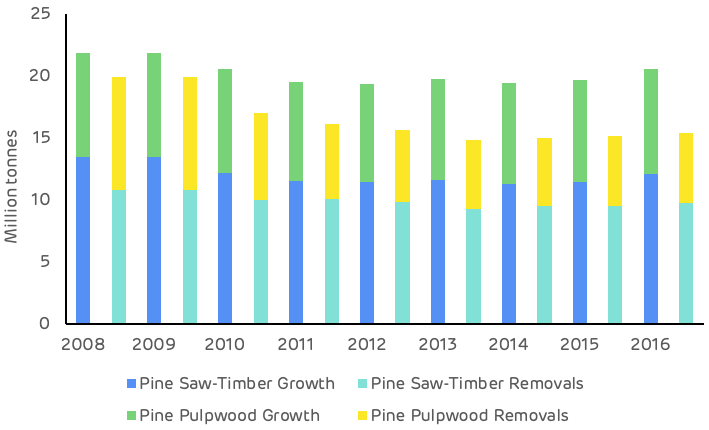
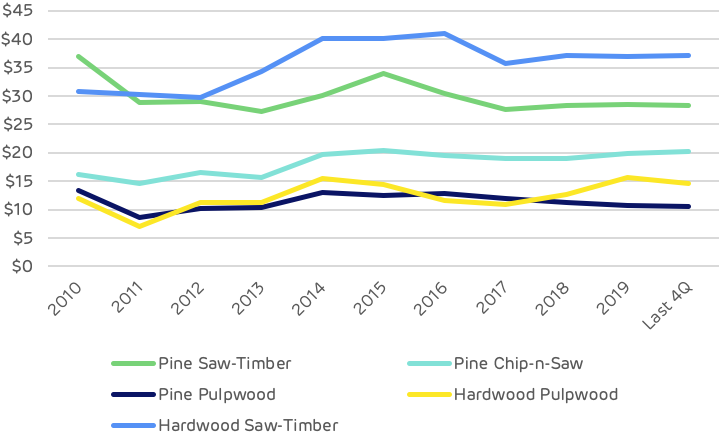
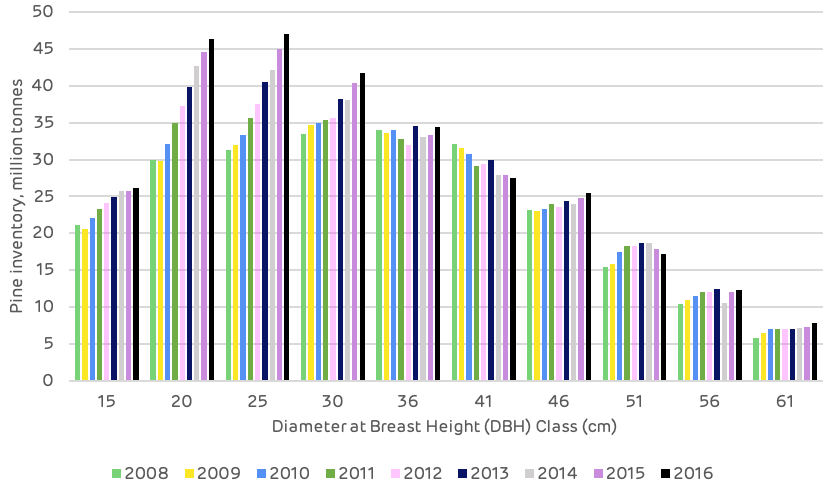
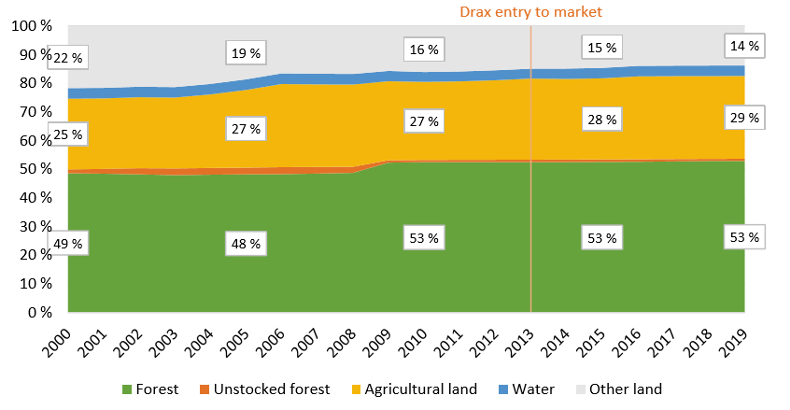
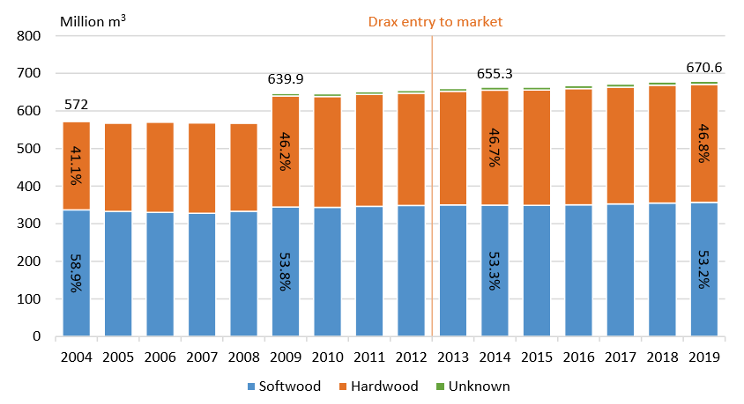
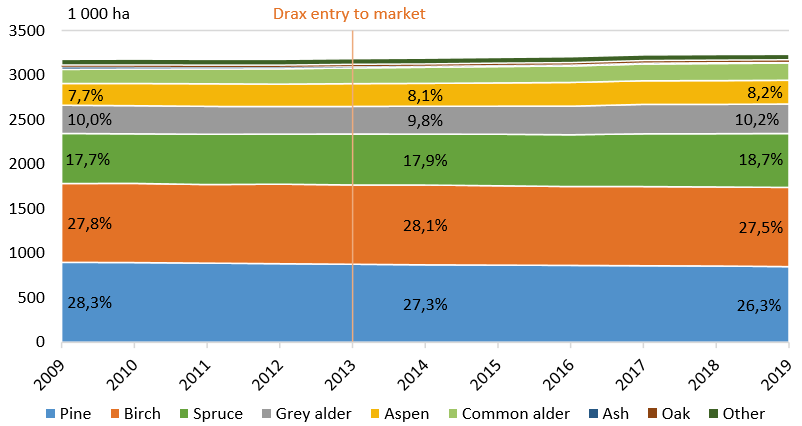
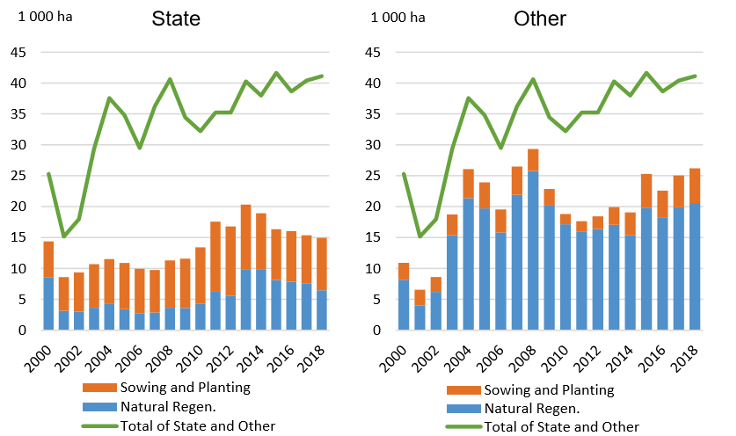
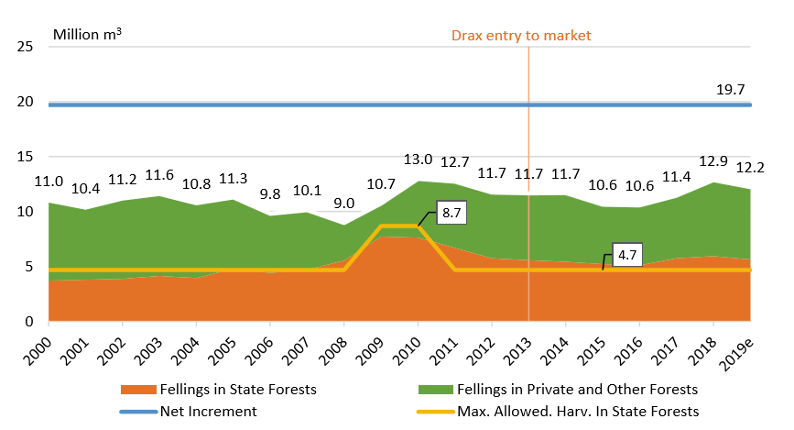
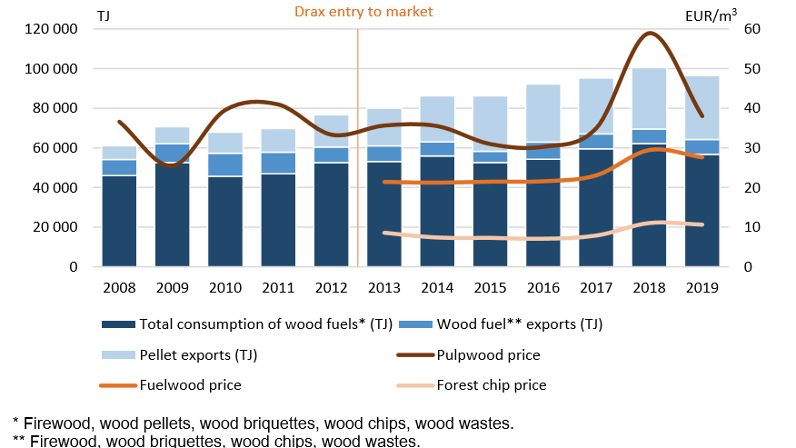
Pinnacle’s lower cost partially reflects the use of high levels of low-cost sawmill residues. British Columbia has a large and well-established commercial forestry industry, which has in recent years seen increased harvest levels, in part associated with management of a pine beetle infestation, producing good levels of residue material availability for the production of biomass. This infestation has now run its course and alongside other influences on the forest landscape, including wild-fire, is resulting in a reduction in the annual harvest and sawmill closures. The industry is adjusting to this with some production curtailment as well as developing approaches to fibre recovery and use which is expected to result in some increase in fibre costs.
Since 2017, the Sustainable Biomass Program has conducted annual audits of each of Pinnacle’s operational sites, allowing Drax to ensure, through its diligence, that the material that it purchases from Pinnacle is in line with its sustainability standards.
Drax is committed to ensuring best practice in health and safety, operational efficiency and sustainability across the enlarged group and intends to invest accordingly to deliver this outcome.
Drax is committed to ensuring that its biomass sources are compliant with Drax’s well-established responsible sourcing policy and Drax expects to invest in, adapt and develop sourcing practices to ensure compliance with Drax’s policies to deliver both Drax’s biomass strategy and positive forest outcomes.
A large and geographically diversified asset base
Pinnacle has ownership interests in ten operational plants and one in development (commissioning 2021), six of which are operated through joint venture arrangements, providing access to nameplate production capacity of 2.9 million tonnes per annum.
Seven of Pinnacle’s sites are in British Columbia (1.6 million tonne nameplate capacity) and two are in Alberta (0.6 million tonne nameplate capacity). All of these sites have rail lines to ports at either Prince Rupert or Vancouver, both accessing the Pacific Ocean, providing routes to Asian and European markets.
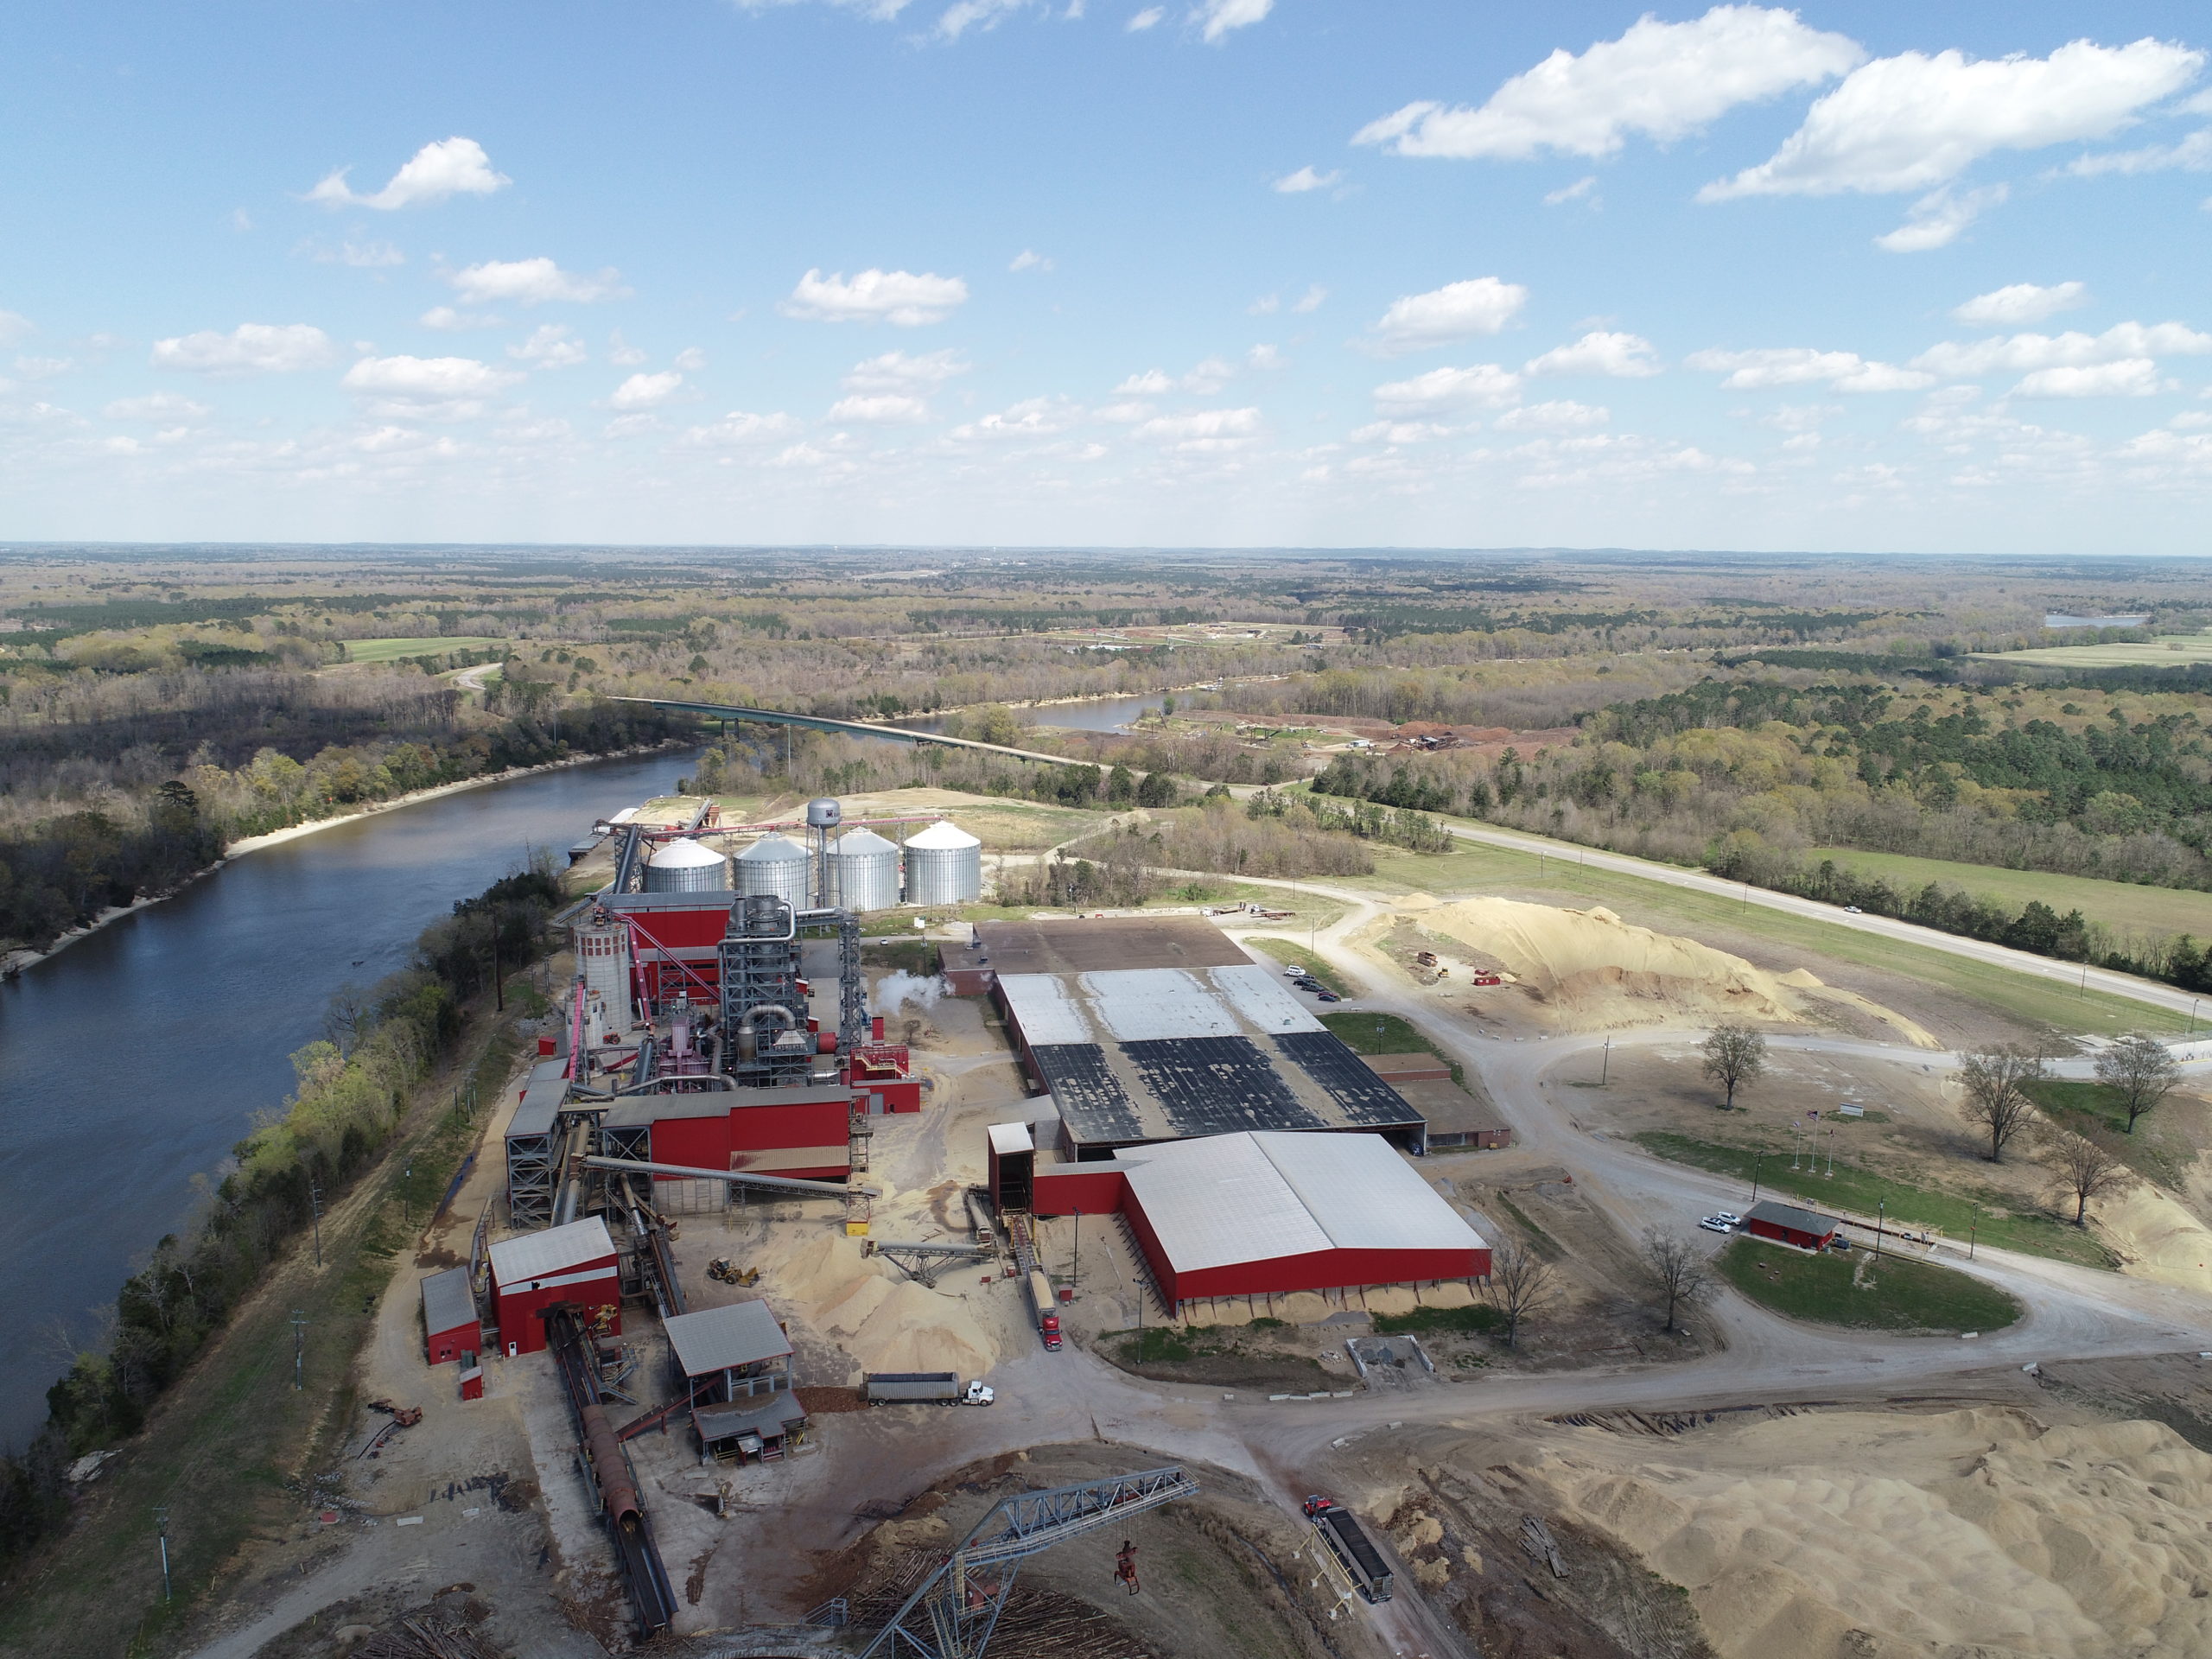
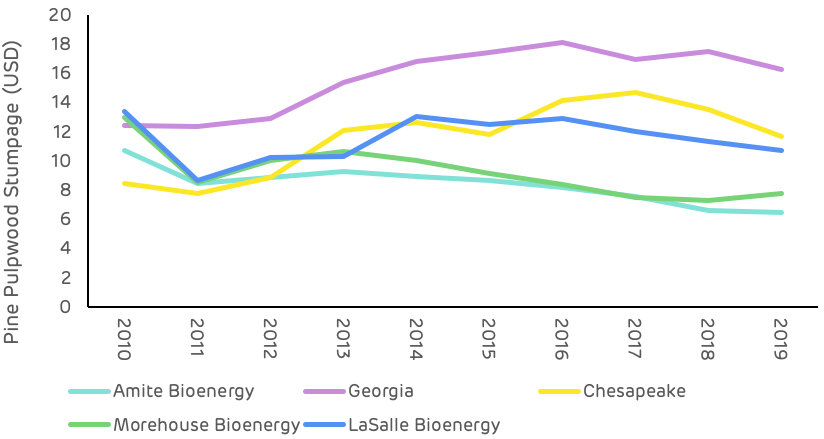
Pinnacle also operates a US hub at Aliceville, Alabama (0.3 million tonne nameplate capacity) and is developing a second site in Demopolis, Alabama (0.4 million tonne nameplate capacity), which Pinnacle expects to commission in 2021. Pinnacle’s total operational and development nameplate capacity in the US is 0.7 million tonnes.
Pinnacle’s US sites are close to Drax’s existing operations in the Southeastern US and will utilise river barges to access the Port of Mobile and barge-to-ship loading, reducing fixed port storage costs.

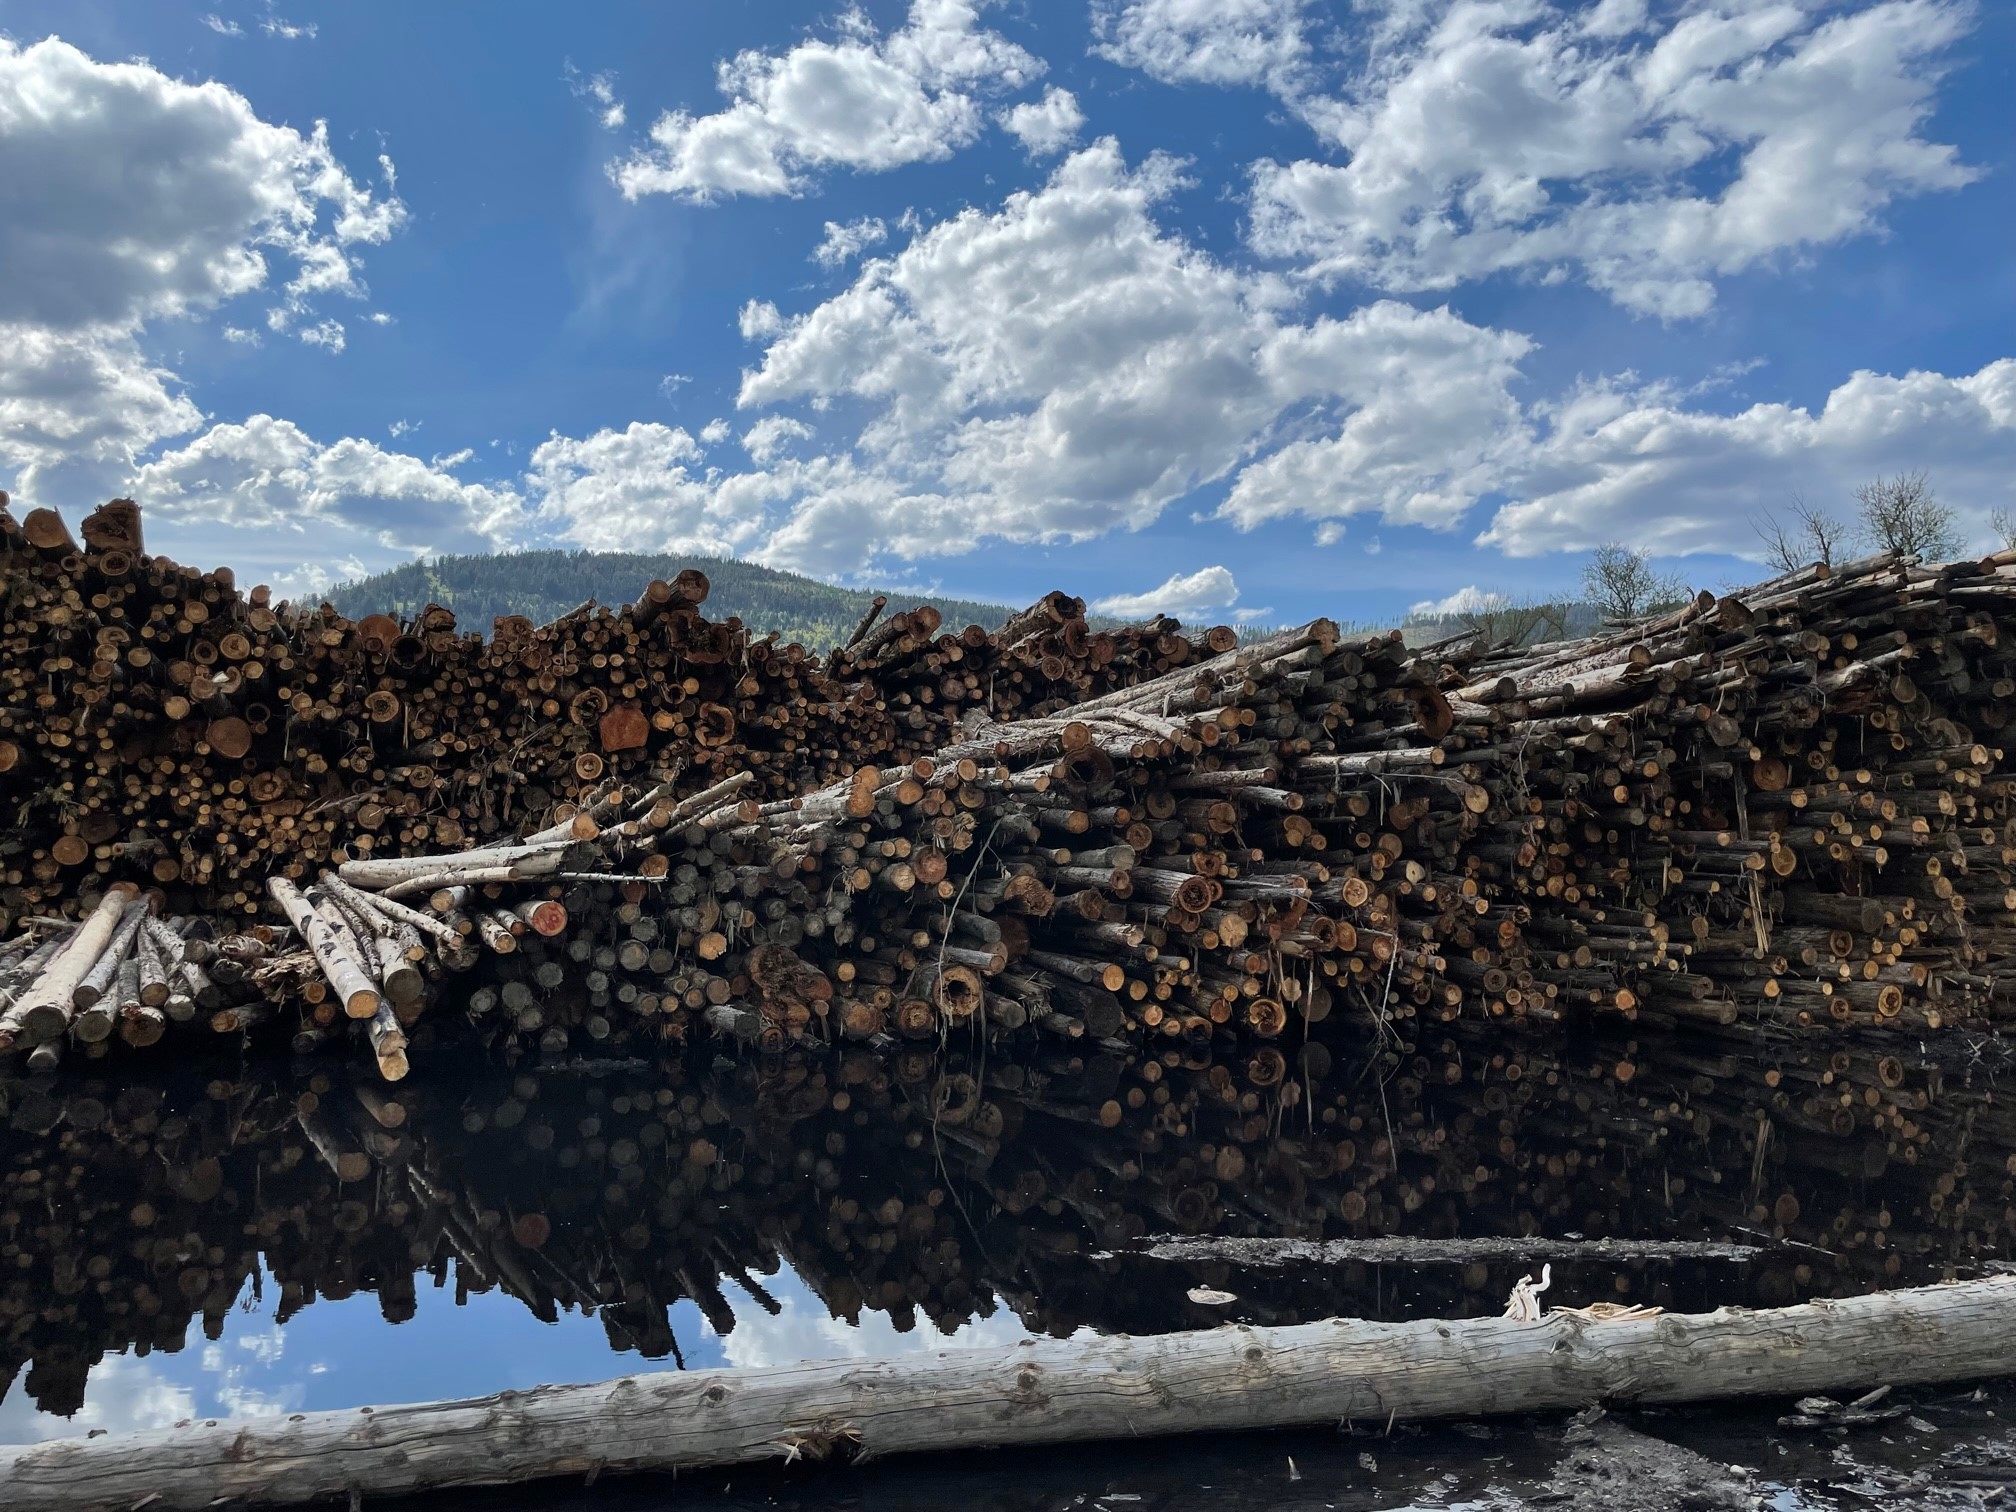
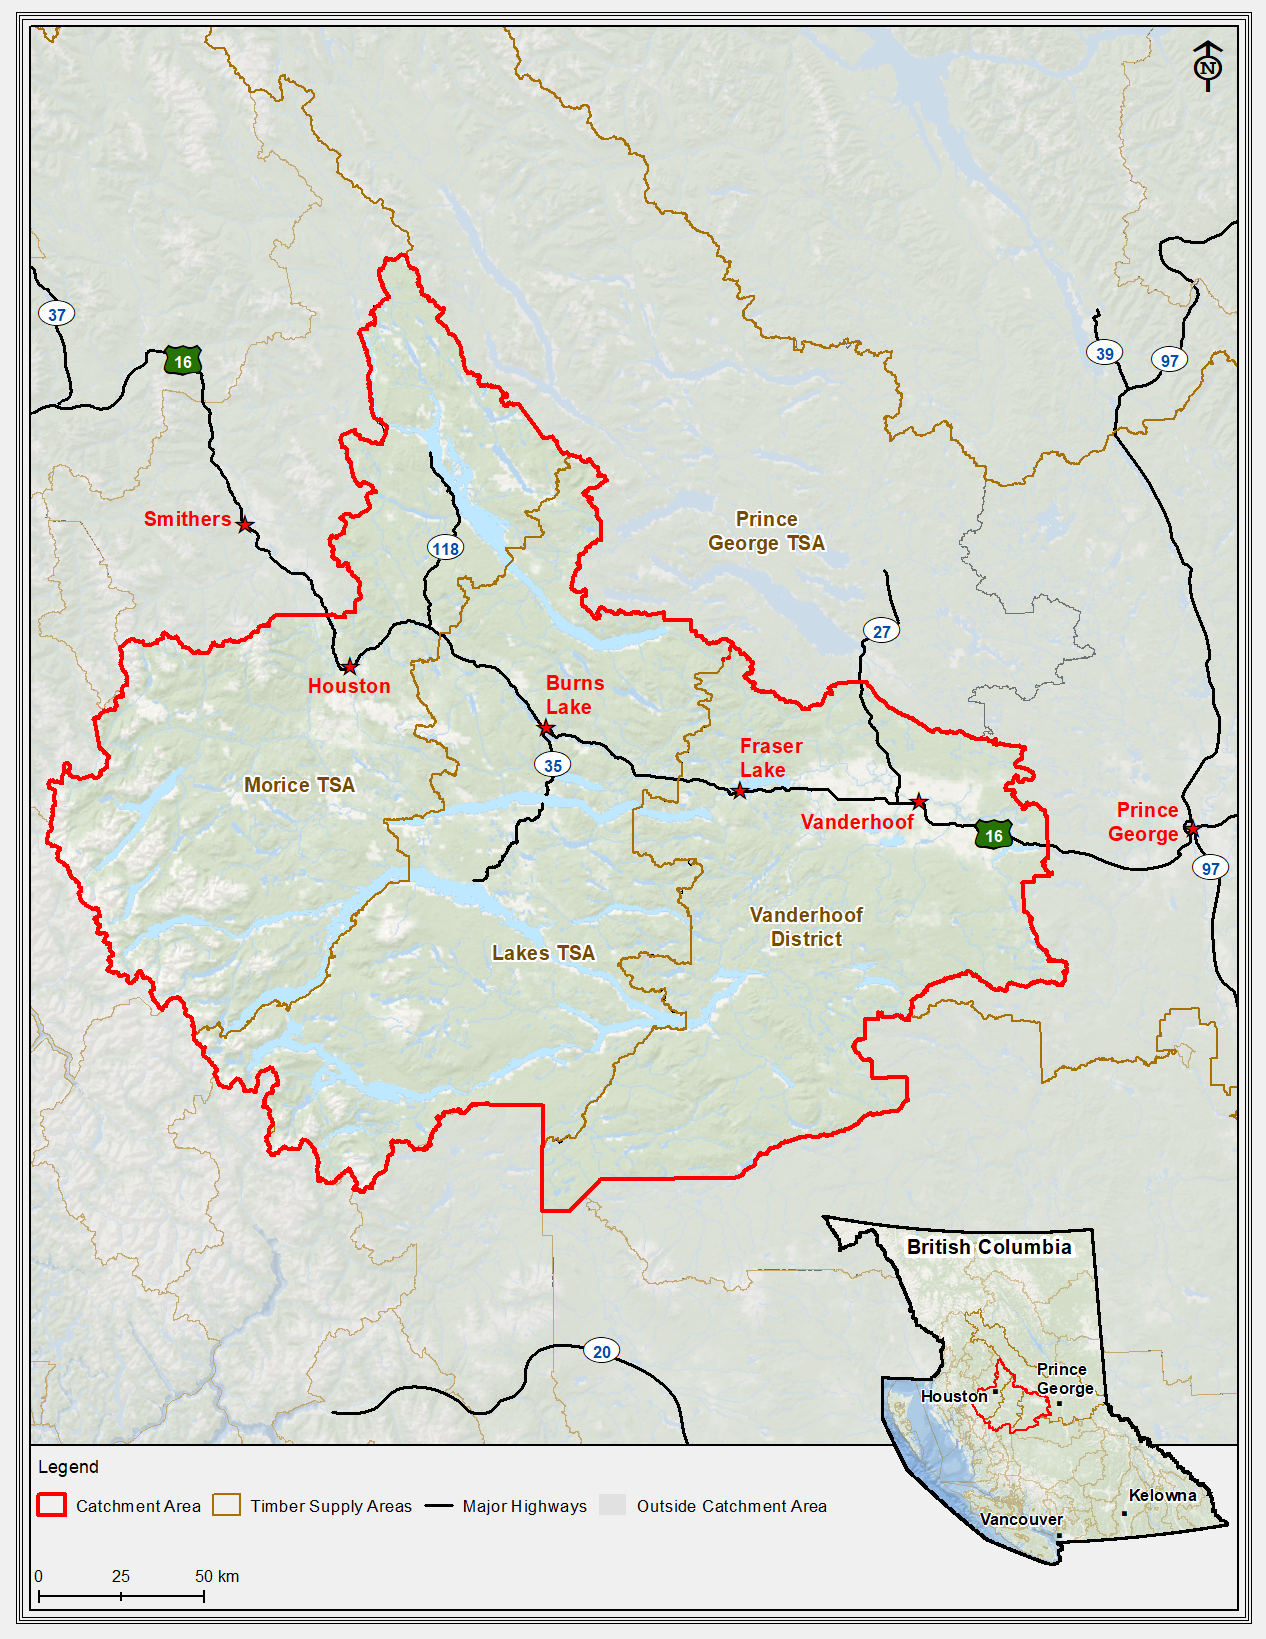
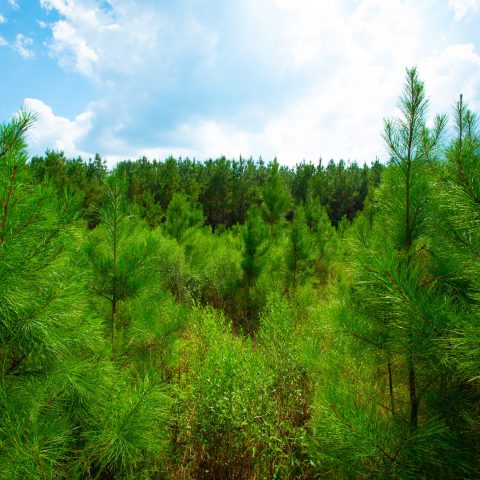
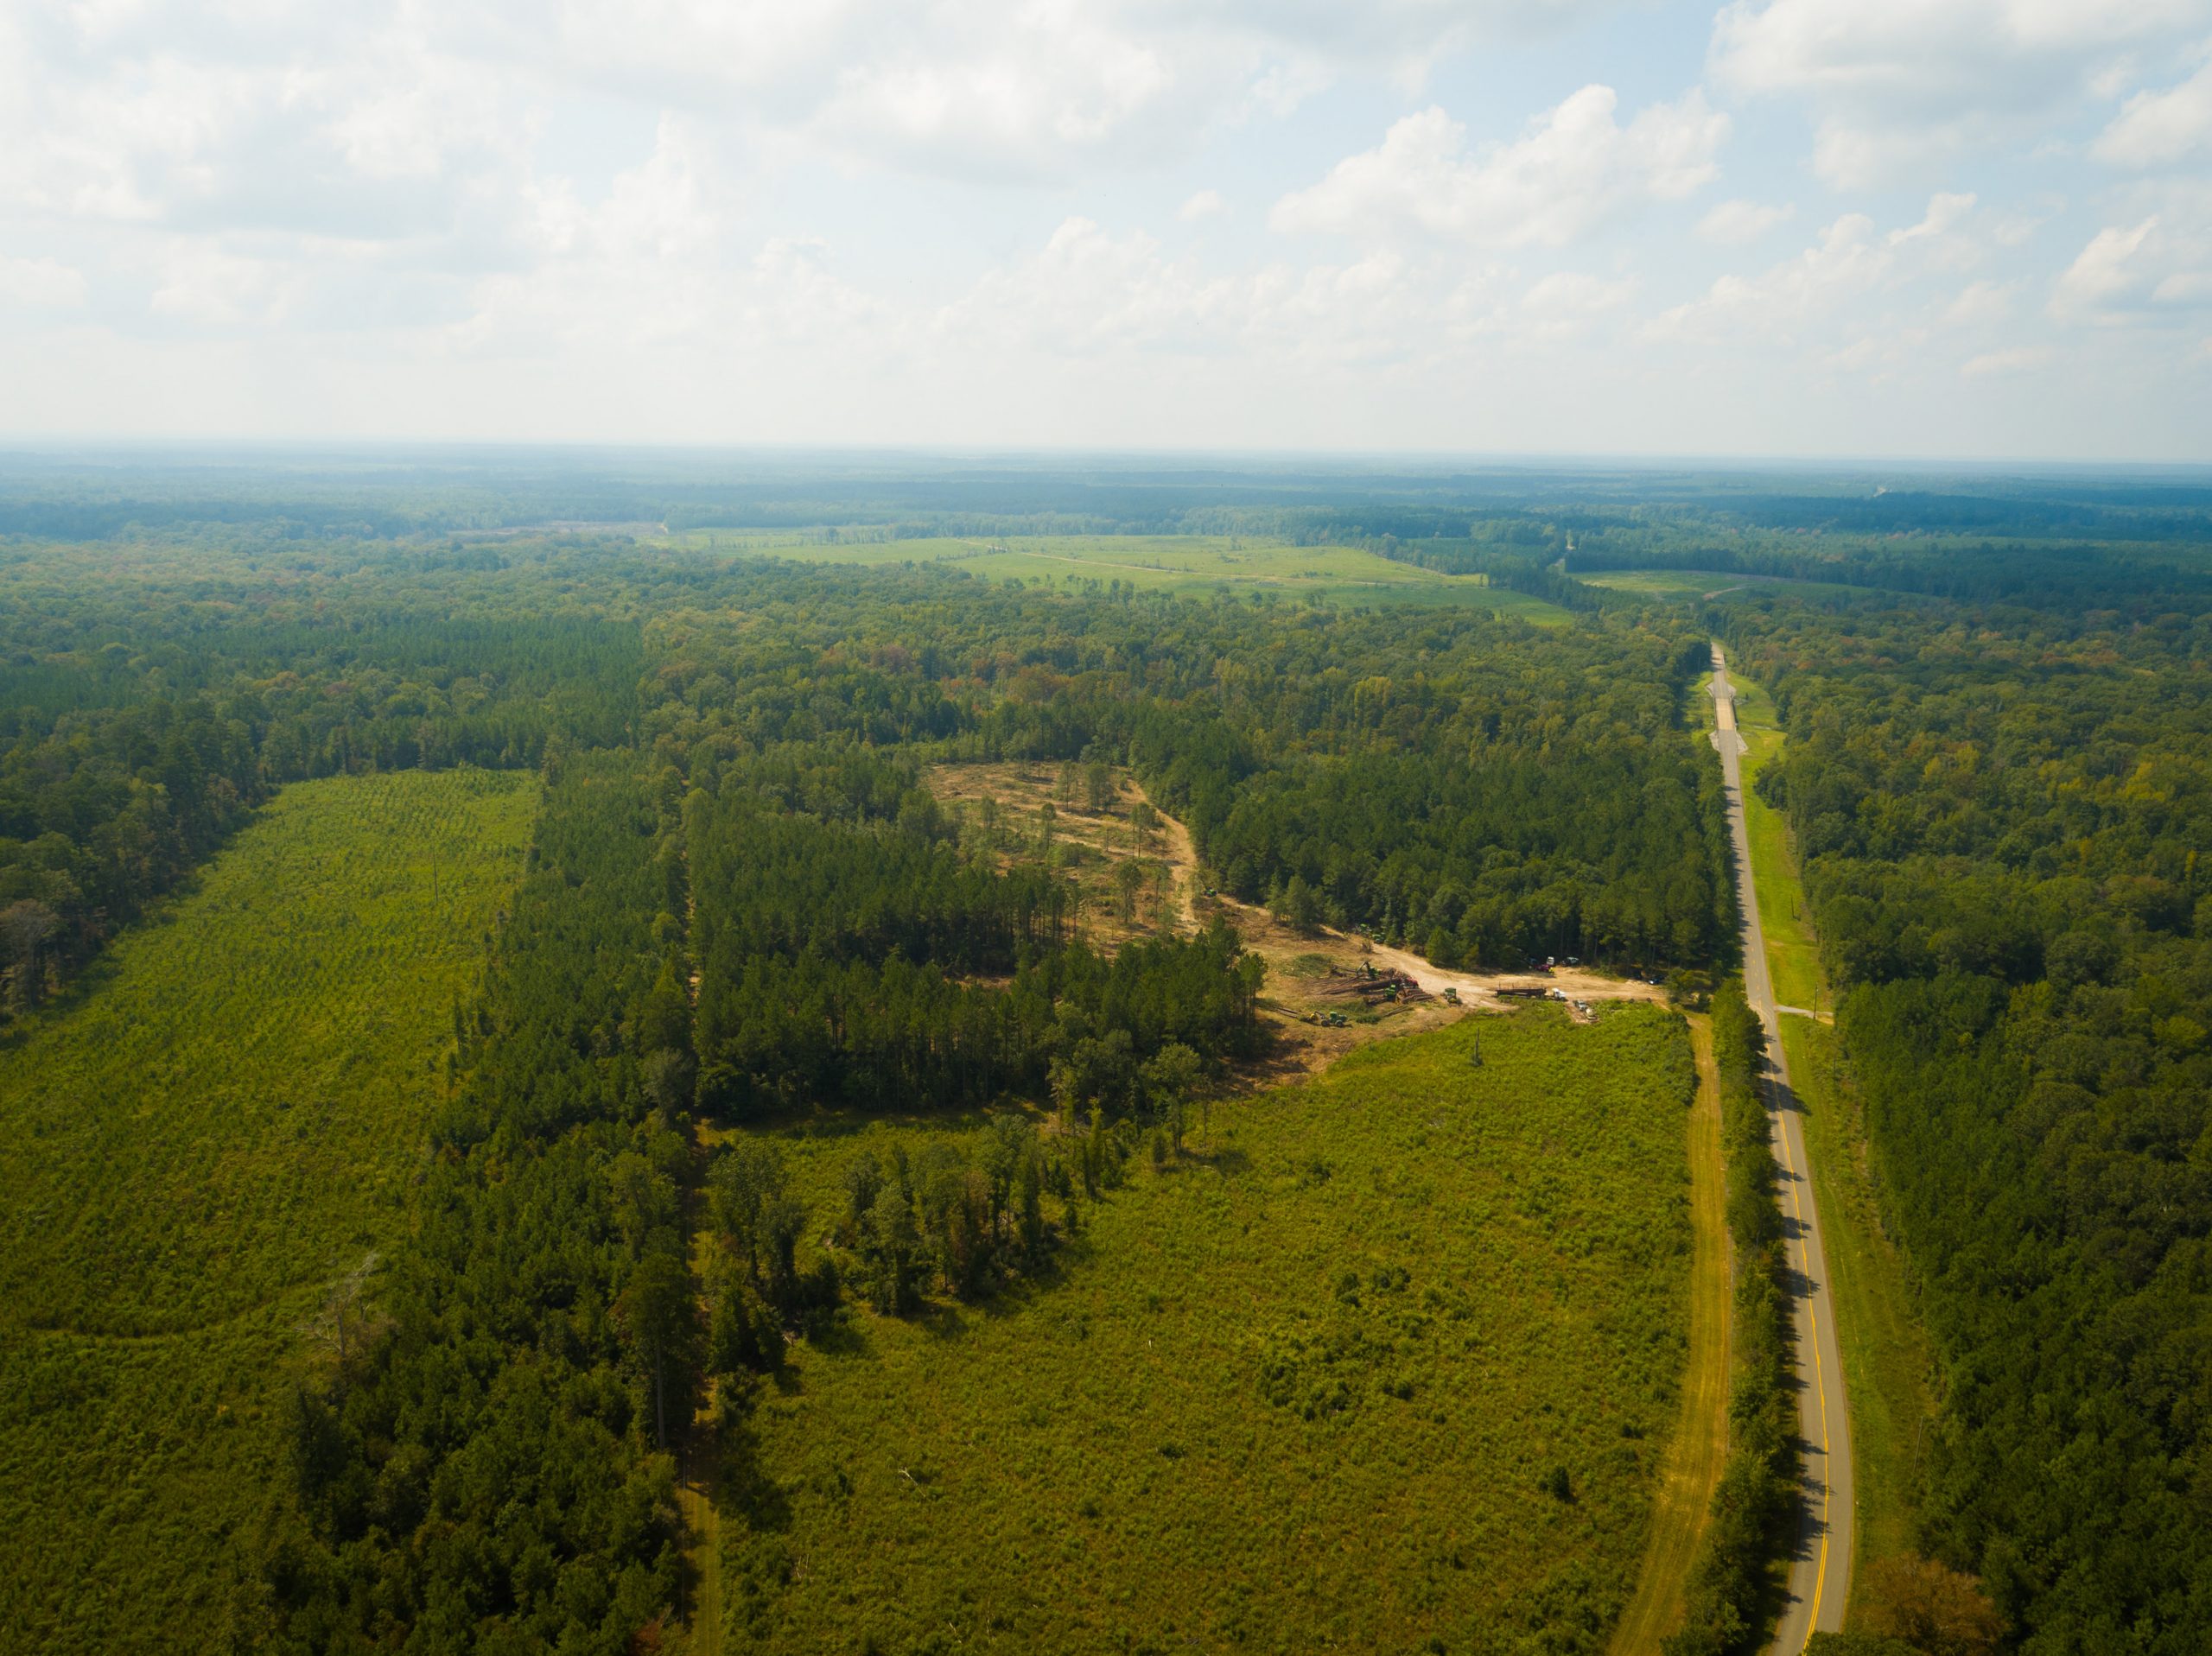
Working forest in LaSalle BioEnergy catchment area, Louisiana
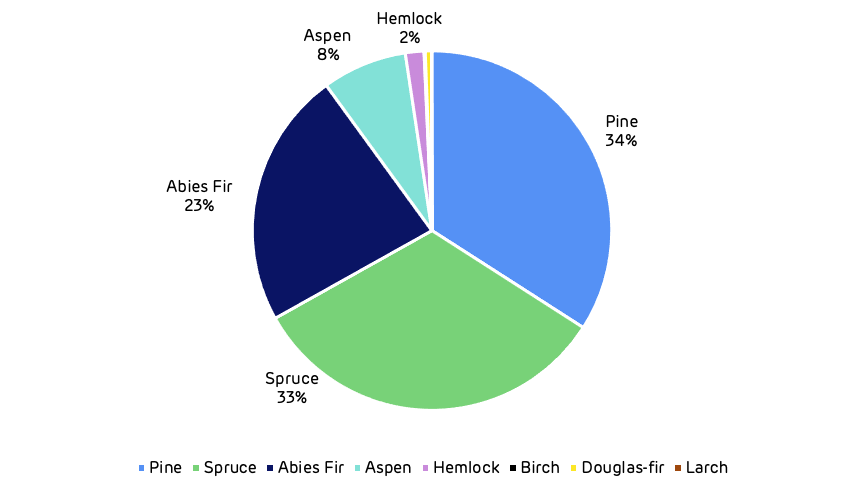
All production sites are located in areas with access to fibre and are able to operate with a range of biomass material from existing commercial forestry activities, including sawmill residues, pre-commercial thinnings and low-grade wood. Combined with a geographic spread of production capacity and access to three separate export facilities, Pinnacle benefits from operational and sourcing flexibility, further enhancing Drax’s security of supply.
Further information is set out in Appendix 1 to this announcement.
Long-term biomass revenues with access to Asian and European markets
Pinnacle has contracted sales of C$6.7 billion, with high-quality Asian and European counterparties (including Drax). This equates to 99% of its current production capacity contracted to third parties through 2026 and a significant volume contracted in 2027 and beyond, providing long-term high-quality revenues.
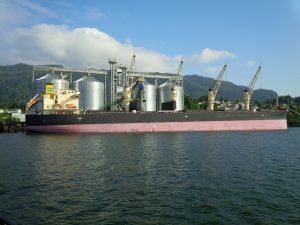
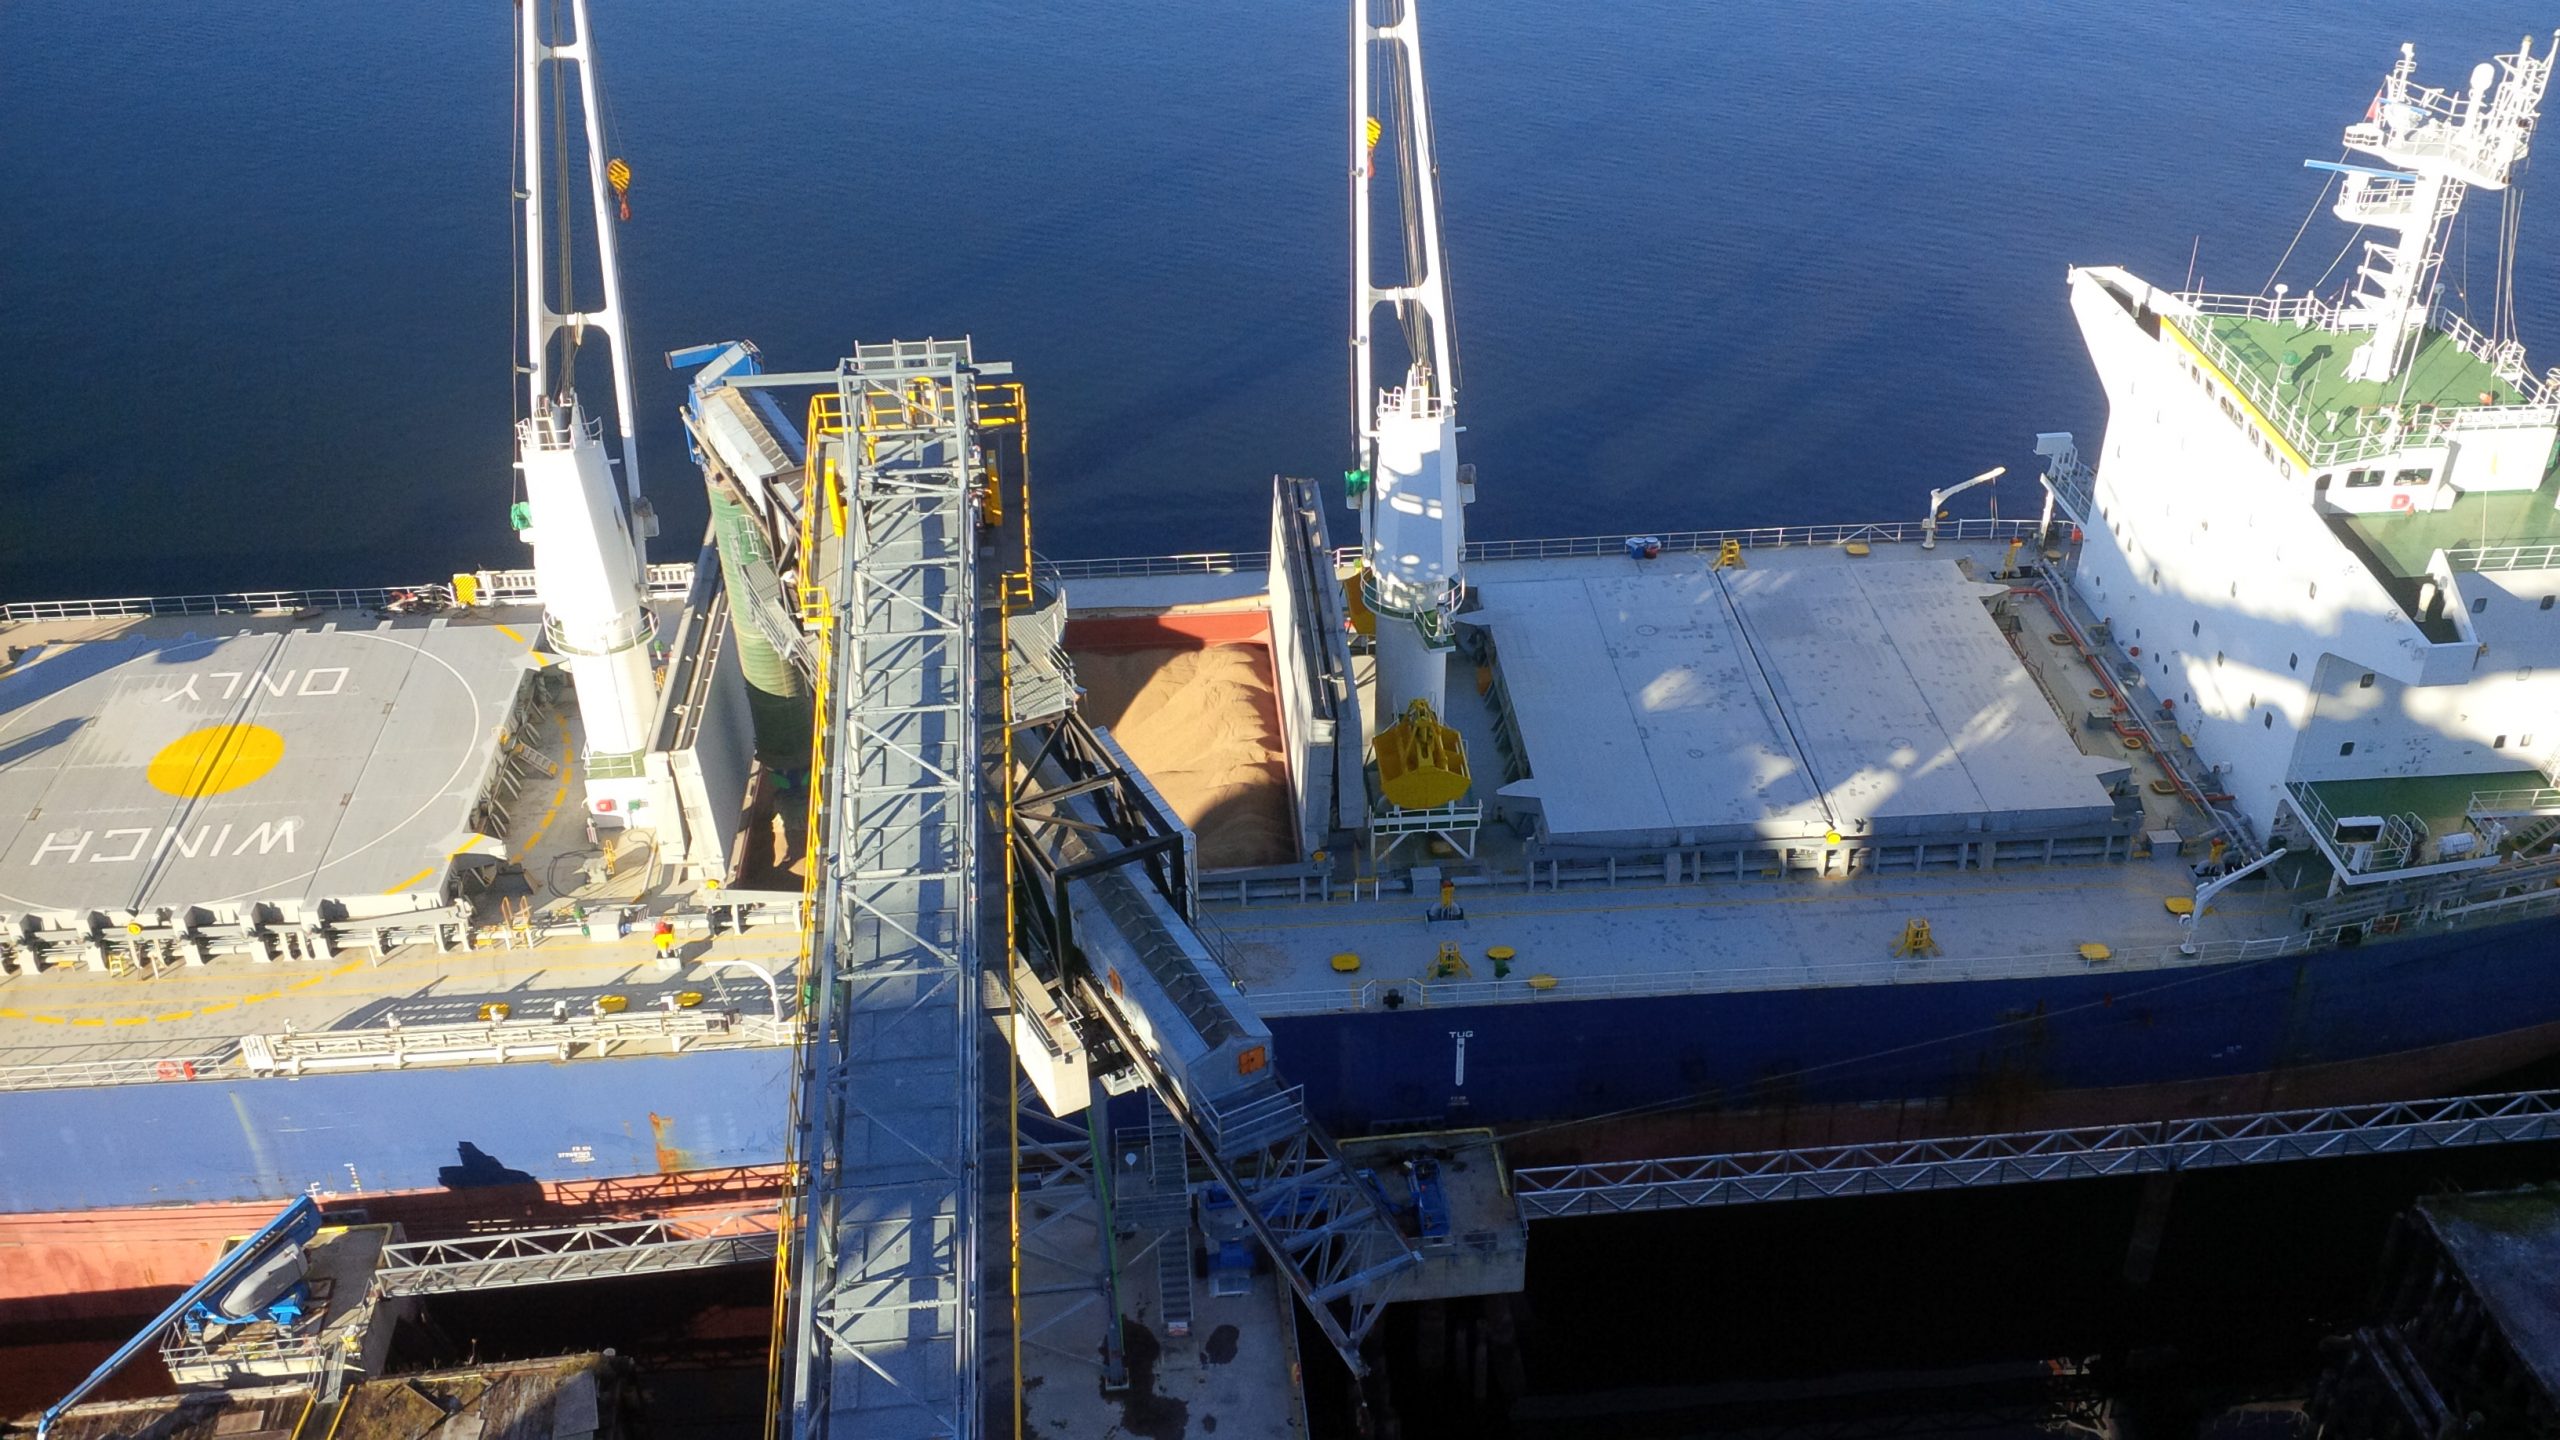
Vessel carrying biomass pellets at Westview Terminal, British Columbia
Pinnacle has been supplying biomass to Europe since 2004. The location of the majority of Pinnacle’s production capacity in Western Canada, with access to the Pacific Ocean, provides a strong position from which to serve the growing demand for biomass in Asian markets. In 2018 and 2019, Pinnacle entered into 12 new long-term contracts in Japan and South Korea, totalling over 1.3 million tonnes per annum, valued at C$4.6 billion, with most contracts commencing between 2021 and 2023. The average contract duration is nine years, with certain contracts extending significantly beyond this point. Contracts typically operate on a take-or-pay basis.
Global growth opportunities for sustainable biomass
The global biomass wood pellet market has a broad range of providers that are expected to expand their production capacity, including operators such as Enviva, Graanul Invest, Pinnacle, An Viet Phat, Fram and SY Energy.
The market for biomass wood pellets for renewable generation in Europe and Asia is expected to grow in the current decade, principally driven by Asian demand(5). Drax believes that increasingly ambitious global decarbonisation targets, the need for negative emissions and an improved understanding of the role that sustainably sourced biomass can play will result in continued robust demand.
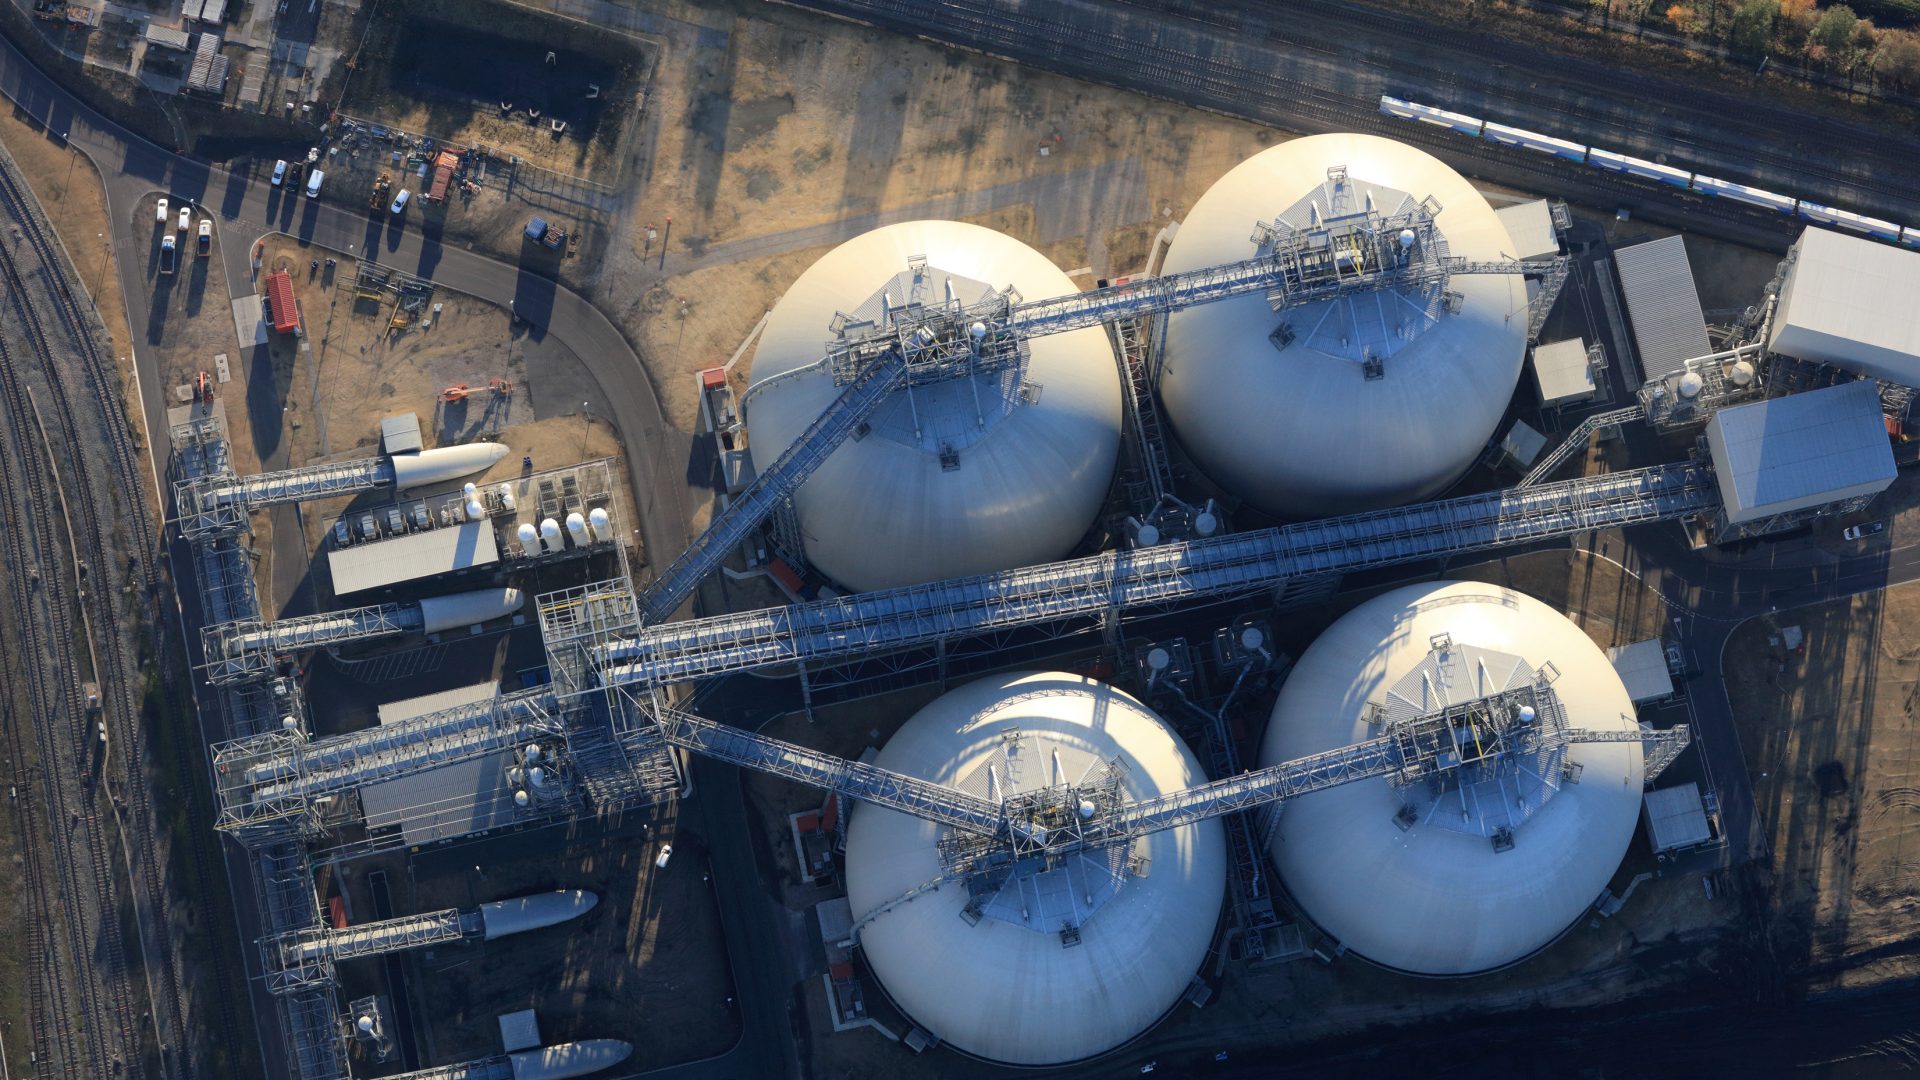
Train pulling biomass wagons, storage domes and wood pellet conveyor system Drax Power Station, North Yorkshire
As a vertically integrated producer and consumer of sustainable biomass Drax is differentiated from its peers and well positioned to deliver supply chain efficiencies and an expanded range of sustainable biomass materials for own-use and third-party sales.
Through its expanding lower cost supply chain, expertise in biomass generation and enhanced global footprint, Drax believes that there will be opportunities to work with other companies and countries in developing their own biomass-enabled decarbonisation strategies.
Strong return on investment
The Acquisition is expected to be cash generative and represent an attractive opportunity to create significant value for shareholders, with expected returns significantly in excess of the Group’s weighted average cost of capital.
The addition of long-term contracts with high-quality counterparties in growing international biomass markets will reduce the Group’s relative exposure to commodity prices, in line with the Group’s objective to improve earnings quality and visibility.
In total, the Acquisition increases access to lower cost biomass by a further 2.9 million tonnes after the commissioning of the Demopolis plant in 2021. The price paid for this capacity is consistent with the previously outlined strategy to invest in the region of c.£600 million to deliver Drax’s plans for five million tonnes of self-supply capacity and a biomass cost of £50/MWh by 2027.
For the year ended 27 December 2019, Pinnacle generated Adjusted EBITDA(6) of C$47 million from pellet sales of 1.7 million tonnes.
Pinnacle’s 2019 performance was impacted by fire at its Entwistle plant, reduced rail access due to rail industrial action and weather disrupted forestry activity. At the same time Pinnacle experienced regional Canadian sawmill closures, resulting in some reduction in sawmill residues and an increase in provincial fibre prices.
Fibre diversification and the development of a second hub in the Southeastern US is expected to partially mitigate the risk of fibre price rises.
Taking these factors into account, alongside the commissioning of new capacity and the commencement of Asian supply contracts, Pinnacle’s 2022 consensus EBITDA is C$99 million, increasing to C$126 million in 2023 (Bloomberg).
The Acquisition strengthens the Group’s ability to pay a sustainable and growing dividend. Drax does not expect the Acquisition to have any impact on its expectations for the final dividend payment for 2020.
Financing the Acquisition
The Acquisition is expected to be funded from cash and existing agreements. On 15 December 2020 the Group issued a trading update which noted cash and total committed liquidity of £643 million at 30 November 2020. Following the completion, on 31 January 2021, of the sale of four gas power stations, previously announced on 15 December 2020, the Group received cash of £188 million, being the agreed purchase price consideration of £164 million and £24 million of customary working capital adjustments.
Net debt to Adjusted EBITDA(7) in 2021 is expected to be above Drax’s long-term target of around 2 times immediately after completion of the Acquisition but is expected to return to around this level by the end of 2022.
Management of foreign exchange exposure
The Acquisition price will be paid in Canadian dollars. Pinnacle’s existing contracts with Drax and third parties are denominated in Canadian and US dollars and Drax expects to manage any exposure within its foreign exchange processes.
Drax’s policy is to hedge its foreign currency exposure on contracted biomass volumes over a rolling five-year period. This has given rise to an average foreign exchange rate hedge around 1.40 (US$/GBP£).
Sustainable sourcing
Sustainably sourced biomass is an important part of UK and European renewable energy policy. The renewable status of sustainably sourced biomass is based on well-established scientific principles set out by the Intergovernmental Panel on Climate Change and reflected in the European Union’s (EU) second Renewable Energy Directive and the UK Renewables Obligation.
Drax maintains a rigorous approach to biomass sustainability, ensuring the wood fibre it uses is fully compliant with the UK’s mandatory standards as well as those of the EU.

Dead pine trees in background, infected with mountain pine beetle, British Columbia
Drax recognises that the forest landscape in British Columbia and Alberta is different to commercially managed forests in the Southeastern US. Working in partnership with eNGO Earthworm, Drax has a good understanding of the considerations associated with sourcing residues from harvesting of primary forest and the particular characteristics of the forests in British Columbia and Alberta. In line with its responsible sourcing policy, Drax will work closely with eNGO partners, Indigenous First Nation communities and other stakeholders, and invest to deliver good environmental, social and climate outcomes in Pinnacle’s sourcing areas.
Operational efficiencies, improvements and savings
The strong financial returns associated with the Acquisition are not dependent on synergy benefits, but the Group has identified areas for potential operational improvements and efficiencies, and opportunities to invest across the supply chain to achieve consistent standards and improve outputs across the enlarged group.
Portfolio optimisation
Drax aims to leverage Pinnacle’s trading capability across its expanded portfolio. Drax believes that the enlarged supply chain will provide greater opportunities to optimise the supply of biomass from its own assets and third-party suppliers.
With existing plans to widen of the Group’s sustainable biomass fuel mix to include a wider range of lower cost sustainable biomass materials, Drax expects to create further opportunities to optimise fuel cargos for own use and third-party supply.
Logistics optimisation
Drax believes that the transport and shipping requirements of the enlarged group will provide greater opportunities to optimise logistics, with delivery of cargos to a counterparty’s closest port, reducing distance, time, carbon footprint and cost.
Enhanced security of supply
Control of Drax’s biomass supply chain, with geographically diverse production and export facilities, is expected to enhance security of supply, further mitigating the risk of supply interruptions thereby resulting in improved reliability and a reduced risk of supply interruption.
Combined expertise
Drax believes that there will be opportunities to share best practice and drive improved production performance across the enlarged group by leveraging combined expertise in the production of good-quality, low-cost pellets across the enlarged supply chain.
Drax also expects to leverage Pinnacle’s experience in developing and managing third-party off-take agreements alongside its existing commercial and trading capabilities to develop new agreements for supply to third-parties.
Stronger counterparty credit
Drax has a stronger credit rating, which could enable Pinnacle to develop its supply capability and contracts in Asian and European markets beyond its current position.
Reduced cost of debt
Drax’s average cost of debt is lower than Pinnacle’s giving rise to potential future savings.
Corporate cost savings
Drax expects to derive typical corporate cost savings associated with the Acquisition and delisting from the Toronto Stock Exchange.
Shareholder approvals
The Acquisition constitutes a Class 1 transaction under the Listing Rules. As a consequence, completion of the Acquisition is conditional on the Acquisition receiving the approval of Drax shareholders. A combined shareholder circular and notice of general meeting will be posted to shareholders as soon as practicable.
Among other things, the Acquisition is also conditional upon the approval of the Acquisition by Pinnacle’s shareholders, the approval of the Supreme Court of British Columbia, certain antitrust and other regulatory approvals other customary conditions.
A summary of the terms of the Acquisition Agreement is set out in Appendix 2 to this announcement.
Drax’s board has unanimously recommended that Drax’s shareholders vote in favour of the Acquisition, as each of the Drax directors that hold shares in Drax shall do in respect of their own beneficial holdings of Drax’s shares, representing approximately 0.17 per cent. of the existing share capital of Drax as at 5 February 2021, being the last business day prior to the date of this announcement.
Pinnacle’s board has unanimously recommended that Pinnacle’s shareholders vote in favour of the Acquisition at the Pinnacle General Meeting, as the Pinnacle directors (and certain current and former members of Pinnacle management that hold shares in Pinnacle) shall do in respect of their own beneficial holdings of Pinnacle’s shares, representing approximately 4.75 per cent. of the existing share capital of Pinnacle as at 5 February 2021, being the last business day prior to the date of this announcement.
In addition to the irrevocable undertakings from Pinnacle directors described above, Drax has also received an irrevocable undertaking from affiliates of ONCAP (which, together, hold shares representing approximately 31% of Pinnacle’s shares as at 5 February 2021 (being the last business day prior to the date of this announcement)) to vote in favour of the Acquisition at Pinnacle’s General Meeting.
Other
Drax issued a trading update on 15 December 2020 outlining its expectations for 2020 and expects to announce its full year results for the year ended 31 December 2020 on 25 February 2021.
Enquiries:
Drax Investor Relations: Mark Strafford
+44 (0) 7730 763 949
Media:
Drax External Communications: Ali Lewis
+44 (0) 7712 670 888
Royal Bank of Canada (Financial Adviser and Joint Corporate Broker):
+44 (0) 20 7653 4000
Peter Buzzi
Mark Rushton
Evgeni Jordanov
Jonathan Hardy
Jack Wood
Acquisition presentation meeting and webcast arrangements
Management will host a webcast for analysts and investors at 9:30am (UK Time), Monday 8 February 2021.
The webcast can be accessed remotely via a live webcast link, as detailed below. After the meeting, the webcast recording will be made available and access details of this recording are also set out below.
A copy of the presentation will be made available from 7am (UK time) on 8 February 2021 for download at: https://www.drax.com/investors/results-reports-agm/#investor-relations-presentations
Event Title:
Drax Group plc: Proposed Acquisition of Pinnacle Renewable Energy Inc
Event Date:
9:30am (UK time), Monday 08 February 2021
Webcast Live Event Link:
https://secure.emincote.com/client/drax/drax010
Start Date:
9:30am (UK time), Monday 08 February 2021
Delete Date:
Monday 27 December 2021
Archive Link:
https://secure.emincote.com/client/drax/drax010
Important notice
The contents of this announcement have been prepared by and are the sole responsibility of Drax Group plc (the “Company”).
RBC Europe Limited (“RBC”), which is authorised by the Prudential Regulation Authority (the “PRA”) and regulated in the United Kingdom by the Financial Conduct Authority (“FCA”) and the PRA, is acting exclusively for the Company and for no one else in connection with the Acquisition, the content of this announcement and other matters described in this announcement and will not regard any other person as its clients in relation to the Acquisition, the content of this announcement and other matters described in this announcement and will not be responsible to anyone other than the Company for providing the protections afforded to its clients nor for providing advice to any other person in relation to the Acquisition, the content of this announcement or any other matters referred to in this announcement.
This announcement does not constitute or form part of any offer or invitation to sell or issue, or any solicitation of any offer to purchase or subscribe for, any shares in the Company or in any entity discussed herein, in any jurisdiction nor shall it or any part of it nor the fact of its distribution form the basis of, or be relied on in connection with, any contract commitment or investment decision in relation thereto nor does it constitute a recommendation regarding the securities of the Company or of any entity discussed herein.
RBC and its affiliates do not accept any responsibility or liability whatsoever and make no representations or warranties, express or implied, in relation to the contents of this announcement, including its accuracy, fairness, sufficient, completeness or verification or for any other statement made or purported to be made by it, or on its behalf, in connection with the Acquisition and nothing in this announcement is, or shall be relied upon as, a promise or representation in this respect, whether as to the past or the future. RBC and its respective affiliates accordingly disclaim to the fullest extent permitted by law all and any responsibility and liability whether arising in tort, contract or otherwise which it might otherwise be found to have in respect of this announcement or any such statement.
Certain statements in this announcement may be forward-looking. Any forward-looking statements reflect the Company’s current view with respect to future events and are subject to risks relating to future events and other risks, uncertainties and assumptions relating to the Company and its group’s and/or, following completion, the enlarged group’s business, results of operations, financial position, liquidity, prospects, growth, strategies, integration of the business organisations and achievement of anticipated combination benefits in a timely manner. Forward-looking statements speak only as of the date they are made. Although the Company believes that the expectations reflected in these forward looking statements are reasonable, it can give no assurance or guarantee that these expectations will prove to have been correct. Because these statements involve risks and uncertainties, actual results may differ materially from those expressed or implied by these forward looking statements.
Each of the Company, RBC and their respective affiliates expressly disclaim any obligation or undertaking to supplement, amend, update, review or revise any of the forward looking statements made herein, except as required by law.
You are advised to read this announcement and any circular (if and when published) in their entirety for a further discussion of the factors that could affect the Company and its group and/or, following completion, the enlarged group’s future performance. In light of these risks, uncertainties and assumptions, the events described in the forward-looking statements in this announcement may not occur.
Neither the content of the Company’s website (or any other website) nor any website accessible by hyperlinks on the Company’s website (or any other website) is incorporated in, or forms part of, this announcement.
Appendix 1
Pinnacle Production Capacity
| Plant | Location | Status | Commissioning | Nameplate Capacity (Mt) | Pinnacle Ownership (%) |
| Williams Lake | BC, Canada | Operational | 2004 | 0.2 | 100% |
| Houston | BC, Canada | Operational | 2006 | 0.2 | 30% |
| Armstrong | BC, Canada | Operational | 2007 | 0.1 | 100% |
| Meadowbank | BC, Canada | Operational | 2008 | 0.2 | 100% |
| Burns Lake | BC, Canada | Operational | 2011 | 0.4 | 100% |
| Lavington | BC, Canada | Operational | 2015 | 0.3 | 75% |
| Smithers | BC, Canada | Operational | 2018 | 0.1 | 70% |
| Entwistle | Alberta, Canada | Operational | 2018 | 0.4 | 100% |
| Aliceville | Alabama, USA | Operational | 2018 | 0.3 | 70% |
| High Level | Alberta, Canada | Operational | 2020 | 0.2 | 50% |
| Demopolis | Alabama, USA | Development | Est. 2021 | 0.4 | 70% |
| Total | | | | 2.9 | 80% |
Capacity by fibre basket in 2021
| Location | Nameplate Capacity (Mt) | Pinnacle Ownership (%) |
| BC, Canada | 1.6 | 84% |
| Alberta, Canada | 0.6 | 83% |
| Alabama, USA | 0.3 | 70% |
| Total | 2.5 | 82% |
Capacity by fibre basket in 2022
| Location | Nameplate Capacity (Mt) | Pinnacle Ownership (%) |
| BC, Canada | 1.6 | 84% |
| Alberta, Canada | 0.6 | 83% |
| Alabama, USA | 0.7 | 63% |
| Total | 2.9 | 81% |
Across its business Pinnacle employs 485 employees, principally in the operation of its assets.
Appendix 2
Principal terms of the Acquisition Agreement
The following is a summary of the principal terms of the Acquisition Agreement.
Parties and consideration
The Acquisition Agreement was entered into on 7 February 2021 between Drax, Drax Canadian Holdings Inc., (an indirect wholly-owned subsidiary of Drax) (“Bidco”) and Pinnacle. Pursuant to the Acquisition Agreement, Bidco has agreed to acquire all of the issued and outstanding shares in Pinnacle and, immediately following completion, Pinnacle will be an indirect wholly-owned subsidiary of Drax. The Acquisition will be implemented by way of a statutory plan of arrangement in accordance with the laws of the Province of British Columbia, Canada.
Conditions
Completion under the Acquisition Agreement is subject to, and can only occur upon satisfaction or waiver of, a number of conditions, including:
(a) the approval of the Acquisition by Drax shareholders who together represent a simple majority of votes cast at a meeting of Drax shareholders;
(b) the approval of the Acquisition by Pinnacle shareholders who together represent not less than two-thirds of votes cast at a meeting of Pinnacle shareholders;
(c) an interim order providing for, among other things, the calling and holding of a meeting of Pinnacle shareholders and a final order to approve the Arrangement, each having been granted by the Supreme Court of British Columbia;
(d) no material adverse effect having occurred in respect of Pinnacle;
(e) in the event that the Competition and Markets Authority (the “CMA”) has requested submission of a merger notice or opened a merger investigation, the CMA having issued a decision that the Acquisition will not be subject to a Phase 2 reference or the period for the CMA considering a merger notice has expired without a Phase 2 reference having been made;
(f) either the receipt of an advance ruling certificate or both the expiry, termination or waiver of the applicable waiting period under the Competition Act (Canada) and, unless waived by Drax, receipt of a no-action letter in respect of the Acquisition from the Commissioner of Competition;
(g) the expiry or early termination of any applicable waiting period (and any extension of such period) applicable to the Acquisition under the Hart-Scott-Rodino Antitrust Improvements Act of 1976 (US); and
(h) the receipt a third party consent
In addition, Drax has the unilateral right not to complete the Acquisition where registered Pinnacle shareholders representing more than five per cent. of the outstanding share capital of Pinnacle duly exercise their dissent rights.
If any of the conditions are not satisfied (or waived) by 7 September 2021, either party can terminate the Acquisition Agreement.
Non-solicitation
Prior to obtaining approval from their respective shareholders in relation to the Acquisition, each of Drax and Pinnacle are prohibited from soliciting from any third party any acquisition proposal (relating to 20 per cent. or more of their shares or their group’s assets). However, if prior to obtaining Drax shareholder approval, Drax receives an unsolicited bona fide proposal in respect of 50 per cent. or more of its shares or all or substantially all of the assets of the Drax group and which the Drax board considers would result in a transaction that is more favourable to Drax shareholders from a financial perspective than the Acquisition (a “Drax Superior Proposal”), it may engage in discussions in relation to such Drax Superior Proposal in accordance with the terms of the Acquisition Agreement. Similarly, if prior to obtaining Pinnacle shareholder approval, Pinnacle receives an unsolicited bona fide proposal in respect of 100 per cent. of its shares or all or substantially all of the assets of the Pinnacle group and which the Pinnacle board considers would result in a transaction that is more favourable to Pinnacle shareholders from a financial perspective than the Acquisition (a “Pinnacle Superior Proposal”), it may engage in discussions in relation to such proposal in accordance with the terms of the Acquisition Agreement.
Termination fees payable to Pinnacle
Drax has agreed to pay a break fee of C$25 million to Pinnacle if the Acquisition Agreement is terminated as a result of:
(a) the Drax board withholding, withdrawing or adversely modifying its recommendation that Drax shareholders approve the Acquisition;
(b) the Drax board authorising Drax to enter into any definitive agreement (other than a confidentiality agreement) in respect of a Drax Superior Proposal;
(c) the Drax board terminating the Acquisition Agreement in response to any intervening event that was not known to the Drax board as of the date of the Acquisition Agreement;
(d) Drax breaching its non-solicitation obligations set out in the Acquisition Agreement; or
(e) completion not occurring by 7 September 2021 or a failure to obtain Drax shareholder approval and, in each case, an acquisition of 50 per cent. of Drax’s shares or assets (subject to certain exceptions) is is made or announced prior to the Drax shareholder approval having been obtained and any such acquisition is consummated (or a definitive agreement is entered into in respect of the same) within 12 months of termination.
In addition, Drax has agreed to pay Pinnacle an expense fee of C$5 million in the event that the Acquisition Agreement is terminated as a result of a failure to obtain Drax shareholder approval. The expense fee shall not be payable in the event that the break fee is also payable.
Termination fees payable to Drax
Pinnacle has agreed to pay a break fee of C$12.5 million to Drax if the Acquisition Agreement is terminated as a result of:
(a) the Pinnacle board withholding, withdrawing or adversely modifying its recommendation that Drax shareholders approve the Acquisition;
(b) the Pinnacle board authorising Pinnacle to enter into any definitive agreement (other than a confidentiality agreement) in respect of a Pinnacle Superior Proposal;
(c) the Pinnacle board terminating the Acquisition Agreement in response to any intervening event that was not known to the Pinnacle board as of the date of the Acquisition Agreement;
(d) Pinnacle breaching its non-solicitation obligations set out in the Acquisition Agreement; or
(e) completion not occurring by 7 September 2021 or a failure to obtain Pinnacle shareholder approval and, in each case, an acquisition of 50 per cent. of Pinnacle’s shares or assets (subject to certain exceptions) is made or announced prior to the Drax shareholder approval having been obtained and any such acquisition is consummated (or a definitive agreement is entered into in respect of the same) within 12 months of termination.