


The forest area around the Drax Morehouse BioEnergy plant has a long history of active management for timber production. 96% of the forest owners are private and around half of these are corporate investors seeking a financial return from forest management. The pulp and paper (p&p) sector dominates the market for low grade roundwood with over 75% of the total demand. The wood pellet markets use only 6% of the roundwood, of which 4% is used by Morehouse.
Given the small scale of demand in the pellet sector, the extent of influence is limited. However, the new pellet markets have had a positive impact, replacing some of the declining demand in the p&p sector and providing a market for thinnings for some forest owners and a new off-take for sawmill residues.
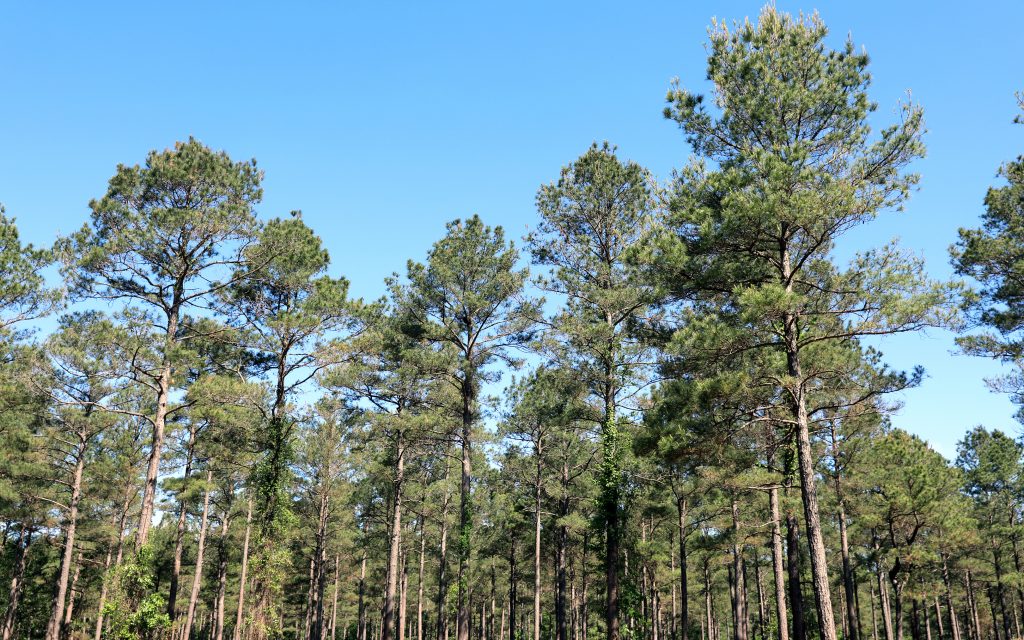
Pine forest is dominant in this area with an increasing inventory (growing stock) despite a stable forest area. Active management of pine forests has increased the amount of timber stored in the standing trees by 68 million tonnes from 2006 to 2018. Over the same period the hardwood inventory remained static.
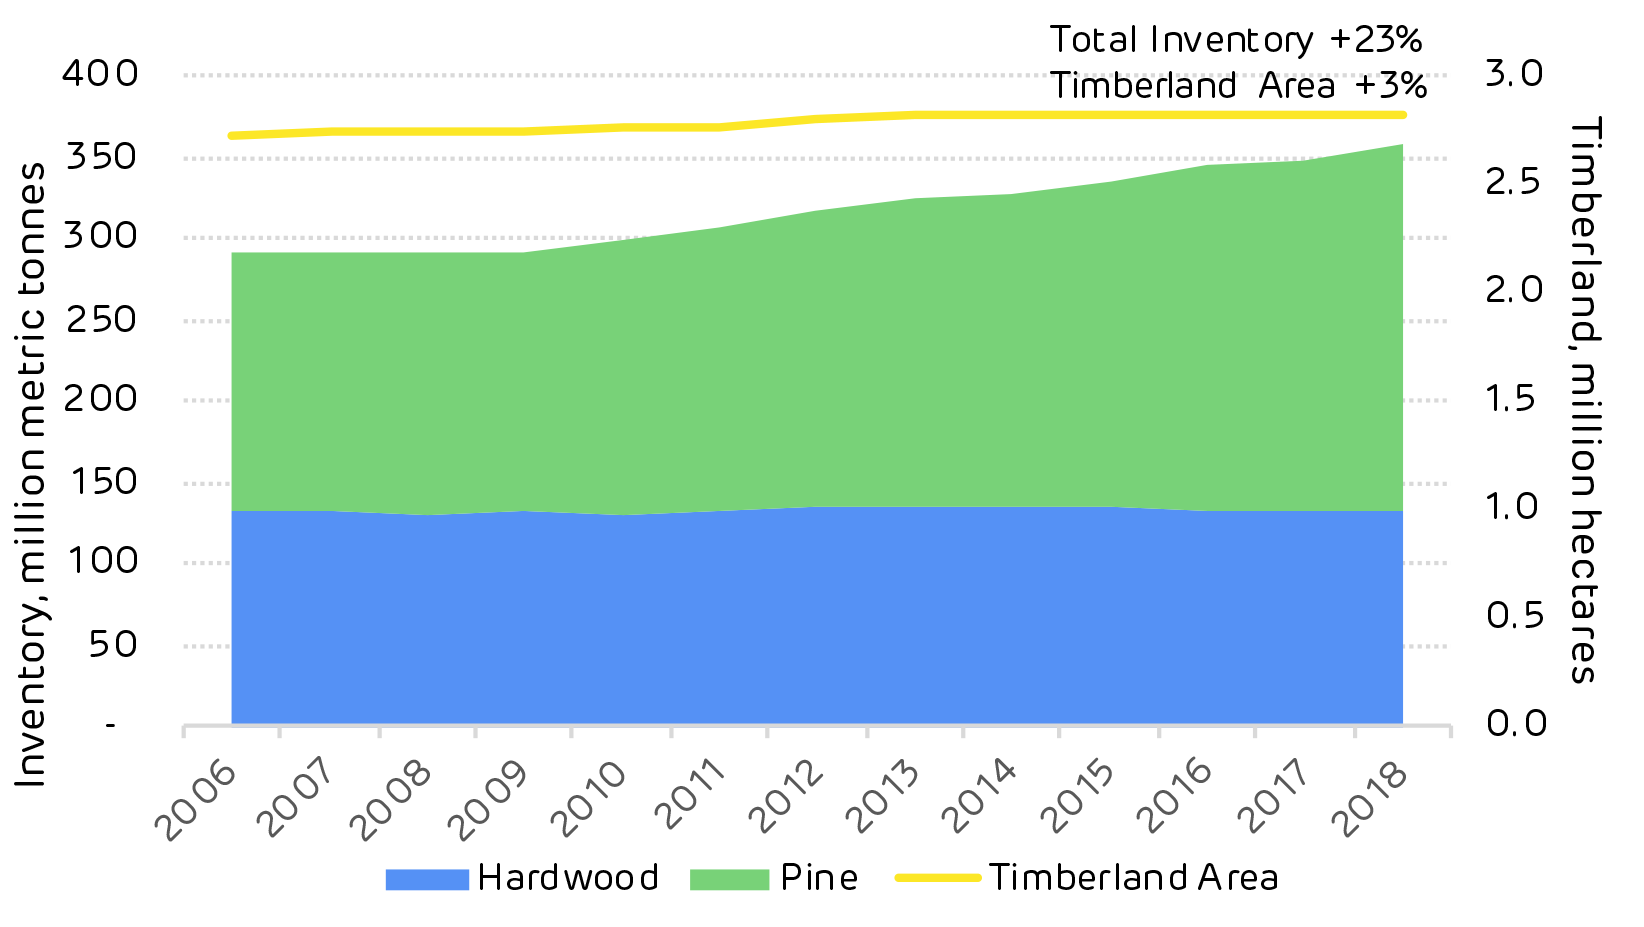
Historic inventory and timberland area in Morehouse catchment; click to view/download.
US Forest Service FIA data shows that the pine resource in this catchment area has been maturing, the volume of timber has been increasing in each size class year on year. This means that the volume available for harvesting is increasing and that more markets will be required to utilise this surplus volume and ensure that the long-term future of the forest area can be maintained.
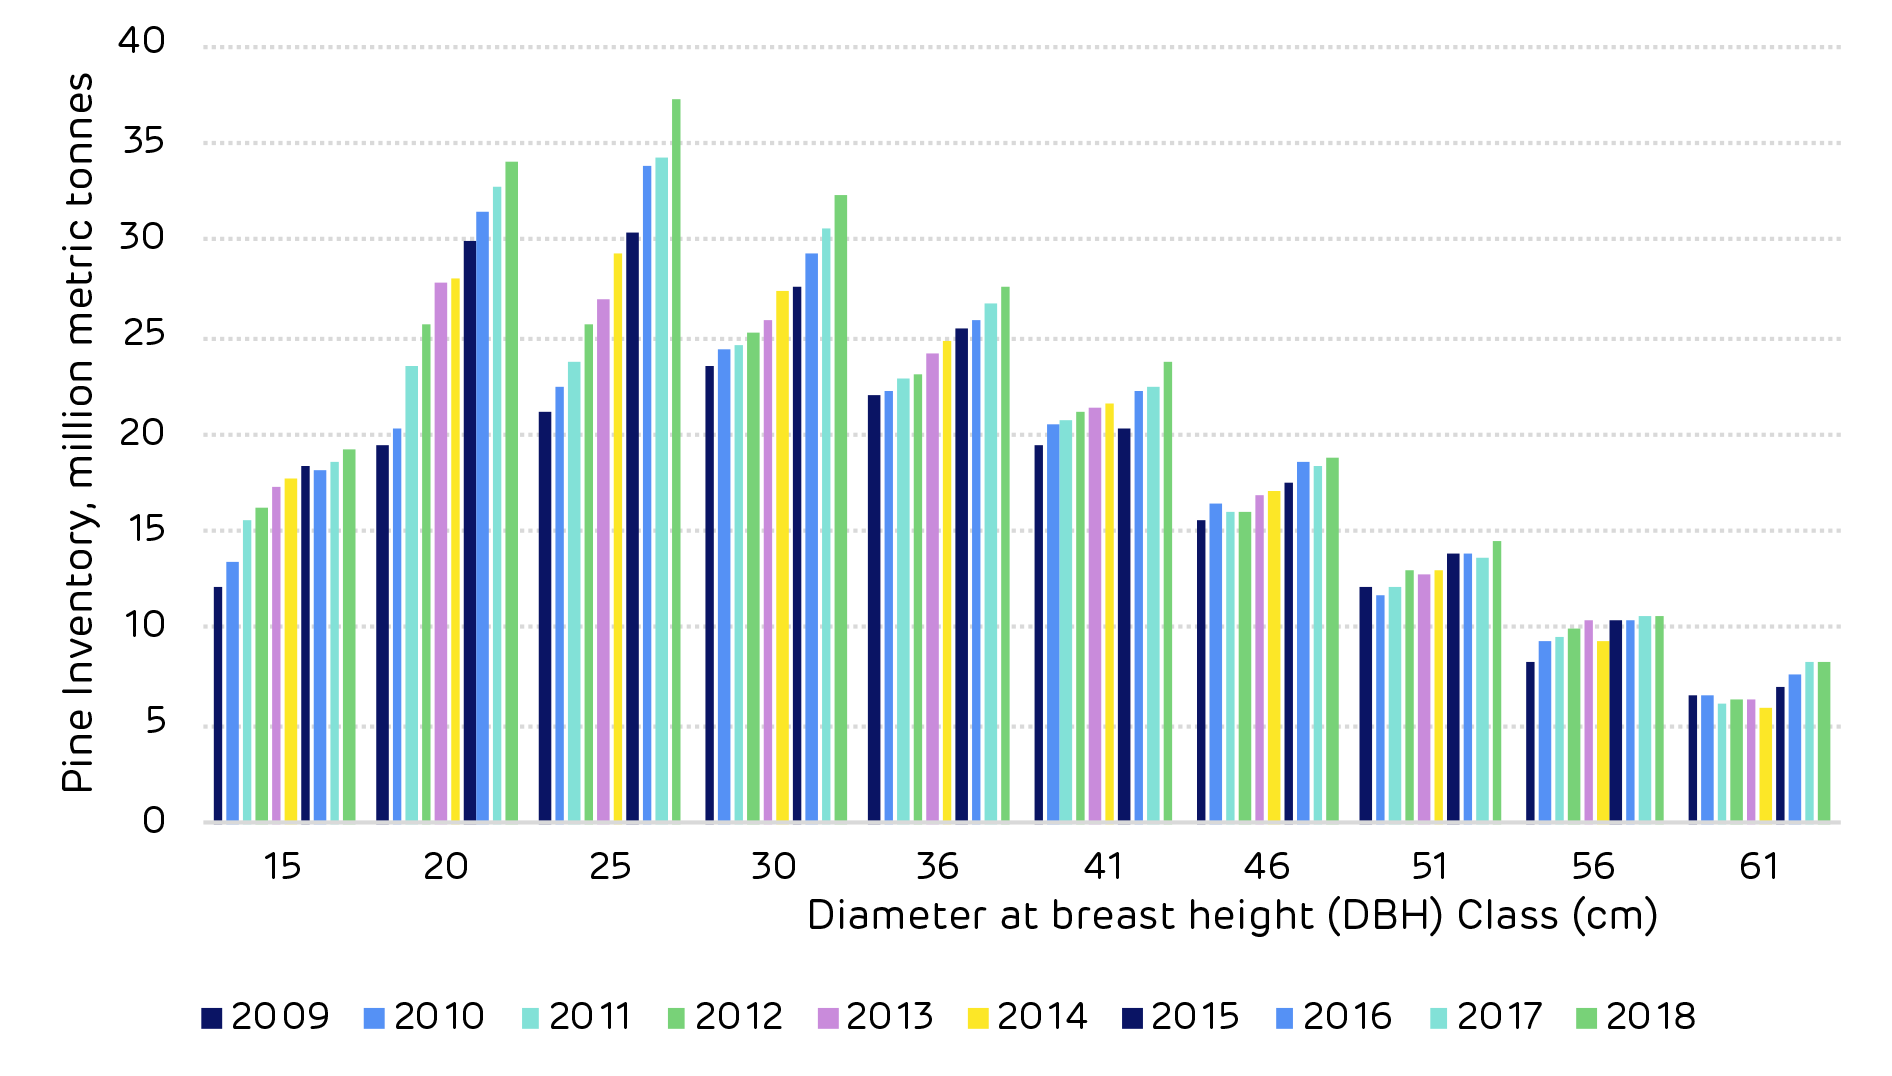
Historic pine inventory by DBH Class in Morehouse catchment; click to view/download.
This is reflected in the growth drain ratio – the comparison of annual growth versus harvesting. A ratio of one shows a forest area in balance, less than one shows that harvesting is greater than growth. This can be the case when the forest area is predominantly mature and at the age when clear cutting is necessary.
A growth drain ratio of more than one shows that growth exceeds harvesting, this is typically the case in younger forests that are not yet ready for harvesting and are in the peak growing phase, but it can also occur when insufficient market demand exists and owners are forced to retain stands for longer in the absence of a viable market.
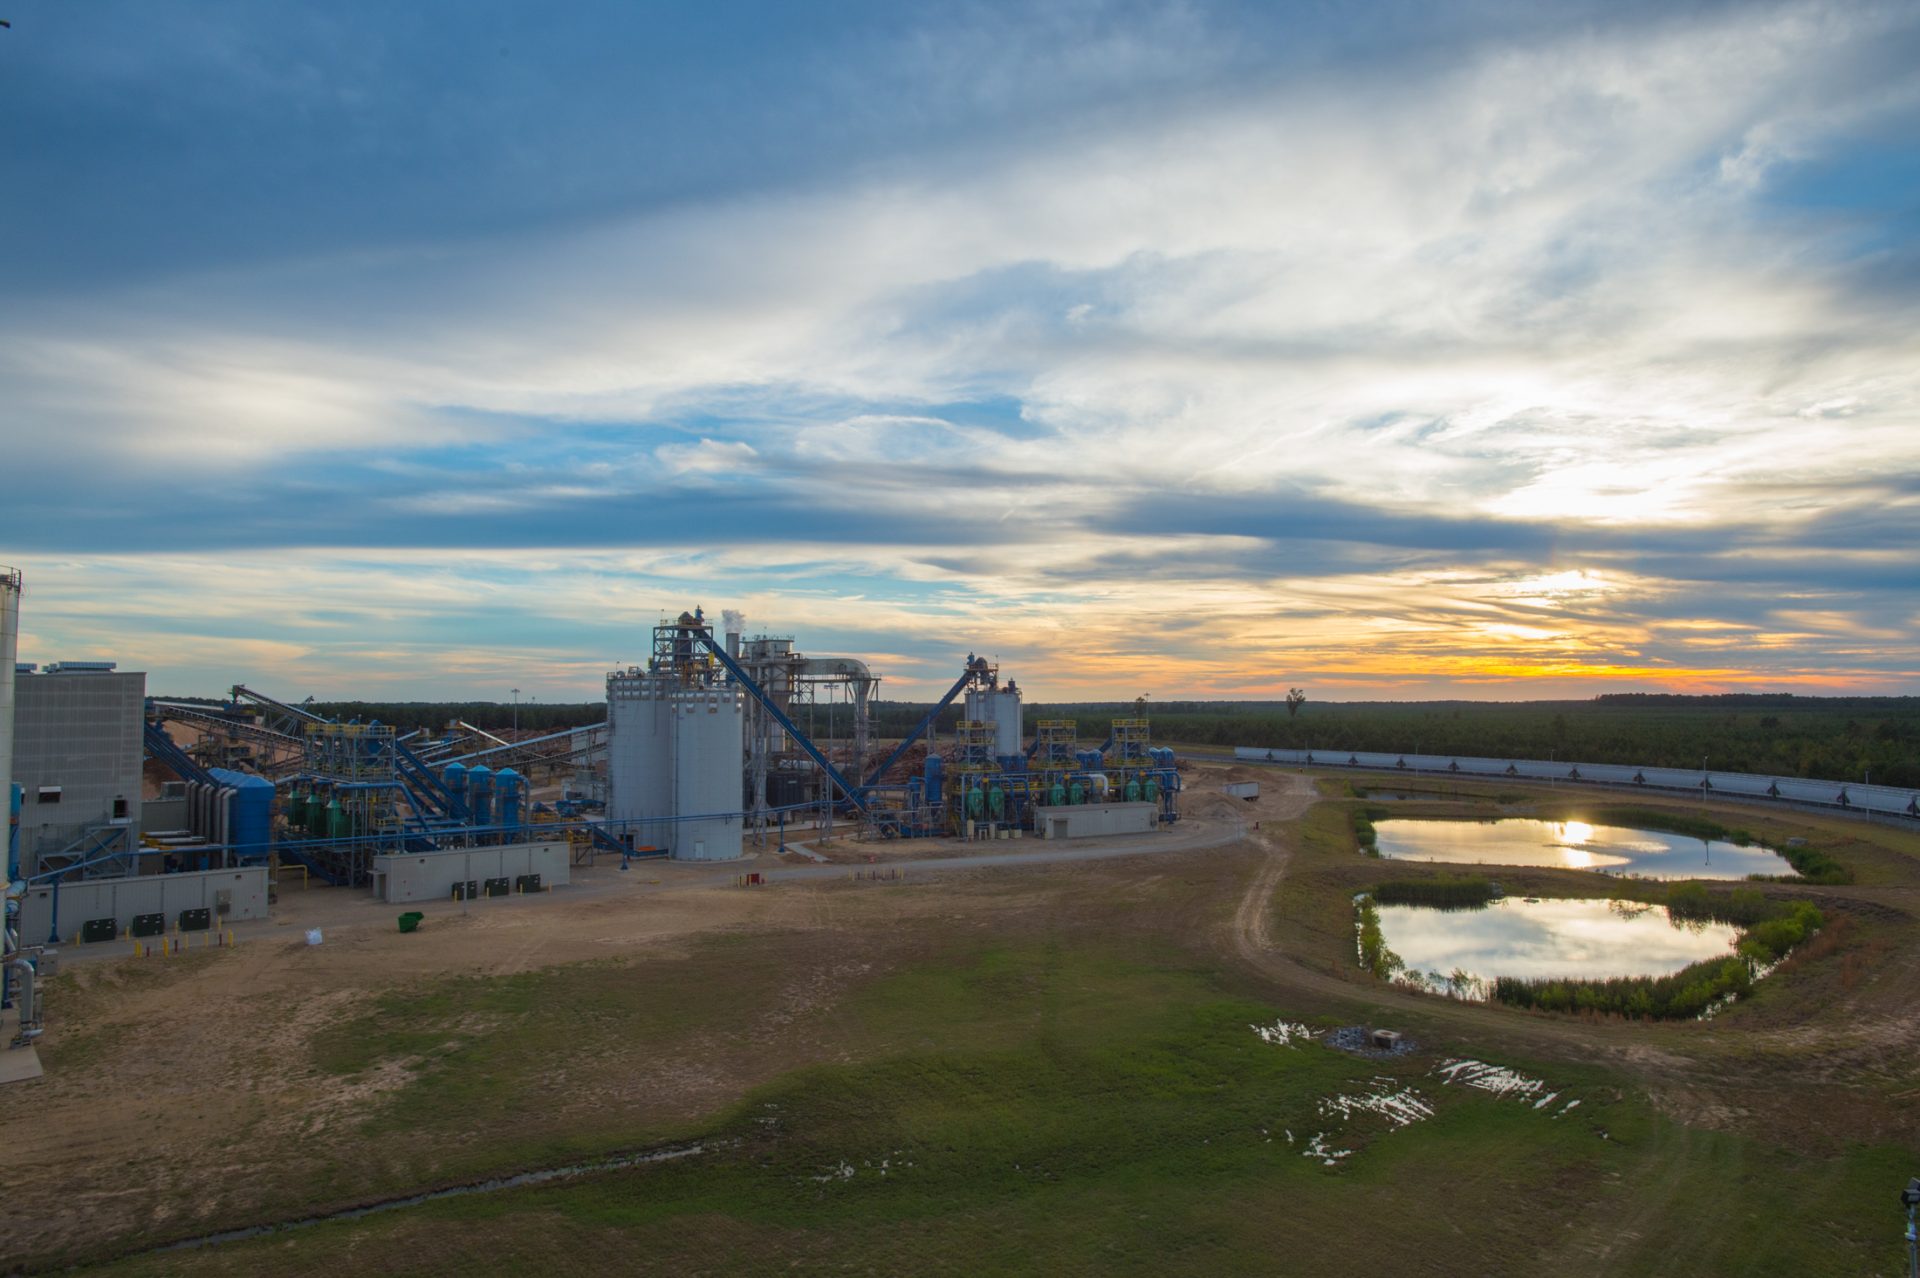
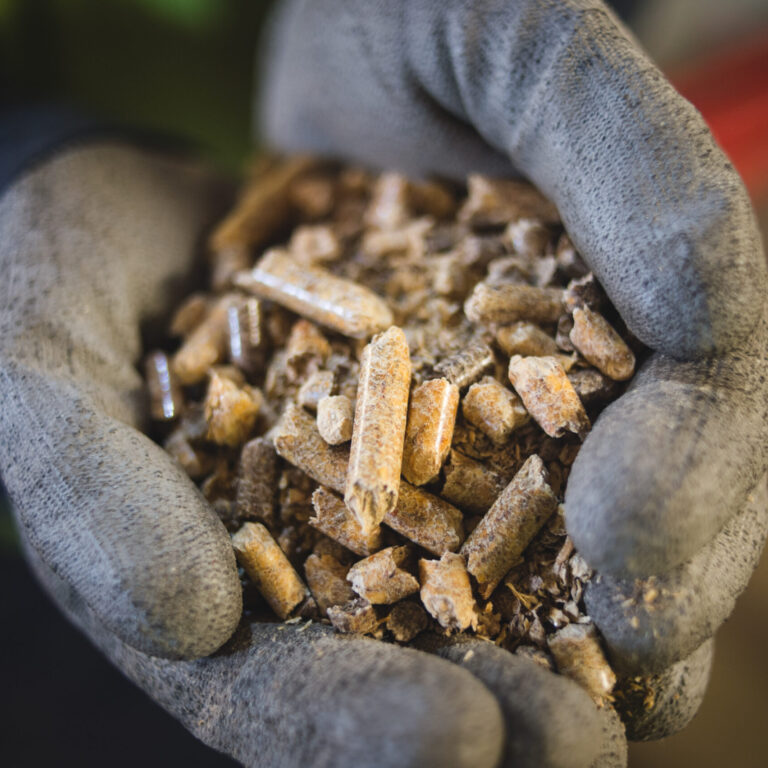
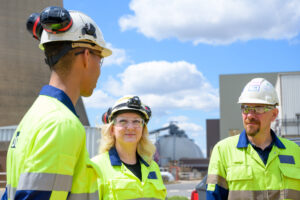
Drax’s Morehouse BioEnergy compressed wood pellet plant in northern Louisiana
This can have a negative impact on the future growth of the forest; limiting the financial return to forest owners and reducing the cumulative sequestration of carbon by enforcing sub-optimal rotation lengths.
The current growth drain ratio of pine around Morehouse is 1.67 with an average annual surplus of around 7 million metric tonnes. This surplus of growth is partly due to a decline in saw-timber demand due to the global financial crisis but also due to the maturing age class of the forest resource and the increasing quantity of timber available for harvesting.
Historic growth and removals of pine in Morehouse catchment (million metric tonnes)
| Year | Growth | Removals | Net Growth | Growth-to-Drain |
|---|---|---|---|---|
| 2009 | 14.1129607624 | 11.186012462 | 2.9269483004 | 1.26166145535 |
| 2010 | 14.5803311006 | 10.9181949346 | 3.66213616602 | 1.33541589869 |
| 2011 | 15.1299032736 | 10.7216229782 | 4.40828029545 | 1.41115792865 |
| 2012 | 15.3572584047 | 10.3075590439 | 5.04969936081 | 1.48990254039 |
| 2013 | 15.6389820618 | 9.70161780806 | 5.9373642537 | 1.61199733603 |
| 2014 | 15.9104151822 | 9.37656477155 | 6.53385041065 | 1.69682773701 |
| 2015 | 15.9423536449 | 9.66913326647 | 6.27322037843 | 1.64878828387 |
| 2016 | 16.4352784078 | 9.57935724181 | 6.85592116596 | 1.71569740985 |
| 2017 | 16.8380753546 | 10.159473739 | 6.67860161568 | 1.65737672908 |
| 2018 | 17.7709683489 | 10.6593882004 | 7.11158014856 | 1.66716588371 |
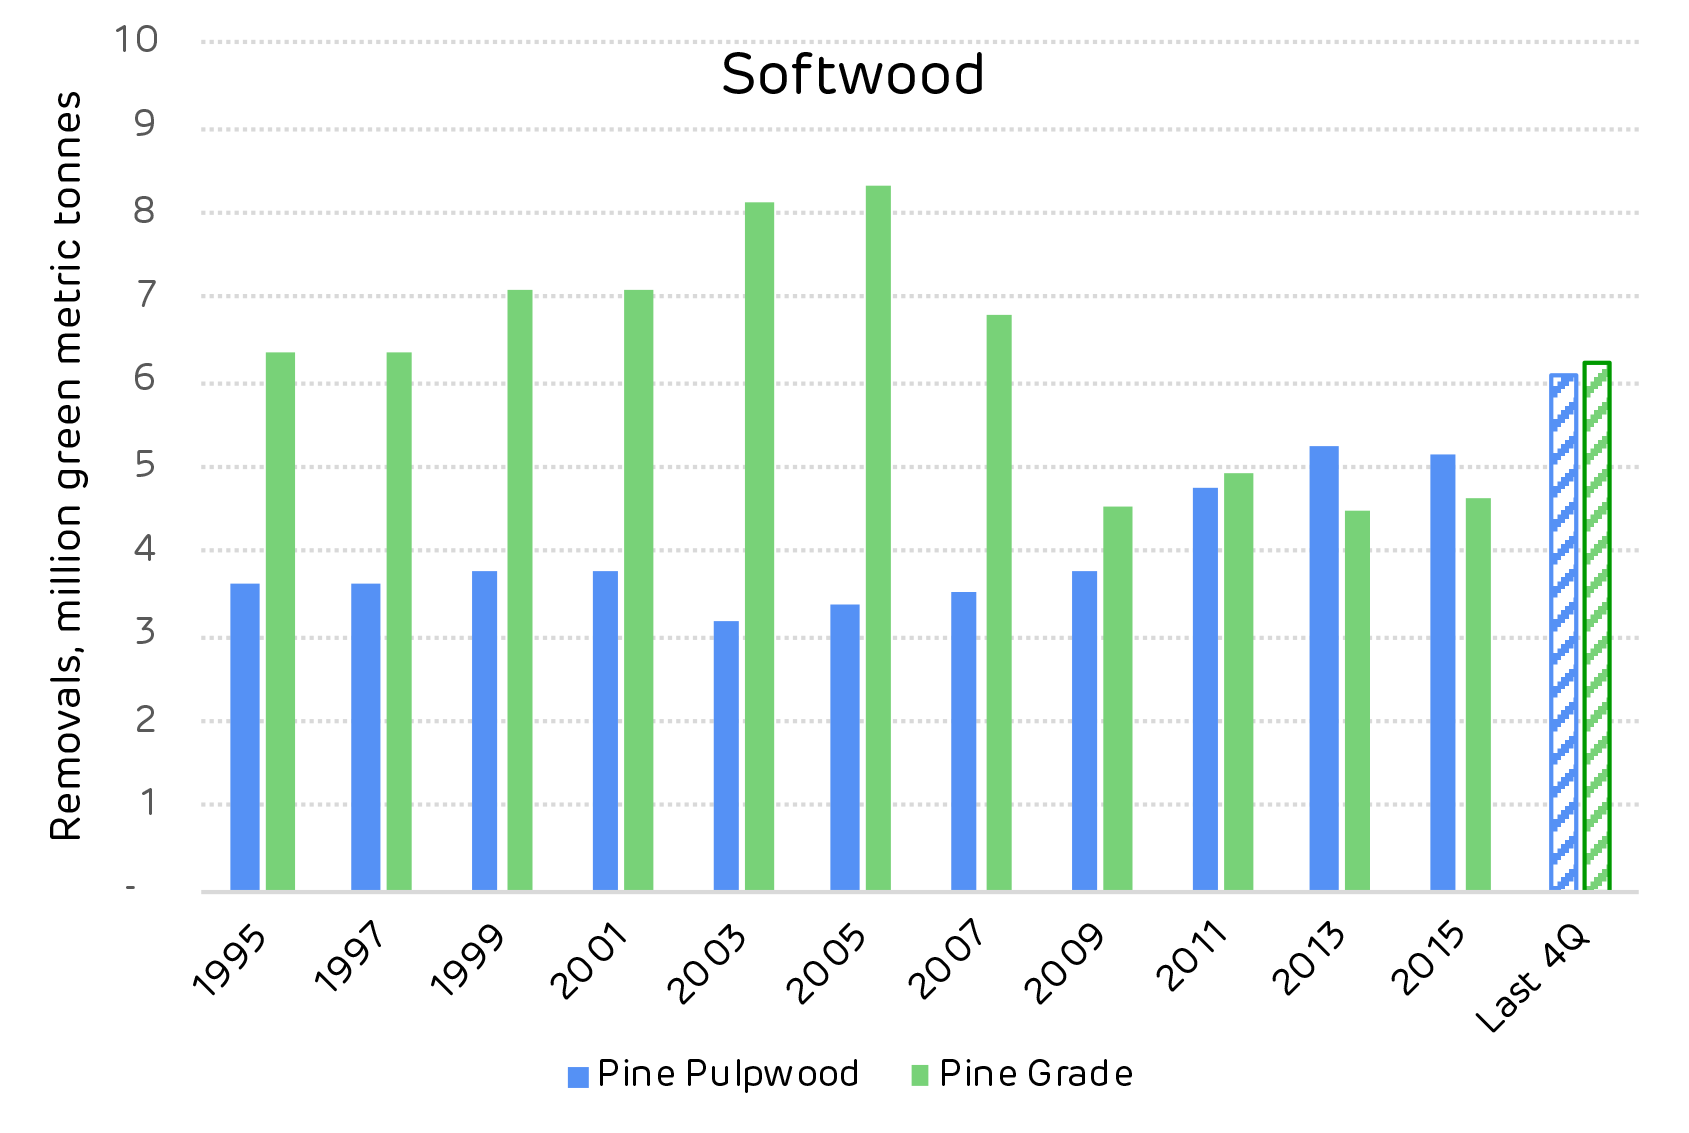
The chart below shows the decline in pine saw-timber demand in the catchment area following the financial crisis in 2008. It also shows the recent increase in pulpwood demand driven by the new pellet mill markets that have supplemented the declining p&p mills.
-

- Historic pine roundwood removals in Morehouse catchment; click to view/download.
-
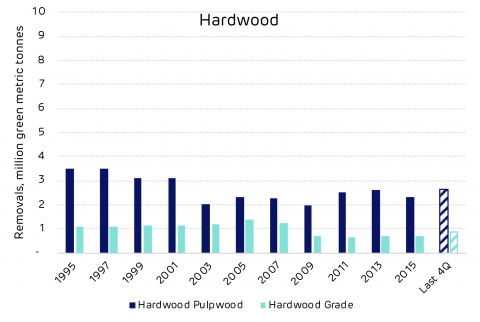
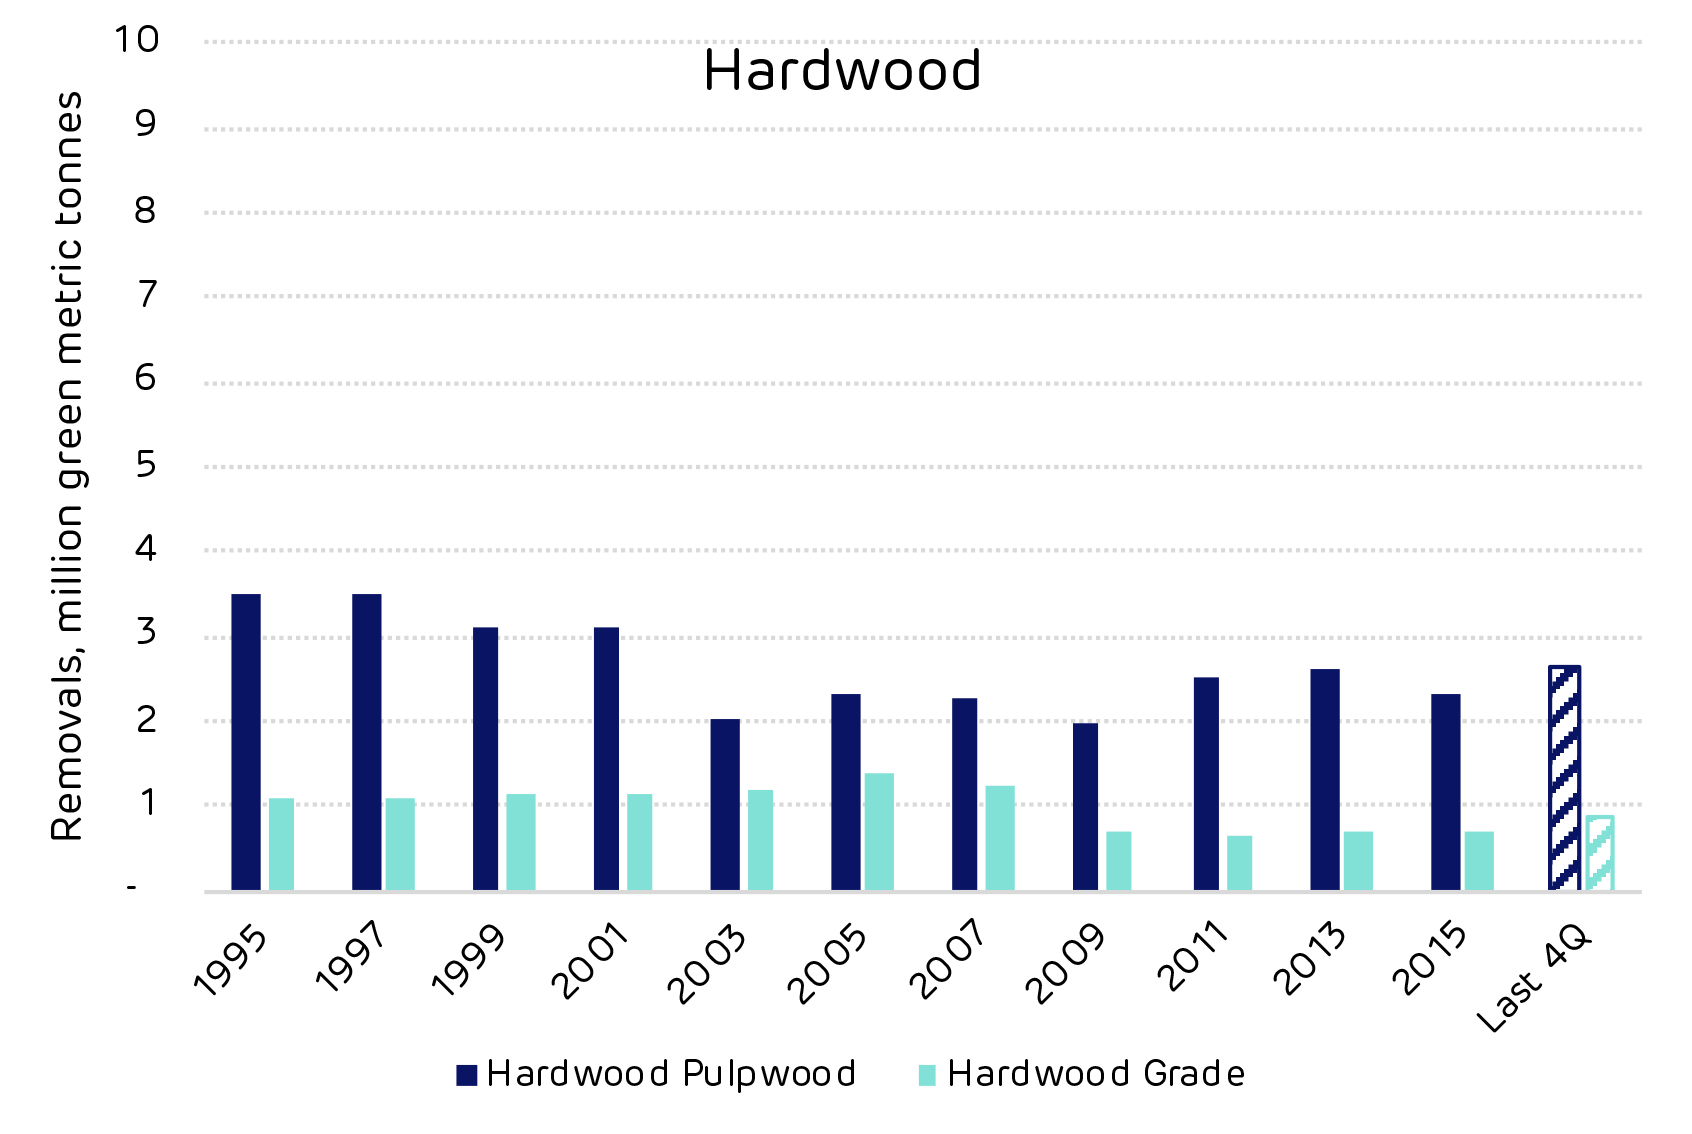
- Historic hardwood roundwood removals in Morehouse catchment; click to view/download.
Sawmills are a vital component of the forest industry around Morehouse, with most private owners seeking to maximise revenue through saw-timber production from pine forests.
As detailed in the table below, there are 70 markets for higher value timber products around this catchment area. These mills also need an off-taker for their residues and the pellet mills can provide a valuable market for this material, increasing the viability of the saw-timber market.
Operating grade-using facilities near Morehouse timber market
| Type | Number of Mills | Capacity | Capacity Units | Hardwood Roundwood At Mill From Market | Softwood Roundwood At Mill From Market | ||
|---|---|---|---|---|---|---|---|
| Consumption, million green metric tonnes | |||||||
| Lumber | 68 | 10538.8235294 | M m³ | 1.73719432055 | 0.886046230426 | 13.0674555233 | 5.69986977638 |
| Plywood/Veneer | 2 | 904 | M m³ | 0 | 0 | 0.961743872536 | 0.506109617373 |
| Total | 70 | 1.73719432055 | 0.886046230426 | 14.0291993958 | 6.20597939376 | ||
Pulp and paper mills dominate the low grade roundwood market for both hardwood and softwood. The pellet mill market is small with just 3 mills and therefore does not influence forest management decisions or macro trends in the catchment area. However, demand for wood pellet feedstock exceeds 1.5 million tonnes p.a. and this can provide a valuable market for thinnings and sawmill residues. A healthy forest landscape requires a combination of diverse markets co-existing to utilise the full range of forest products.
Operating pulpwood-using facilities near Morehouse timber market
| Type | Number of Mills | Capacity | Capacity Units | Hardwood Roundwood At Mill From Market | Softwood Roundwood At Mill From Market | ||
|---|---|---|---|---|---|---|---|
| Consumption, million green metric tons | |||||||
| Pulp/Paper | 11 | 7634.86896 | M metric tons | 3.48982692674 | 1.19257097009 | 7.55728705037 | 1.66598821268 |
| OSB/Panel | 6 | 2412.55 | M m³ | 0 | 0 | 2.56732539862 | 1.19890681942 |
| Chips | 17 | 8395.08999 | M metric tons | 2.93890972211 | 1.4648442136 | 5.28760715119 | 2.18745126814 |
| Pellets | 3 | 1573.965975 | M metric tons | 0 | 0 | 2.07821985845 | 1.01128896402 |
| Total | 34 | 6.42873664886 | 2.65741518369 | 17.4904394586 | 6.06363526426 | ||
In its analysis, Forisk Consulting considered the impact that the new pellet mills including Morehouse BioEnergy have had on the significant trends in the local forest industry. The tables below summarise the Forisk view on the key issues. In its opinion, the Morehouse plant has had no negative impact.
Bioenergy impacts on markets and forest supplies in the Morehouse market
| Activity | Is there evidence that bioenergy demand has caused the following? | Explanation |
|---|---|---|
| Deforestation | No | |
| Change in forest management practice | No | |
| Diversion from other markets | Possibly | Bioenergy plants compete with pulp/paper and OSB mills for pulpwood and residual feedstocks. There is no evidence that these facilities reduced production as a result of bioenergy markets, however. |
| Increase in wood price | No | There is no evidence that bioenergy demand increased stumpage prices in the market. |
| Reduction in growing stocking timber | No | |
| Reduction in sequestration of carbon / growth rate | No | |
| Increasing harvesting above the sustainable yield | No |
Bioenergy impacts on forests markets in the Morehouse market
| Forest metric | Bioenergy impact |
|---|---|
| Growing Stock | Neutral |
| Growth Rates | Neutral |
| Forest Area | Neutral |
| Wood Prices | Neutral |
| Markets for Solid Wood | Neutral to Positive* |
| *Access to viable residual markets benefits users of solid wood (i.e. lumber producers). |