


RNS Number : 1562E
Drax Group PLC
THIS ANNOUNCEMENT CONTAINS INSIDE INFORMATION
Highlights
- A unique portfolio of pumped storage, hydro and gas-fired generation assets
- Compelling strategic rationale
- Growing system support opportunity for the UK energy system
- Significant expansion of Drax’s flexible, low-carbon and renewable generation model
- Diversified generation capacity – multi-site, multi-technology
- Opportunities in trading and operations
- Strong financial investment case
- High quality earnings
- Expected returns significantly ahead of Weighted Average Cost of Capital (WACC)
- Expected EBITDA(1) of £90-110 million in 2019
- Debt facility agreed, net debt/EBITDA expected to be around 2x by the end of 2019
- Supportive of credit rating and reduced risk profile for Drax
- Strengthens ability to pay a growing and sustainable dividend

Will Gardiner, CEO, Drax Group
Commenting on today’s announcement Will Gardiner, Chief Executive Officer of Drax Group, said:
“I am excited by the opportunity to acquire this unique and complementary portfolio of flexible, low-carbon and renewable generation assets. It’s a critical time in the UK power sector. As the system transitions towards renewable technologies, the demand for flexible, secure energy sources is set to grow. We believe there is a compelling logic in our move to add further flexible sources of power to our offering, accelerating our strategic vision to deliver a lower-carbon, lower-cost energy future for the UK.
“This acquisition makes great financial and strategic sense, delivering material value to our shareholders through long-term earnings and attractive returns.
“We are combining our existing operational expertise with the specialist technical skills of our new colleagues and I am looking forward to what we can achieve together.”
A flexible, low-carbon and renewable portfolio
The Portfolio consists of Cruachan pumped storage hydro (440MW), run-of-river hydro locations at Galloway and Lanark (126MW), four CCGT(2) stations: Damhead Creek (805MW), Rye House (715MW), Shoreham (420MW) and Blackburn Mill (60MW), and a biomass-from-waste facility (Daldowie).
Attractive high quality earnings and returns
The Portfolio is expected, based on recent power and commodity prices, to generate EBITDA in a range of £90-110 million, from gross profits of £155 million to £175 million, of which around two thirds is expected to come from non-commodity market sources, including system support services, capacity payments, Daldowie and ROCs(3). Pumped storage and hydro activities represent a significant proportion of the earnings associated with the portfolio. Further information is set out in Appendix 2 of this Announcement.
Capital expenditure in 2019 is expected to be in the region of £30-35 million.
For the year ended 31 December 2017, the Portfolio generated EBITDA of £36 million(4). EBITDA in 2019 is expected to be higher due to incremental contracted capacity payments (c.£42 million), no availability restrictions (Cruachan’s access to the UK grid during 2017 was limited by network transformer works) (c.£8 million), a lower level of corporate cost charged to the portfolio (c.£9 million) and revenues from system support services and current power prices. Gross assets as at 31 December 2017 were £419 million(5).
The Acquisition represents an attractive opportunity to create significant value for shareholders and is expected to deliver returns significantly in excess of the Group’s WACC and to be highly accretive to underlying earnings in 2019.
The Acquisition strengthens the Group’s ability to pay a growing and sustainable dividend. Drax remains committed to its capital allocation policy and to its current £50 million share buy-back programme, with £32 million of shares purchased to date.
Financing the Acquisition
Drax has entered into a fully underwritten £725 million secured acquisition bridge facility agreement to finance the Acquisition. Assuming performance in line with current expectations, net debt to EBITDA is expected to fall to Drax’s long-term target of around 2x by the end of 2019.
Drax expects its credit rating agencies to view the Acquisition as contributing to a reduced risk profile for the Group and to reaffirm their ratings.
Conditions for completion
The Acquisition is expected to complete on 31 December 2018 and is conditional upon the approval of the Acquisition by Drax’s shareholders and clearance by UK Competition and Markets Authority (the “CMA”). A summary of the terms of the Acquisition agreement (the “Acquisition Agreement”) is set out in Appendix 1 to this announcement.
Drax trading and operational performance
Since publishing its half year results on 24 July 2018 Drax has commenced operation of a fourth biomass unit at Drax Power Station, which is performing in line with plan, and availability across biomass units has been good.
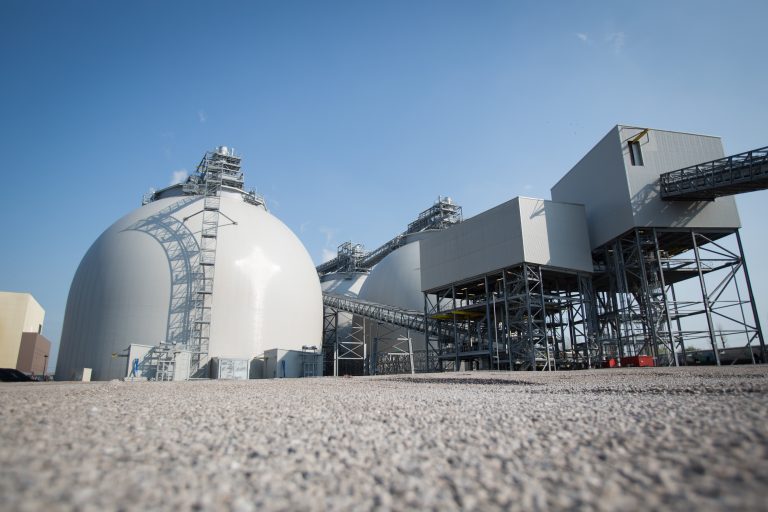
Biomass storage domes at Drax Power Station
Taking these factors into account, alongside a strong 2018 hedged position and assuming good operational availability for the remainder of the year, Drax’s EBITDA expectations for the full year remain unchanged, with net debt to EBITDA now expected to be around 1.5x for the full year, excluding the impact of the Acquisition.
Biomass generation is now fully contracted for 2019.
Contracted power sales at 30 September 2018
| 2018 | 2019 | 2020 | |
|---|---|---|---|
| Power sales (TWh) comprising: | 18.6 | 11.5 | 5.7 |
| TWh including expected CfD sales | 18.6 | 15.6 | 11.2 |
| – Fixed price power sales (TWh) | 18.6 | 11.0 | 5.1 |
| At an average achieved price (per MWh) | at £46.8 | at £50.4 | at £48.3 |
| – Gas hedges (TWh) | - | 0.5 | 0.6 |
| At an achieved price per therm | - | 43.5p | 47.4p |
Drax intends to hedge up to 1TWh of the commodity exposures in the Portfolio ahead of completion in line with the Group’s existing hedging strategy.
Other matters
In light of the Acquisition and the expected timing of the general meeting to approve it, Drax will postpone the planned Capital Markets Day on 13 November 2018.
Drax expects to announce its full year results for the year ending 31 December 2018 on 26 February 2019.
Enquiries:
Drax Investor Relations: Mark Strafford
+44 (0) 1757 612 491
+44 (0) 7730 763949
Media:
Drax External Communications:
Matt Willey
+44 (0) 7711 376087
Ali Lewis
+44 (0) 77126 70888
J.P. Morgan Cazenove (Financial Adviser and Joint Corporate Broker):
+44 (0) 207 742 6000
Robert Constant
Jeanette Smits van Oyen
Carsten Woehrn
Royal Bank of Canada (Joint Corporate Broker):
+44 (0) 20 7653 4000
James Agnew
Jonathan Hardy
Acquisition presentation meeting and webcast arrangements
Management will host a presentation for analysts and media at 9:00am (UK Time), Tuesday 16 October 2018, at FTI Consulting, 200 Aldersgate, Aldersgate Street, London EC1A 4HD.
Would anyone wishing to attend please confirm by e-mailing [email protected] or calling Christopher Laing at FTI Consulting on +44 (0) 20 3727 1355 / 07809 234 126.
The meeting can also be accessed remotely via a live webcast, as detailed below. After the meeting, the webcast will be made available and access details of this recording are also set out below.
A copy of the presentation will be made available from 9am (UK time) on Tuesday 16 October 2018 for download at: www.drax.com>>investors>>results-reports-agm>> #investor-relations-presentations or use the link below.
| Event Title: | Drax Group plc: Acquisition of flexible, low-carbon and renewable UK power generation from Iberdrola |
| Event Date: | Tuesday 16 October 2018 |
| Event Time | 9:00am (UK time) |
| Webcast Live Event Link | https://www.drax.com/investors/16-oct-2018-webcast |
| 020 3059 5868 (UK) | |
| +44 20 3059 5868 (from all other locations) | |
| Start Date: | Tuesday 16 October 2018 |
| Delete Date: | Monday 14 October 2019 |
| Archive Link: | https://www.drax.com/investors/16-oct-2018-webcast |
For further information please contact Christopher Laing on +44 (0) 20 3727 1355 / 07809 234 126.
Website: www.drax.com
Acquisition of the Portfolio from Iberdrola
Drax Smart Generation Holdco Limited (“Drax Smart Generation”), a wholly owned subsidiary of Drax, has entered into the Acquisition Agreement with Scottish Power Generation Holdings Limited (the “Seller”), a wholly-owned subsidiary of Iberdrola S.A., for the acquisition of ScottishPower Generation Limited (“SPGEN”), for £702 million in cash.
Strong asset base
The Portfolio principally consists of 2.6GW of assets which are highly complementary to Drax’s existing generation portfolio and play an important role in the UK energy system. The assets include:
Cruachan Pumped Storage Hydro
440MW of large-scale storage and flexible low-carbon generation situated in Argyll and Bute, Scotland.
Cruachan provides a wide range of system support services to the UK energy market, in addition to providing merchant power generation. Cruachan has £35 million of contracted capacity payments for the period 2019 to 2022.
Cruachan, which provides over 35% of the UK’s pumped storage by volume, can provide long-duration storage with the ability to achieve full load in 30 seconds, which it can maintain for over 16 hours, making it a strategically important asset remunerated by a broad range of non-commodity based revenues.
Galloway and Lanark Run-of-River Hydro
126MW of stable and reliable renewable generation situated in South-west Scotland.
Both locations benefit from index-linked ROC revenues extending to 2027 and Galloway, in addition to renewable power generation, operates a reservoir and dam system providing storage capabilities and opportunities for peaking generation and system support services. It also has £4 million of contracted capacity payments for the period 2019 to 2022.
Combined Cycle Gas Generation (CCGT)
1,940MW of capacity at Damhead Creek (805MW), Rye House (715MW) and Shoreham (420MW) all strategically located in South-east England.
These assets provide baseload and/or peak power generation in addition to other system support services and benefit from attractive grid access income associated with their location. The three plants have contracted capacity payments of £127 million for the period 2019 to 2022.
Damhead Creek also benefits from an attractive option for the development of a second CCGT asset, Damhead Creek II, which provides additional gas generation optionality alongside Drax’s existing coal-to-gas repowering and OCGT(6) projects. All options could be developed subject to an appropriate level of support. Damhead Creek II is eligible for the 2019 capacity market auction along with two of Drax’s existing OCGT projects.
Other smaller sites
The portfolio also includes a small CCGT in Blackburn (60MW) and a 50K tonne biomass-from-waste facility in Daldowie, which benefits from a firm offtake contract agreement with Scottish Water until 2026.
Benefits of the Acquisition
A leading provider of flexible, low-carbon and renewable generation in the UK
The UK has a target to reduce carbon emissions by 80% by 2050. The transition to a low-carbon economy requires decarbonisation of heating, transport and generation. This will in turn require additional low-carbon sources of generation to be developed in the UK. As much as 85%(7) of future generation could come from renewables – predominantly wind and solar. This will lead, at times, to high levels of power price volatility and increasing demand for system support services. Managing an energy system with these characteristics will only be possible if it is supported by the right mix of flexible assets to manage volatility, balance the system and provide crucial non-generation services which a stable energy system requires.
The Acquisition is closely aligned with this structural need and the operation of Drax’s existing biomass and gas options which provide the flexibility required to enable higher levels of intermittent renewable generation.
The Acquisition is in line with these system needs and when combined with Drax’s existing flexible, biomass generation and gas options offers the Group increased exposure to the growing need for system support and power price volatility.
Increased earnings potential aligned with generation strategy and UK energy needs
The Acquisition is closely aligned with this structural need and the operation of Drax’s existing biomass and gas options which provide the flexibility required to enable higher levels of intermittent renewable generation.
The Acquisition is in line with these system needs and when combined with Drax’s existing flexible, biomass generation and gas options offers the Group increased exposure to the growing need for system support and power price volatility.
High quality earnings
Two thirds of the gross profits of the Portfolio is expected to come from non-commodity market sources, including system support services, capacity payments, Daldowie and ROCs, in addition to power generation activities. Due to the expected growing demand for these assets and the contract-based nature of many of these services Drax expects to improve long-term earnings visibility through structured non-commodity earnings streams, whilst retaining significant opportunity to benefit from power price volatility.
When combined with renewable earnings and system support from existing biomass generation, the Acquisition is expected to lead to an increase in the quality of earnings.
Diversified generation and portfolio benefits
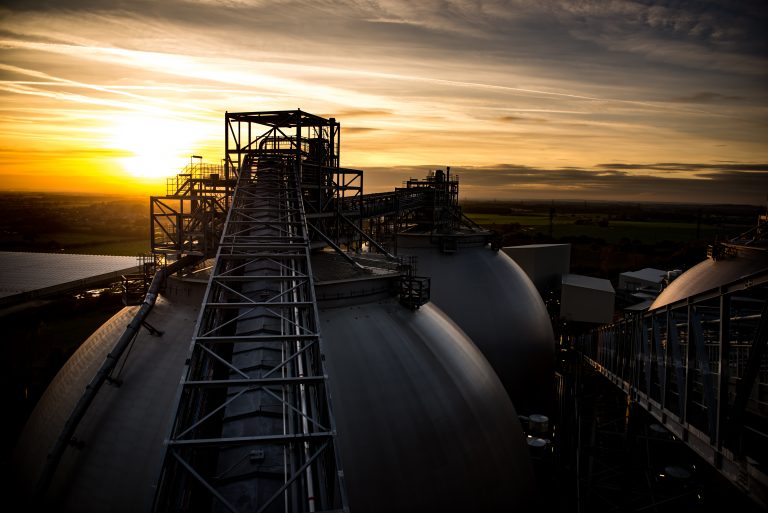
Wood pellet storage domes at Drax Power Station, Selby, North Yorkshire
The Acquisition accelerates Drax’s development from a single-site generation business into a multi-site, multi-technology operator.
With the acquisition of this portfolio, a fall in gas prices could be mitigated by an increase in gas-fired generation reflecting the relative dispatch economics of the different technologies.
Drax expects to benefit from the management of generation across a broader asset base, leveraging the Group’s expertise in the operation, trading and optimisation of large rotating mass generation.
Drax believes that the team operating the Portfolio has a strong engineering culture which is closely aligned with the Drax model and will enhance the Group’s strong capabilities across engineering disciplines.
Around 260 operational roles will transfer to Drax as part of the Acquisition, complementing and reinforcing Drax’s existing engineering and operational capabilities.
Financing and capital structure
Drax has entered into a fully underwritten £725 million secured acquisition bridge facility to finance the Acquisition, with a term of 12 months from the first date of utilisation of the facility (with a seven-month extension option) and interest payable at a rate of LIBOR plus the applicable margin (the “Acquisition Facility Agreement”). The facility is competitively priced and below Drax’s current cost of debt.
Drax will consider its options for its long-term financing strategy in 2019.
Assuming performance in line with current expectations, net debt to EBITDA is expected to return to Drax’s long-term target of around 2x by the end of 2019.
Drax expects credit rating agencies to view the Acquisition as supportive of the rating and contributing to a reduced risk profile for the Group.
Process and integration plan
Drax is progressing a detailed integration plan to combine the Acquisition as part of the existing Power Generation business.
The transaction is subject to shareholder approval. A combined Shareholder Circular and notice of General Meeting will be posted as soon as practicable.
The transaction is expected to complete on 31 December 2018.
Notes:
(1) EBITDA is defined as earnings before interest, tax, depreciation, amortisation and material one-off items that do not reflect the underlying trading performance of the business. 2019 EBITDA is stated before any allocation of Group overheads.
(2) Combined Cycle Gas Turbine.
(3) Renewable Obligation Certificates.
(4) 2017 EBITDA is unaudited and based on the audited financial statements of Scottish Power Generation Limited and SMW Limited, adjusted to exclude results of assets that do not form part of the Portfolio and restated in accordance with Drax accounting policies.
(5) On an unaudited historic cost basis, inclusive of an historic write down and other changes arising from the application of Drax’s accounting policies, and incorporating intercompany debtors which will be replaced by Drax going forward.
(6) Open Cycle Gas Turbines.
(7) Intergovernmental Panel on Climate Change. In a 1.5c pathway renewables are projected to be 70-85% of global electricity in 2050.
IMPORTANT NOTICE
The contents of this announcement have been prepared by and are the sole responsibility of Drax Group plc (the “Company”).
J.P. Morgan Limited (which conducts its UK investment banking business as J.P. Morgan Cazenove) (“J.P. Morgan Cazenove”) and RBC Europe Limited (“RBC”), which are both authorised by the Prudential Regulation Authority (the “PRA”) and regulated in the United Kingdom by the FCA and the PRA, are each acting exclusively for the Company and for no one else in connection with the Acquisition, the content of this announcement and other matters described in this announcement and will not regard any other person as their respective clients in relation to the Acquisition, the content of this announcement and other matters described in this announcement and will not be responsible to anyone other than the Company for providing the protections afforded to their respective clients nor for providing advice to any other person in relation to the Acquisition, the content of this announcement or any other matters referred to in this announcement.
J.P. Morgan Cazenove, RBC and their respective affiliates do not accept any responsibility or liability whatsoever and make no representations or warranties, express or implied, in relation to the contents of this announcement, including its accuracy, fairness, sufficient, completeness or verification or for any other statement made or purported to be made by it, or on its behalf, in connection with the Acquisition and nothing in this announcement is, or shall be relied upon as, a promise or representation in this respect, whether as to the past or the future. Each of J.P. Morgan Cazenove, RBC and their respective affiliates accordingly disclaims to the fullest extent permitted by law all and any responsibility and liability whether arising in tort, contract or otherwise which it might otherwise be found to have in respect of this announcement or any such statement.
Certain statements in this announcement may be forward-looking. Any forward-looking statements reflect the Company’s current view with respect to future events and are subject to risks relating to future events and other risks, uncertainties and assumptions relating to the Company and its group’s, the Portfolio’s and/or, following completion, the enlarged group’s business, results of operations, financial position, liquidity, prospects, growth, strategies, integration of the business organisations and achievement of anticipated combination benefits in a timely manner. Forward-looking statements speak only as of the date they are made. Although the Company believes that the expectations reflected in these forward looking statements are reasonable, it can give no assurance or guarantee that these expectations will prove to have been correct. Because these statements involve risks and uncertainties, actual results may differ materially from those expressed or implied by these forward looking statements.
Each of the Company, J.P. Morgan Cazenove, RBC and their respective affiliates expressly disclaim any obligation or undertaking to supplement, amend, update, review or revise any of the forward looking statements made herein, except as required by law.
You are advised to read this announcement and any circular (if and when published) in their entirety for a further discussion of the factors that could affect the Company and its group, the Portfolio and/or, following completion, the enlarged group’s future performance. In light of these risks, uncertainties and assumptions, the events described in the forward-looking statements in this announcement may not occur.
Neither the content of the Company’s website (or any other website) nor any website accessible by hyperlinks on the Company’s website (or any other website) is incorporated in, or forms part of, this announcement.
Appendix 1
Principal Terms of the Acquisition
The following is a summary of the principal terms of the Acquisition Agreement.
-
Acquisition Agreement
Parties and consideration
The Acquisition Agreement was entered into on 16 October 2018 between Drax Smart Generation and the Seller. Pursuant to the Acquisition Agreement, the Seller has agreed to sell, and Drax Smart Generation has agreed to acquire, the whole of the issued share capital of SPGEN for £702 million, subject to certain customary adjustments in respect of cash, debt and working capital.
Drax Group Holdings Limited has agreed to guarantee the payment obligations of Drax Smart Generation under the Acquisition Agreement. Scottish Power UK plc has agreed to guarantee the payment obligations of the Seller under the Acquisition Agreement.
Conditions to Completion
The Acquisition is conditional on:
- the approval of the Acquisition by Drax shareholders, which is required as the Acquisition constitutes a Class 1 transaction under the Listing Rules (the “Shareholder Approval Condition”); and
- the CMA having indicated that it has no further questions at that stage in response to pre-Completion engagement by Drax or the CMA having provided a decision that the Acquisition will not be subject to a reference under the UK merger control regime.
Completion is currently expected to occur on 31 December 2018 assuming that the conditions are satisfied by that date.
Termination for material reduction in available generation capacity
Drax Smart Generation has the right to terminate the Acquisition Agreement upon the occurrence of a material reduction in available generation capacity at any of the Cruachan, Galloway and Lanark or Damhead Creek facilities which subsists, or is reasonably likely to subsist, for a continuous period of three months. The right of Drax Smart Generation to terminate in these circumstances is subject to the Seller’s right to defer Completion if the relevant material reduction in available generation capacity can be resolved by end of the month following the anticipated date of Completion.
Break fee
A break fee of £14.6 million (equal to 1% of Drax’s market capitalisation at close of business on the day before announcement) is payable if the Shareholder Approval Condition is not met, save where this is as a result of a material reduction in available generation capacity as described above.
Pre-completion covenants
The Seller has given certain customary covenants in relation to the period between signing of the Acquisition Agreement and completion, including to carry on the SPGEN business in the ordinary and usual course. The Seller will carry out certain reorganisation steps prior to completion.
Pension liabilities
Drax Smart Generation has agreed to assume the accrued defined benefit pension liabilities associated with the employees of the SPGEN group as at the date of signing the Acquisition Agreement. Following Completion, the SPGEN group will continue to participate in the Seller’s group defined benefit pension scheme, known as the ScottishPower Pension Scheme (“SPPS”) for an interim period of 12 months unless agreed otherwise (the “Interim Period”) while a new pension scheme is set up by the SPGEN group for the benefit of its employees (the “New Scheme”).
At the end of the Interim Period, the SPPS trustees will be requested to transfer from the SPPS to the New Scheme an amount of liabilities (and corresponding share of assets) agreed between the Seller and Drax Smart Generation (or failing agreement, an amount determined by an independent actuary) in respect of the past service liabilities relating to the SPGEN group employees. If the amount of assets transferred to the New Scheme does not match the amount agreed (or independently determined), there will be a true-up between the Seller and Drax Smart Generation.
If the SPPS trustees do not make any transfer to the New Scheme within the period of 18 months following the Interim Period (unless this was caused by a breach of the Acquisition Agreement by the Seller), Drax Smart Generation has agreed to pay £16 million (plus base rate interest) to the Seller as compensation for the SPPS liabilities not taken on by the New Scheme.
Seller’s warranties, indemnities and tax covenant
The Seller has provided customary warranties in the Acquisition Agreement. The Seller also has provided Drax Smart Generation with indemnities in respect of certain specific matters, including for any losses associated with the reorganisation referred to above. A customary tax covenant is also provided in the Acquisition Agreement.
-
Transitional Services Agreement
The Seller and SPGEN will enter into a transitional services agreement effective at Completion. The specific nature, terms and charges relating to the services to be provided will be agreed between the Seller and SPGEN prior to Completion. The Seller will also provide assistance in relation to the extraction and separation of the SPGEN group from the systems of the Seller and integration of the SPGEN group onto the systems of the Drax Group.
Appendix 2
Profit Forecast
Profit forecast for the Portfolio for the year ending 31 December 2019 including bases and assumptions.
The Portfolio is expected, based on recent power and commodity prices, to generate EBITDA in a range of £90-110 million (“Profit Forecast”), and gross profits of £155 million to £175 million, of which around two thirds is expected to come from non-commodity market sources, including system support services, capacity payments, Daldowie and ROCs. Pumped storage and hydro activities represent a significant proportion of the earnings associated with the portfolio.
For the purpose of the Profit Forecast, EBITDA is stated before any allocation of Group overheads (as these will be an allocation of the existing Drax Group cost base which is not expected to increase as a result of the acquisition of the Portfolio).
Basis of preparation
The Profit Forecast has been compiled on the basis of the assumptions stated below, and on the basis of the accounting policies of the Drax Group adopted in its financial statements for the year ended 31 December 2017. Subsequent accounting policy changes include the application of IFRS15 and IFRS9 which are not initially expected to change the EBITDA results of the Portfolio. It also does not reflect the impact of IFRS16 which would apply in respect of the 2019 Annual Report and Accounts.
The Profit Forecast has been prepared with reference to:
- Unaudited 2017 financial statements based on the audited financial statements of Scottish Power Generation Limited and SMW Limited, adjusted to exclude results of assets that do not form part of the Portfolio and restated in accordance with Drax accounting policies
- The audited financial statements of the entities forming the Portfolio for the year ending 31 December 2017
- The unaudited management accounts of the Portfolio for the nine months ending 30 September 2018
- And on the basis of the projected financial performance of the Portfolio for the year ending 31 December 2019
The Profit Forecast is a best estimate of the EBITDA that the Portfolio will generate for a future period of a year in respect of assets and operations that are not yet under the control of Drax. Accordingly the degree of uncertainty relating to the assumptions underpinning the Profit Forecast is inherently greater than would be the case for a profit forecast based on assets and operation under the control of Drax and/or which covered a shorter future period. The Profit Forecast has been prepared as at today and will be updated in the shareholder circular.
The forecast cost base reflects the expectations of the Drax Directors of the operating regime of the Portfolio under Drax’s ownership and the central support it will require.
Principal assumptions
The Profit Forecast has been prepared on the basis of the following principal assumptions:
Assumptions within management’s control
- There is no change in the composition of the Portfolio.
- There is no material change to the manner in which these assets are operated.
- There are no material changes to the existing running costs / operating costs of the Portfolio.
- There will be no material restrictions on running each of the assets in the Portfolio other than those that would be envisaged in the ordinary course.
- No material issues with the migration of services including trading and information technology from Scottish Power to Drax.
- No hedges are transferred as part of the Transaction.
- Transaction costs and one-off costs associated with the Integration are not included.
Assumptions outside of management’s control
- The acquisition of the Portfolio is completed on 31 December 2018.
- There is no material change to existing prevailing UK macroeconomic and political conditions prior to 31 December 2019.
- There are no material changes in market conditions in electricity generating market and no change to the UK energy supply mix.
- There are no material changes in legislation or regulatory requirements (e.g. ROCs, capacity market, grid charges) impacting the operations or accounting policies of the Portfolio.
- There are no changes to recent market prices for clean spark spread, power, carbon and other commodities.
- There is no material change from the historical 10-year average rainfall.
- There are no material adverse events that have a significant impact on the financial performance of any of the acquired assets, including any more unplanned outages than would be expected in the ordinary course.
- Prior to completion, the business will be operated in the ordinary course.
- There are no material issues with the transitional services provided by Scottish Power to Drax pursuant to the TSA, including the migration of such services to Drax.
- There is no material change in the management or control of the Drax group.
END