Author: Alice Roberts

Full year results for the twelve months ended 31 December 2021

RNS Number : 6410C
Drax Group PLC
24 February 2022

Twelve months ended 31 December20212020
Key financial performance measures
Adjusted EBITDA (£ million) (1)(2)398412
Continuing operations378366
Discontinued operations – gas generation2046
Net debt (£ million) (3)1,044776
Adjusted basic EPS (pence) (1)26.529.6
Total dividend (pence per share)18.817.1
Total financial performance measures from continuing operations
Operating profit / (loss) (£ million)197(156)
Profit / (loss) before tax (£ million)122(235)

Will Gardiner, CEO of Drax Group, said:

Drax Group CEO Will Gardiner

Drax Group CEO Will Gardiner

“2021 was a transformational year for Drax as we became the world’s leading sustainable biomass generation and supply company, whilst continuing to invest in delivering positive outcomes for the climate, nature and people.

“Over the past ten years Drax has invested over £2 billion in renewable energy and has plans to invest a further £3 billion this decade, supporting the global transition to a low-carbon economy. Our investment has reduced our emissions from power generation by over 95% and we are the UK’s largest producer of renewable power by output. We are proud to be one of the lowest carbon intensity power generators in Europe – a significant transformation from being the largest coal power station in Western Europe.

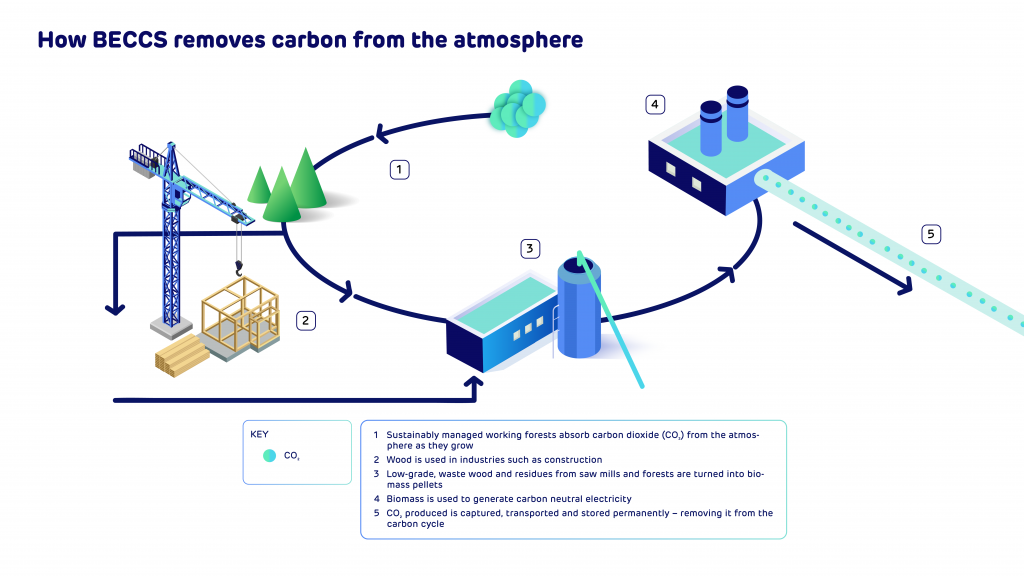
“We have significantly advanced our plans for bioenergy with carbon capture and storage (BECCS) in the UK and globally. By 2030 we aim to deliver 12 million tonnes of negative emissions and lead the world in providing a critical technology which scientists agree is key to delivering the global transition to net zero.”

Financial highlights

  • Adjusted EBITDA £398 million (2020: £412 million)
  • Strong liquidity and balance sheet – £549 million of cash and committed facilities at 31 December 2021
    • Expect to be below 2x net debt to Adjusted EBITDA by the end of 2022
  • Total dividend – 10% increase to 18.8 pence per share (2020: 17.1 pence per share)
    • Proposed final dividend of 11.3 pence per share (2020: 10.3 pence per share)

Strategic highlights

  • Acquisition of Pinnacle Renewable Energy Inc. for C$385 million (£222 million) (enterprise value of C$796 million)
  • Sale of Combined Cycle Gas Turbine (CCGT) generation assets for £186 million
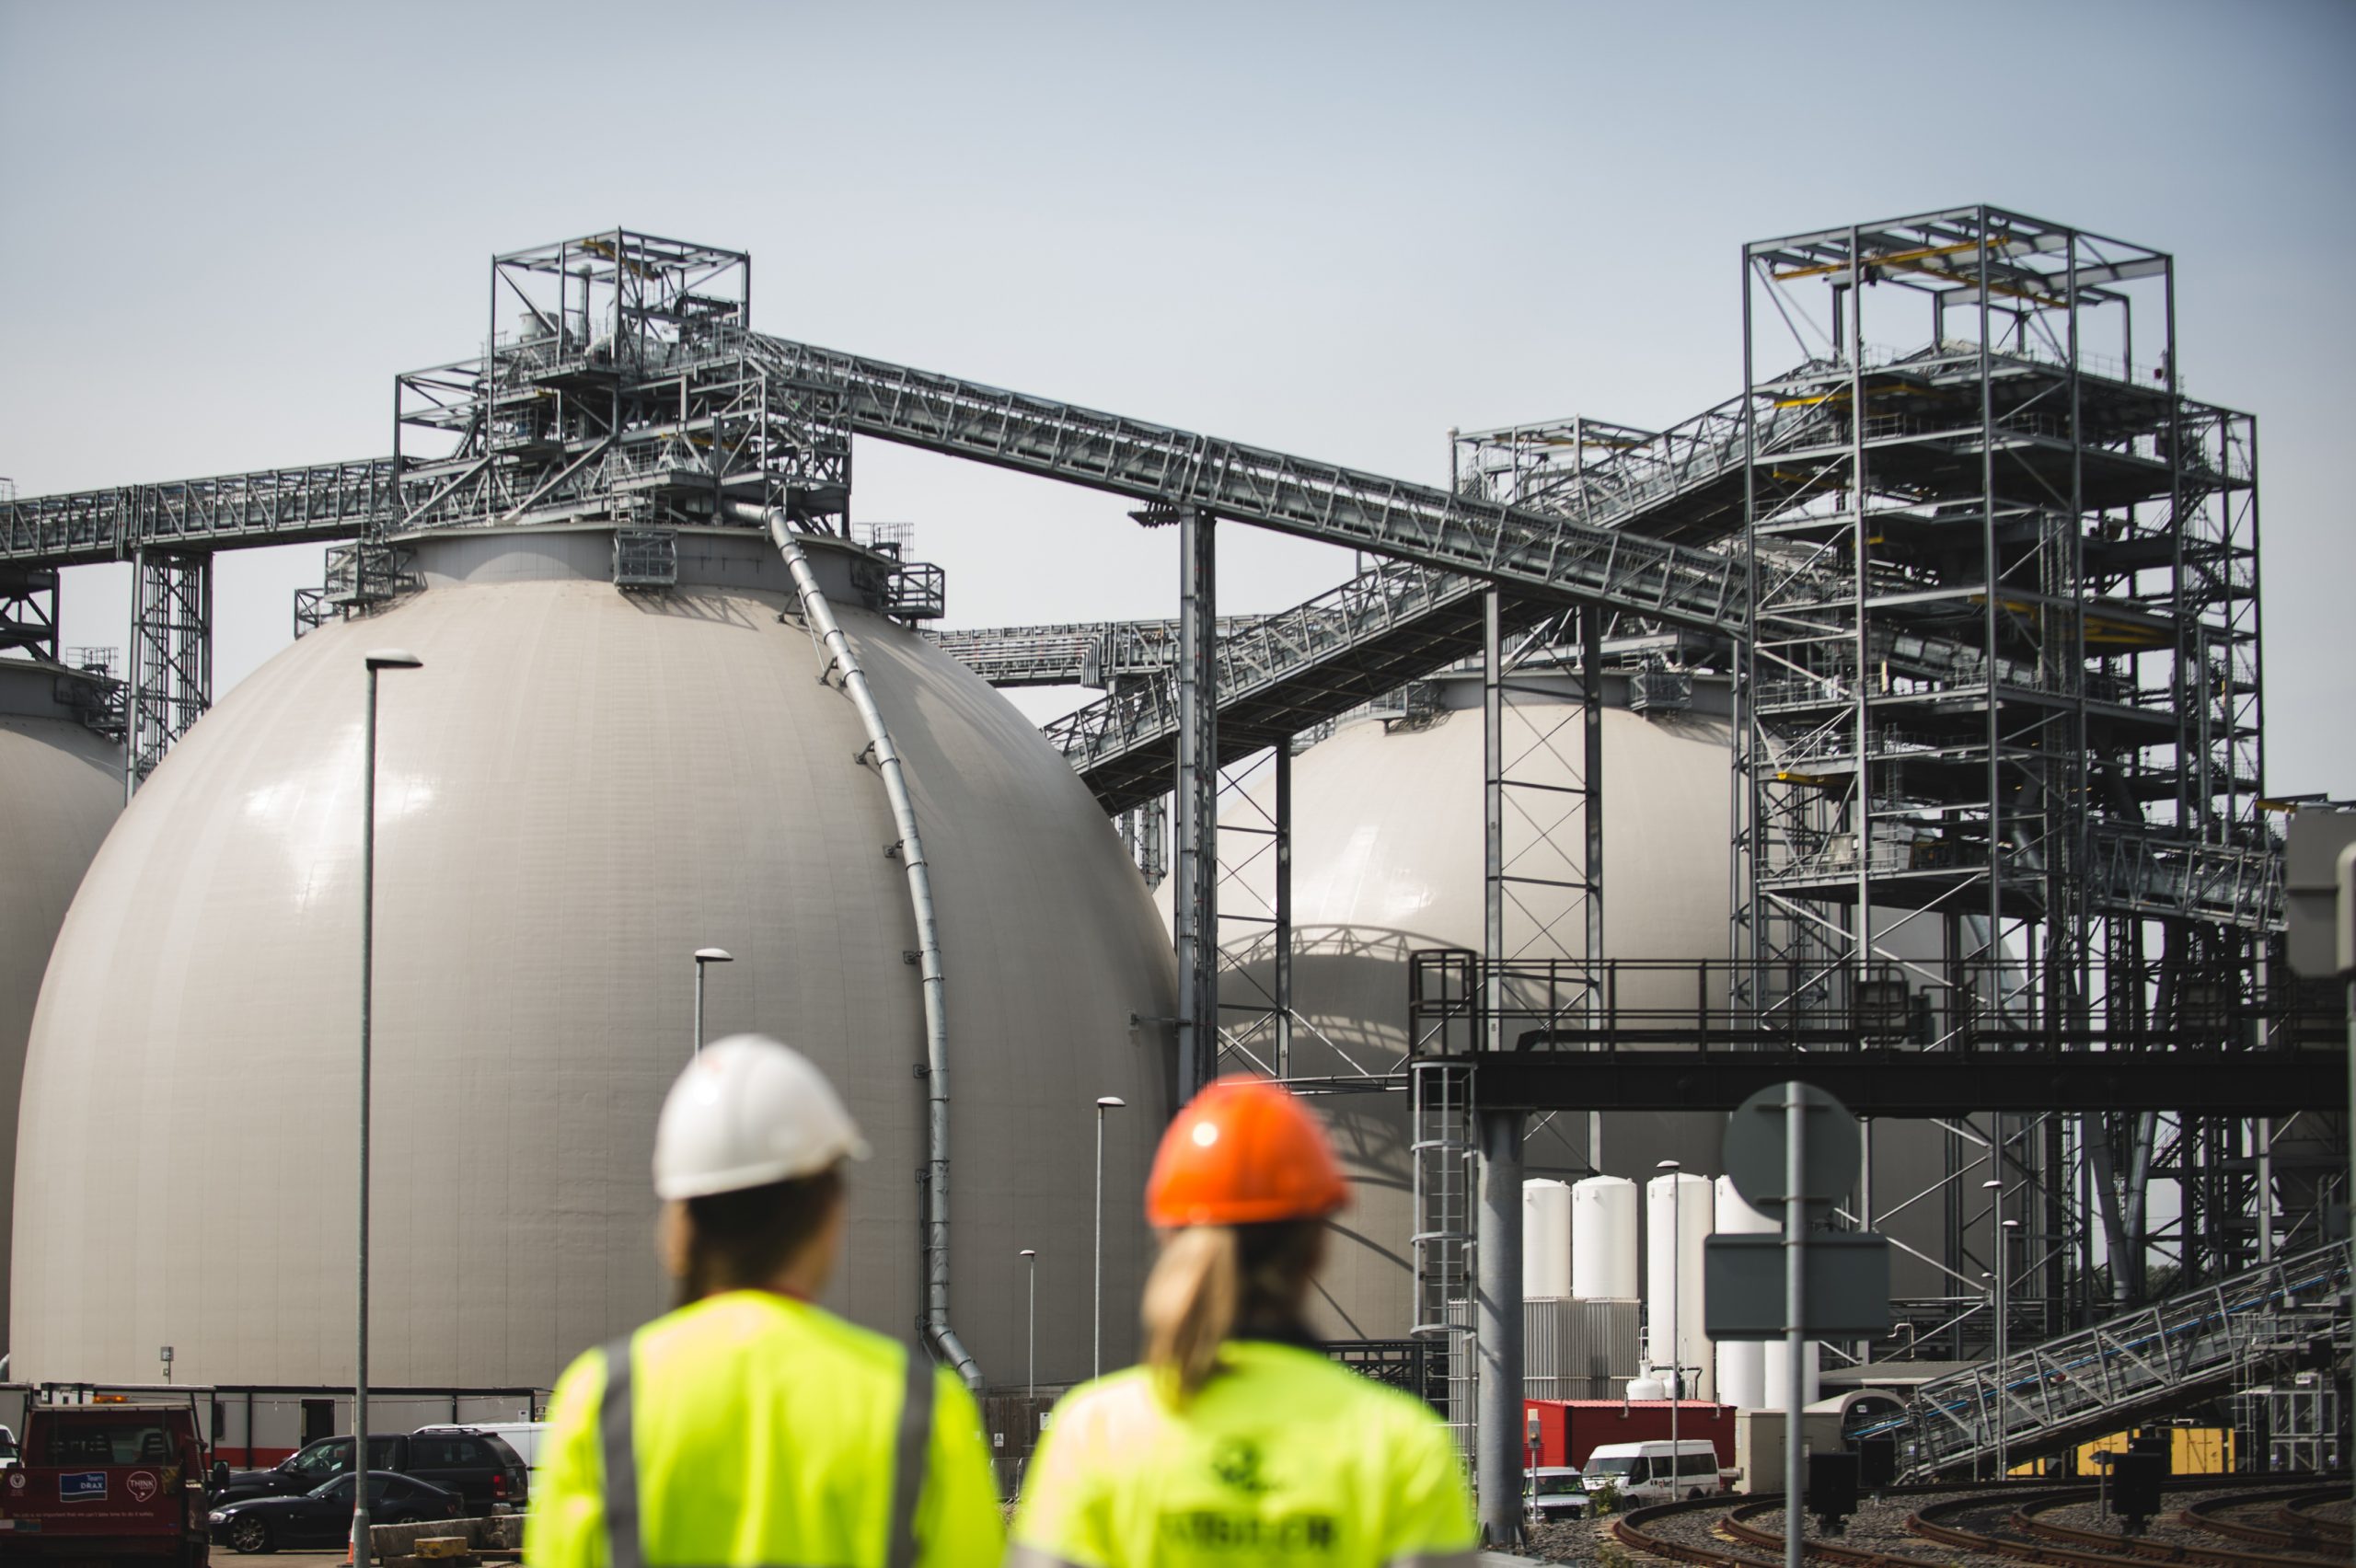
  • Development of the world’s leading sustainable biomass generation and supply company
    • Supply – 17 pellet plants and developments across three major fibre baskets, production capacity of c.5Mt pa
    • 22Mt (c.$4.5 billion) of long-term contracted sales to high-quality customers in Asia and Europe
    • 14Mt of own-use sales through 2026
    • Generation – 2.6GW of biomass generation – UK’s largest source of renewable power by output
  • Development of BECCS in UK
    • East Coast Cluster – selected as one of two priority carbon capture and storage clusters
    • Government – BECCS included in Net Zero Strategy and Interim Bioenergy Strategy
    • Drax Power Station – planning application started, technology partner selected and FEED study commenced

Strategic outlook – growth plans aligned with global low-carbon growth

  • To be a global leader in sustainable biomass
    • Targeting 8Mt pa of production capacity and 4Mt pa of biomass sales to third parties by 2030
  • To be a global leader in negative emissions
    • Targeting 12Mt pa of negative CO2 – UK and international BECCS
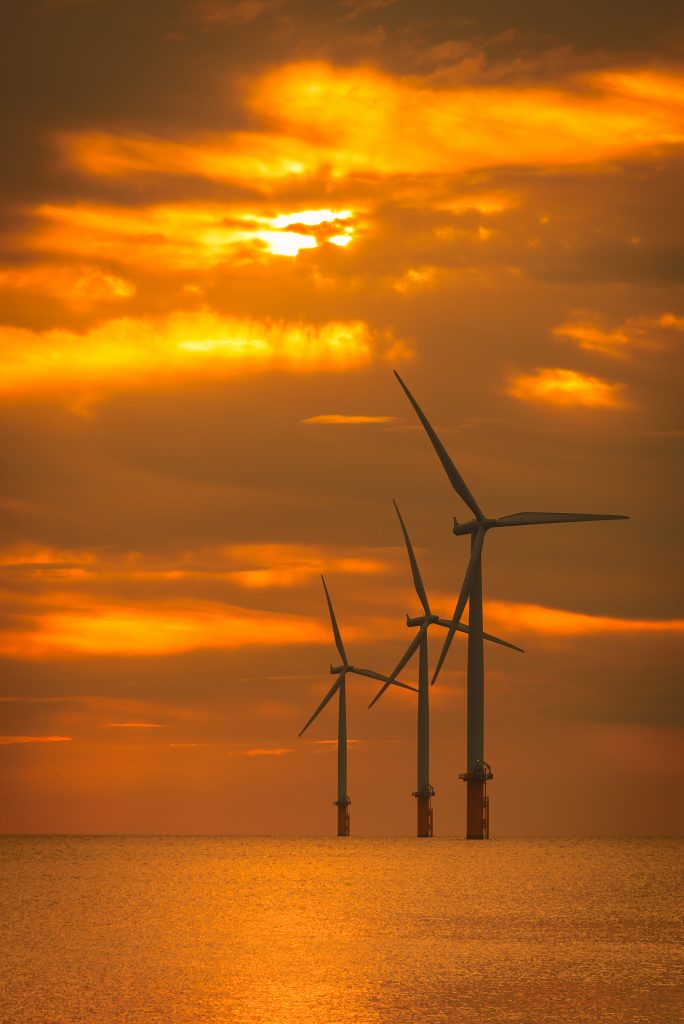
  • To be a UK leader in dispatchable, renewable generation
    • Key system support role for biomass and expansion of Cruachan Pumped Storage Power Station
  • All underpinned by continued focus on safety, sustainability and biomass cost reduction
  • Investments totalling £3bn in period to 2030, fully funded through cash generation
    • Pellet production, UK BECCS and Cruachan expansion

Future positive – people, nature, climate

  • CO2 – >95% reduction in generation emissions since 2012 – sale of CCGT generation assets and end of commercial coal in March 2021 and closure in September 2022 following fulfilment of Capacity Market agreements
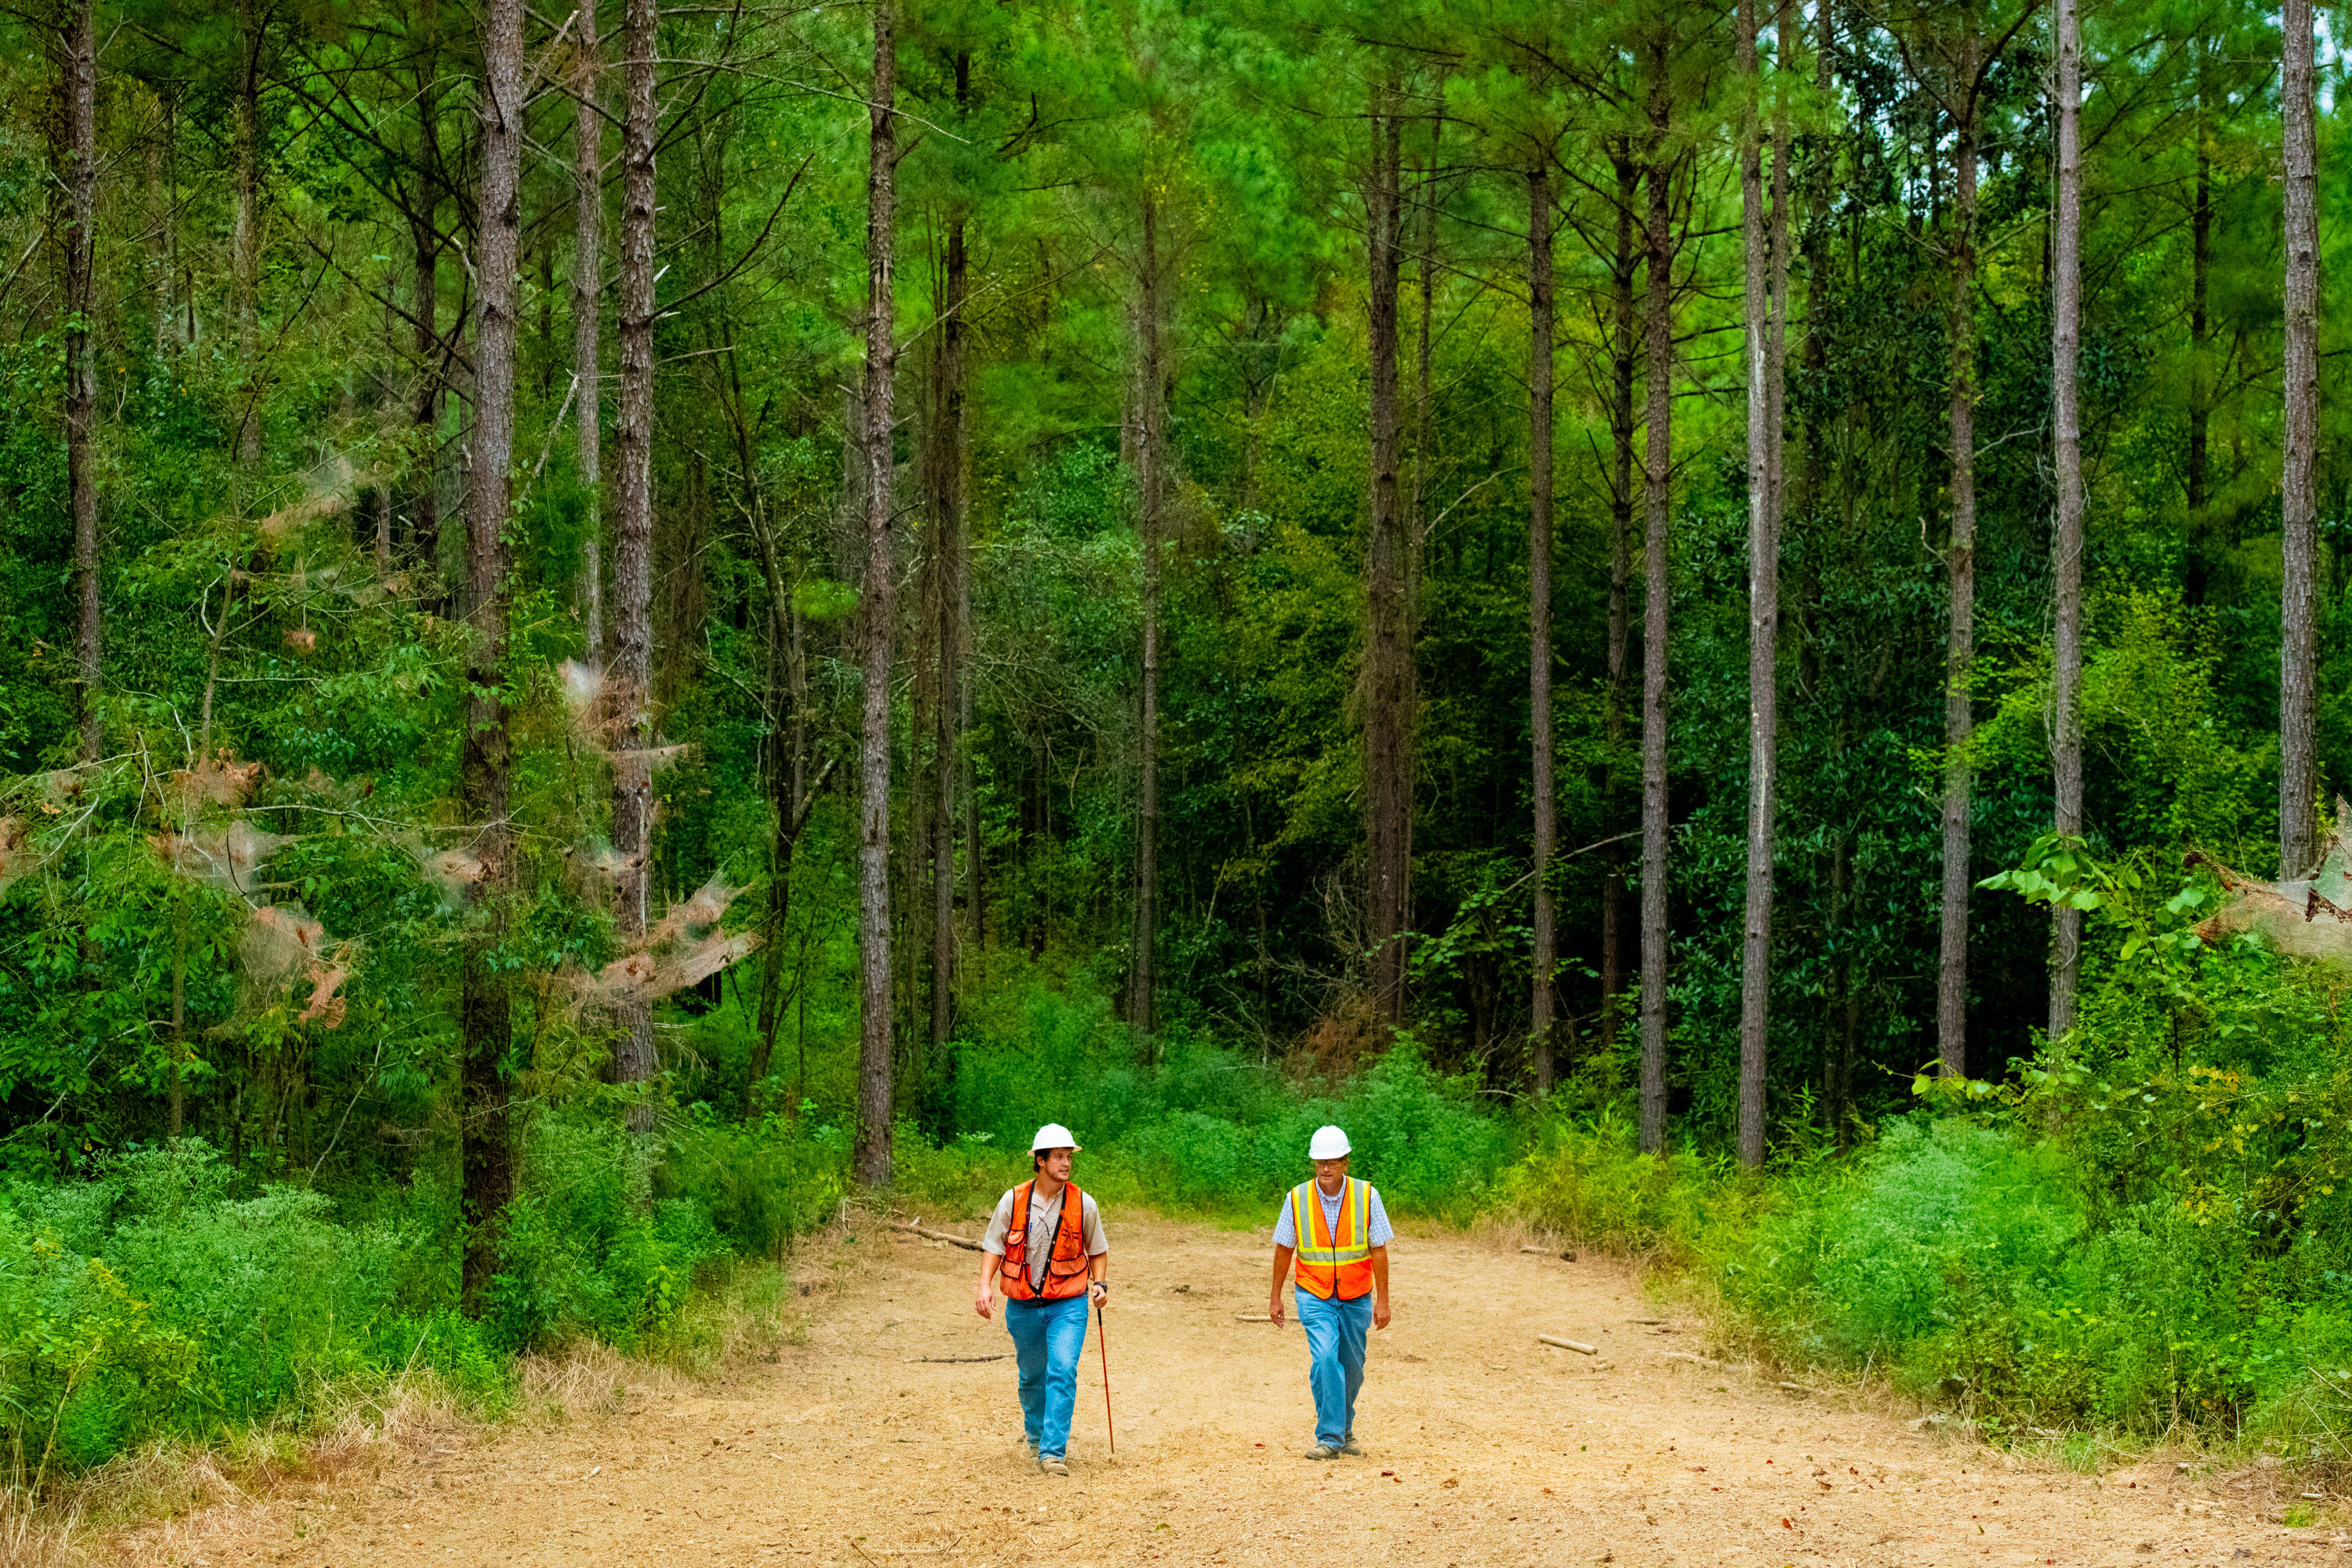
  • Sustainable biomass sourcing
    • Science-based sustainability policy compliant with current UK and EU law on sustainable biomass
    • Biomass produced using sawmill and forest residuals, and low-grade roundwood, which often have few alternative markets and would otherwise be landfilled, burned or left to rot, releasing CO2 and other GHGs
    • Significant increase in sawmill residues used by Drax to produce pellets – 57% of total fibre (2020: 21%)
    • 100% of woody biomass produced by Drax verified against SBP, SFI, FSC®(4) or PEFC Chain of Custody certification with third-party supplier compliance primarily via SBP certification
    • Glasgow Declaration launched at COP26 to establish a world-wide industry standard on biomass sustainability
  • People – Diversity, Equity and Inclusion – female representation in the UK business increased to 36% (2020:34%)
  • Governance – two new North America based Non-Executive Directors – Kim Keating and Erika Peterman

Operational review

Pellet Production – acquisition of Pinnacle, capacity expansion and biomass cost reduction

  • Adjusted EBITDA (including Pinnacle since 13 April 2021) up 65% to £86 million (2020: £52 million)
    • Pellet production up 107% to 3.1Mt (2020: 1.5Mt), with 1.2Mt sales to third parties and increased own-use
    • Total $/t cost of production down 7% to $143/t(5) (2020: $153/t(5))
  • Developments in US southeast (2021-22) – addition of c.0.6Mt of new production capacity
    • Completion of LaSalle and Morehouse plant expansions
    • Commissioning of Demopolis and first satellite plant (Leola)
    • Commencement of construction of second satellite plant (Russellville)
  • Further opportunities for growth and cost reduction – increased production capacity, sales to third parties, continued operational efficiencies and improvement, wider range of sustainable biomass and technical innovation

Generation – dispatchable renewable generation and system support services

  • UK’s largest generator of renewable power by output – 12% of total
  • Adjusted EBITDA from discontinued CCGT generation assets £20 million (2020: £46 million)
  • Adjusted EBITDA from continuing operations £352 million (2020: £400 million)
    • Biomass – 5% increase in generation less major planned outage on CfD unit (successfully completed November 2021), higher cost from historic foreign exchange hedging and system charges
    • Pumped storage / hydro – good operational performance
    • Strong portfolio system support role (balancing mechanism, ancillary services and optimisation)
    • Limited role for coal in H2 at request of system operator
  • Ongoing cost reductions to support operating model for biomass generation at Drax Power Station from 2027
    • Reduction in fixed cost base – end of commercial coal operations March 2021, closure September 2022
    • Third biomass turbine upgrade, delivering improved thermal efficiency and lower maintenance cost
    • Trials to expand range of lower cost sustainable biomass – up to 35% blend achieved in test runs on one unit
  • As at 21 February 2022, Drax had 20.4TWh of power hedged between 2022 and 2024 on its ROC and hydro generation assets at £70.2/MWh, with a further 0.9TWh equivalent of gas sales (transacted for the purpose of accessing additional liquidity for forward sales from ROC units and highly correlated to forward power prices) plus additional sales under the CfD mechanism
Contracted power sales 21 February 2022202220232024
ROC (TWh(6))10.96.92.4
ROC (£ per MWh)70.070.070.6
Hydro (TWh)0.2--
Hydro (£ per MWh)90.9--
Gas hedges (TWh equivalent)(7)0.50.4
Pence per therm105101
CfD(6/8) typical annual output c.5TWh and current strike price £118.5/MWh

Customers – renewable power under long-term contracts to high-quality I&C customers and decarbonisation products

  • Adjusted EBITDA of £6 million inclusive of impact of mutualisation changes and Covid-19 (2020: £39 million loss)
  • Continued development of Industrial & Commercial (I&C) portfolio
    • Focusing on key sectors to increase sales to high-quality counterparties supporting generation route to market
    • Energy services to expand the Group’s system support capability and customer sustainability objectives
  • Rebranding of the Haven Power I&C business to Drax Energy Solutions
  • Closure of Oxford and Cardiff offices as part of Small & Medium-Size (SME) strategic review and continuing to evaluate options for SME portfolio to maximise value and align with strategy

Other financial information

  • Total operating profit from continuing operations of £197 million (2020: £156 million loss, including exceptional costs totalling £275 million principally in respect of the announced closure of coal operations)
  • Total profit after tax from continuing operations of £55 million including a £49 million non-cash charge from revaluing deferred tax balances following confirmation of UK corporation tax rate increases from 2023 (2020: loss of £195 million)
  • 2021 capital investment of £230 million (2020: £183 million) – continued investment in biomass strategy
  • 2022 expected capital investment of £230–250 million – £70-80 million maintenance, £20 million enhancements, £110-120 million strategic, (primarily biomass and BECCS), and £30 million other (primarily safety and systems)
    • Excludes any material investment in non-core Open Cycle Gas Turbine developments – continuing to evaluate options, including sale, but continue to invest as appropriate to fulfil obligations under the Capacity Market agreements and to maximise value from any sale. In the event of a sale Drax expects to recover any capital expenditure incurred during 2022, which could total up to £100 million
  • Group cost of debt below 3.5%
    • Refinancing of Canadian facilities (July 2021) with lower cost ESG facility following Pinnacle acquisition
  • Net debt of £1,044 million (31 December 2020: £776 million), including cash and cash equivalents of £317 million (31 December 2020: £290 million)
    • Expect net debt to Adjusted EBITDA below 2x by the end of 2022
Forward Looking Statements
This announcement may contain certain statements, expectations, statistics, projections and other information that are, or may be, forward-looking. The accuracy and completeness of all such statements, including, without limitation, statements regarding the future financial position, strategy, projected costs, plans, beliefs and objectives for the management of future operations of Drax Group plc (“Drax”) and its subsidiaries (the “Group”), are not warranted or guaranteed. By their nature, forward-looking statements involve risk and uncertainty because they relate to events and depend on circumstances that may occur in the future. Although Drax believes that the statements, expectations, statistics and projections and other information reflected in such statements are reasonable, they reflect the Company’s current view and no assurance can be given that they will prove to be correct. Such events and statements involve risks and uncertainties. Actual results and outcomes may differ materially from those expressed or implied by those forward-looking statements. There are a number of factors, many of which are beyond the control of the Group, which could cause actual results and developments to differ materially from those expressed or implied by such forward-looking statements. These include, but are not limited to, factors such as: future revenues being lower than expected; increasing competitive pressures in the industry; and/or general economic conditions or conditions affecting the relevant industry, both domestically and internationally, being less favourable than expected. We do not intend to publicly update or revise these projections or other forward-looking statements to reflect events or circumstances after the date hereof, and we do not assume any responsibility for doing so.

Results presentation and webcast arrangements

Management will host a webcast presentation for analysts and investors at 11:00am (UK Time) on Thursday 24 February 2022.

The presentation can be accessed remotely via a live webcast link, as detailed below. After the meeting, the webcast recording will be made available and access details of this recording are also set out below.

A copy of the presentation will be made available from 7:00am (UK time) on Thursday 24 February 2022 for download at: https://www.drax.com/investors/announcements-events-reports/presentations/

Event Title: Drax Group plc: Full Year Results
Event Date: Thursday 24 February 2022
Event Time: 11:00am (UK time)
Webcast Live Event Link:  https://secure.emincote.com/client/drax/drax019
Conference call and pre-register Link: https://secure.emincote.com/client/drax/drax019/vip_connect
Start Date:  Thursday 24 February 2022
Delete Date:  Friday 24 February 2023
Archive Link:  https://secure.emincote.com/client/drax/drax019


For further information, please contact: [email protected]

View investor presentation here

Capacity Market Agreements

RNS Number : 5553C
Drax Group PLC
23 February 2022

T-4 auction – provisional results for existing pumped storage and hydro assets

Drax confirms that it has provisionally secured agreements to provide a total of 621MW of capacity (de-rated 586MW) principally from its pumped storage and hydro assets(1). The agreements are for the delivery period October 2025 to September 2026, at a price of £30.59/kW(2), with income of around £18 million in that period. These are in addition to existing agreements which extend to September 2025.

Enquiries:

Drax Investor Relations: Mark Strafford

+44 (0) 7730 763 949

Media:

Drax External Communications: Aidan Kerr

+44 (0) 7849 090 368

Website: www.drax.com

Notes:

  • Cruachan Pumped Storage, the Galloway hydro scheme (Tongland, Kendoon and Glenlee) and three small legacy gas turbines at Drax Power Station (96MW, de-rated 92MW).
  • Capacity Market agreements stated in 2020/21 real-terms, with payments indexed to UK CPI.

END

Alabama Cluster Catchment Area Analysis

The area of timberland in the Alabama cluster catchment area has remained stable over the last 20 years, increasing slightly from 4.08 million ha to 4.16 million ha, an increase of 79 thousand hectares.  This area represents 79.6% of the total land area in 2020, up from 78.1% in 2020.  The total area of forestland and woodland was 86% of the catchment area in 2020, with farmland making up 13% and urban areas 1%.  This land base can be considered to be heavily forested and dominated by timberland.

Figure 1: Land Use Type – Alabama cluster

The timberland area is classified by growth rate potential, capable of achieving a minimum of 0.57 m3/ha/year.  More than 95% of the timberland area is in private ownership.  This proportion has remained stable since 2000 as shown in Figure 2.

Figure 2: Timberland Ownership Profile – Alabama cluster

The total standing volume, the amount of carbon stored in the forest area, has increased by 115 million m3 since 2000 an increase of 30%. Most of this increase has occurred since 2010, with 90 million m3 added to the inventory since this time, reflecting the maturing age class of the forest resource as it passes through the peak growth phase.  Almost all of this increase has been in the softwood pine forest area, with a combined increase of 86 million m3 since 2010.  Pine saw-timber and chip-n-saw both increased by 46% since 2010 and pine pulpwood by 25% over the same period. Suggesting that the average tree size is getting larger as the forest matures.

Figure 3: Standing Volume by Product Class – Alabama cluster

One measure of the sustainability of harvesting levels is to compare average annual growth against removals.  This comparison gives a growth drain ratio (GDR).  Where removals are equal to or lower than growth (a GDR of 1 or more) this is a measure of sustainability, where the ratio falls below 1, this can indicate that harvesting levels are not sustainable in the long-term.  Figure 4 shows that all pine product classes have a positive GDR since 2010.  In particular the pine pulpwood GDR ratio is in excess of 2 suggesting that there is a substantial surplus of this product category.  By contrast, the hardwood GDR for both saw-timber and pulpwood are both lower than 1 suggesting that harvesting levels for hardwood species should be reduced until growth can recover.

Figure 4: Growth Drain Ratio by Product Class – Alabama cluster

Figure 5 shows the maturing age class of the forest area, charting the change in annual surplus and deficit in each product class.  The trend shows that harvesting of pine saw-timber from 2000 to 2008 represented a deficit of growth compared to harvesting removals.  This indicates an immature forest resource with a low quantity of forest categorised as saw-timber, therefore harvesting volume in mature stands outweighed the growth in mid-rotation stands.  As the forest aged, and more standing timber grew into the saw-timber category, the surplus of annual growth compared to removals increased.  Saw-timber growth in 2020 was 3 million m3 higher than in 2000.  The surplus of pine pulpwood has remained positive and has increased substantially from 3 million m3 in 2000 to 6.5 million m3 in 2020 despite harvesting levels increasing slightly over this period.

Figure 5: Annual Surplus/Deficit of Growth and Removal by Product Class – Alabama Cluster

Biomass demand began in 2008 at a very small scale, representing just 0.5% of total pulpwood demand in the catchment area.  From around 2013 it began to increase and reached peak in 2015 with a total demand of 724,000 tons of pulpwood in that year, representing 8.1% of total pulpwood demand in the catchment area.  After that time, demand for pulpwood declined as pellet mills switched to mill residuals.  The latest data on pulpwood demand shows that the biomass sectors made up just 2.8% of total pulpwood demand in 2020 with just over 216,000 tonnes of total demand.  This demonstrates that the biomass and wood pellet sector is a very small component of the market in this region and unlikely to influence forest management decision making, as shown in Figure 6.

Figure 6: Pulpwood Demand by Market – Alabama Cluster

Pine pulpwood stumpage prices have declined significantly since a peak in 2013, falling from an annual high of $9.46 when demand was strongest to just $4.12 in 2020 as demand for pine pulpwood declined in 2020.  Pine saw-timber prices have seen a similar decline from a high point in the early 2000’s to a plateau from 2011 onwards.  Saw-timber stumpage more than halved in value over this period from $49 per ton to $22 per ton.  This can have a significant impact on forest management objectives and decision making.

Figure 7: Stumpage Price Change by Product Category – Alabama Cluster

Detailed below are the summary findings from Hood Consulting on the impact of biomass demand on key issues in the Alabama cluster catchment area.

Is there any evidence that bioenergy demand has caused the following:

Deforestation?

No. US Forest Service (USFS) data shows that total timberland area has held steady and averaged roughly 4,172,000 hectares in the Alabama Cluster catchment area since Alabama Pellets-Aliceville started up in late-2012. More importantly, planted pine timberland (the predominant source of roundwood utilized by the bioenergy industry for wood pellet production) has increased more than 75,000 hectares (+4.9%) in the catchment area since Alabama Pellets’ startup in 2012.

A change in management practices (rotation lengths, thinnings, conversion from hardwood to pine)?

Inconclusive. Changes in management practices have occurred in the catchment area over the last two decades. However, the evidence is inconclusive as to whether increased demand attributed to bioenergy has caused or is responsible for those changes.

Clearcuts and thinnings are the two major types of harvests that occur in this region, both of which are long-standing, widely used methods of harvesting timber. TimberMart-South (TMS) data shows that the prevalence of thinnings temporarily increased in the Alabama Cluster market (from 2007-2013) due to the weakening of pine sawtimber markets. Specifically, challenging market conditions saw pine sawtimber stumpages prices decline from an average of $47 per ton from 2000-2006 to just over $23 per ton in 2011, or a roughly 50% decrease from 2000-2006 average levels. This led many landowners to refrain from clearcutting (a type of harvest which typically removes large quantities of pine sawtimber), as they waited for pine sawtimber prices to improve. However, pine sawtimber stumpage prices never recovered and have held between $22 and $25 per ton since 2011. Ultimately, landowners returned to more ‘normal’ management practices by 2014, with thinnings falling back in line with pre-2007 trends.

The catchment area has also experienced some conversion. Specifically, from 2000-2020, planted pine timberland increased more than 460,000 hectares while natural hardwood and mixed pine-hardwood timberland decreased a combined 390,000 hectares. Note that the increase in planted pine timberland and decrease in natural hardwood/mixed pine-hardwood timberland over this period were both gradual and occurred simultaneously. This suggests a management trend in which natural timber stands are converted to plantation pine following final harvest. It’s also important to note that there is little evidence that links these changes to increased demand from bioenergy, as this conversion trend begun years prior to the startup of Alabama Pellets and continued nearly unchanged following the pellet mill’s startup.

Diversion from other markets?

No. Demand for softwood (pine) sawlogs increased an estimated 12% in the catchment area from 2012-2020. Also, there is no evidence that increased demand from bioenergy has caused a diversion from other softwood pulpwood markets (i.e. pulp/paper). Also, even though softwood pulpwood demand not attributed to bioenergy is down 14% since Alabama Pellets-Aliceville’s startup in 2012, there is no evidence that increased demand from bioenergy has caused this decrease. Rather, the decrease in demand from non-bioenergy sources is due to a combination of reduced product demand (and therefore reduced production) and increased utilization of sawmill residuals.

An unexpected or abnormal increase in wood prices?

No. The startup of Alabama Pellets-Aliceville added roughly 450,000 metric tons of softwood pulpwood demand to the catchment area from 2012-2016, and this increase in demand coincided with essentially no change in delivered pine pulpwood (PPW) price over this same period. Ultimately, the additional demand placed on the catchment area following the startup of Alabama Pellets-Aliceville was offset by a decrease in demand from other sources from 2012-2016, and, as a result, delivered PPW prices remained nearly unchanged.

However, the Aliceville facility was shut down for a majority of 2017 due to the catastrophic failure of a key piece of environmental equipment, and this was followed by Alabama Pellets’ strategic decision to transition to residual-consumption only beginning in 2018, which eliminated more than 360,000 metric tons of annual softwood pulpwood demand from 2016-2018. Over this same period, softwood pulpwood demand from other sources also decreased nearly 360,000 metric tons. So, with the elimination of roughly 720,000 metric tons of annual softwood pulpwood demand from all sources from 2016-2018, delivered PPW prices in the catchment area proceeded to decrease more than 6% over this period. Since 2018, total softwood pulpwood demand has increased roughly 4% in the catchment area (due to increases in demand from non-bioenergy sources), and this increase that has coincided with a simultaneous 4% increase in delivered PPW price.

Statistical analysis did identify a positive relationship between softwood biomass demand and delivered PPW price. However, the relationship between delivered PPW price and non-biomass-related softwood pulpwood demand was found to be stronger, which is not unexpected given that pine pulpwood demand not attributed to bioenergy has accounted for 94% of total pine pulpwood demand in the catchment area since 2012. Ultimately, the findings provide evidence that PPW price is influenced by demand from all sources – not just from bioenergy or from pulp/paper, but from both.

Furthermore, note that Alabama Pellets’ shift to residual-consumption only beginning in 2018 resulted in no increase in pine sawmill chip prices, as the price of pine sawmill chips in the Alabama Cluster catchment area rather decreased from 2018-2020, despite a more than 100,000-metric ton increase in pine sawmill chip consumption by the Aliceville mill over this period.

A reduction in growing stock timber?

No. From 2012 (the year Alabama Pellets started up) to 2020, total growing stock inventory increased an average of 2.6% per year (+22% total) in the Alabama Cluster catchment area. Specifically, inventories of pine sawtimber and pine chip-n-saw increased 41% and 40%, respectively, while pine pulpwood (PPW) inventory increased 25% over this same period.

A reduction in the sequestration rate of carbon?

No. US Forest Service (USFS) data shows the average annual growth rate of total growing stock timber in the Alabama Cluster catchment area increased from 6.0% in 2012 to 6.2% in 2020, suggesting that the sequestration rate of carbon also increased slightly over this period.

Note that the increase in overall growth rate (and therefore increase in the sequestration rate of carbon) can be linked to gains in pine timberland and associated changes with the catchment area forest. Specifically, growth rates decline as timber ages, so the influx of new pine timberland (due to the conversion of both hardwood forests and cropland) has resulted in just the opposite, with the average age of softwood (pine) growing stock inventory decreasing from an estimated 35.4 years of age in 2000 to 33.2 years of age in 2010 and to 32.2 years of age in 2020 (total growing stock inventory decreased from 41.9 to 41.0 and to 40.4 years of age over these periods).

An increase in harvesting above the sustainable yield capacity of the forest area?

No. Growth-to-removals (G:R) ratios, which compare annual timber growth to annual timber removals, provides a measure of market demand relative to supply as well as a gauge of market sustainability. In 2020, the latest available, the G:R ratio for pine pulpwood (PPW), the predominant timber product utilized by the bioenergy sector, equaled 3.26 (recall that a value greater than 1.0 indicates sustainable harvest levels).

Moreover, note that the PPW G:R ratio has increased in the catchment area since the Aliceville mill’s startup in 2012, despite the associated increases in pine pulpwood demand. In this catchment area, pine pulpwood demand from non-bioenergy sources decreased more than 860,000 metric tons from 2012 to 2020, and this decrease more than offset any increase in demand from bioenergy.

Impact of bioenergy demand on:

Timber growing stock inventory

Neutral. According to USFS data, inventories of pine pulpwood (PPW) increased 25% in the catchment area from 2012-2020, and this increase in PPW inventory can be linked to both increases in pine timberland and harvest levels below the sustainable yield capacity of the forest area. Specifically, pine timberland (both planted and natural combined) increased more than 185,000 hectares in the catchment area from 2012-2020. Over this same period, annual harvests of PPW were 65% below maximum sustainable levels.

Timber growth rates

Neutral. The average annual growth rate of total growing stock timber increased from 6.0% in 2012 to 6.2% in 2020 in the Alabama Cluster catchment area, despite pine pulpwood (PPW) growth rate decreasing from 15.1% to 12.5% over this period. However, this decrease in PPW growth rate was not due to increased demand attributed to bioenergy but rather to the aging of PPW within its product group and its natural movement along the pine growth rate curve. Specifically, USFS data indicates the average age of PPW inventory in the catchment area increased from an estimated 13.4 years of age in 2012 to 13.6 years of age in 2020.

Forest area

Neutral. In the Alabama Cluster catchment area, total forest (timberland) area remained nearly unchanged (decreasing only marginally) from 2012-2020. However, pine timberland – the predominant source of roundwood utilized by the bioenergy industry for wood pellet production – increased more than 185,000 hectares over this period, and this increase can be linked to several factors, including conversion from both hardwood and mixed pine-hardwood forests as well as conversion from cropland.

Specifically, the more than 185,000-hectare increase in pine timberland from 2012-2020 coincided with a roughly 197,000-hectare decrease in hardwood/mixed pine-hardwood timberland and a more than 8,000-hectare decrease in cropland over this period. Furthermore, statistical analysis confirmed these inverse relationships, identifying strong negative correlations between pine timberland area and both hardwood/mixed pine-hardwood timberland area and cropland in the catchment area from 2012-2020.

Wood prices

Negative/Neutral. Softwood pulpwood demand attributed to bioenergy increased from roughly 80,000 metric tons in 2012 (the year Alabama Pellets-Aliceville started up) to more than 655,000 metric tons in 2015 (the year biomass demand reached peak levels). However, this roughly 575,000-metric ton increase in softwood biomass demand coincided with essentially no change in delivered pine pulpwood (PPW) price – which averaged $26.40 per ton in 2012 and $26.39 per ton in 2015. Ultimately, the additional demand placed on this catchment area following the startup of Alabama Pellets-Aliceville was offset by a more than 680,000-metric ton decrease in demand from other sources over this same period, and, as a result, delivered PPW prices remained nearly unchanged. Also note that Alabama Pellets’ strategic shift to consume residuals only (a transition that begun in 2018 and had been completed by 2019) resulted in a nearly 480,000-metric ton decrease in softwood biomass demand in the catchment area from 2015 to 2020. Over this same period, softwood pulpwood demand from other sources decreased more than 180,000 metric tons. In total, softwood pulpwood demand from all sources decreased more than 660,000 metric tons from 2015 to 2020, and this decrease in demand resulted in delivered PPW prices decreasing 5% over this period.

Statistical analysis did identify a positive relationship between softwood biomass demand and delivered PPW price. However, the relationship between delivered PPW price and non-biomass-related softwood pulpwood demand was found to be stronger, which is not unexpected given that pine pulpwood demand not attributed to bioenergy has accounted for 94% of total pine pulpwood demand in the catchment area since 2012. Ultimately, the findings provide evidence that PPW price is influenced by demand from all sources – not just from bioenergy or from pulp/paper, but from both.

Markets for solid wood products

Positive. In the Alabama Cluster catchment area, demand for softwood sawlogs used to produce lumber and other solid wood products has increased an estimated 12% since 2012, and this increase in softwood lumber production has consequentially resulted in the increased production of sawmill residuals (i.e. chips, sawdust, and shavings) – by-products of the sawmilling process and materials utilized by Alabama Pellets to produce wood pellets.

Moreover, the increased availability of sawmill residuals and lower relative cost compared to roundwood (after chipping and other processing costs are considered) led Alabama Pellets to make a strategic shift to utilize residuals only for wood pellet production beginning in 2019. So, not only has Alabama Pellets benefited from the greater availability of this lower-cost sawmill by-product, but lumber producers have also benefited, as Alabama Pellets has provided an additional outlet for these producers and their by-products.

Read the full report: Alabama Cluster Catchment Area Analysis

This is part of a series of catchment area analyses around the forest biomass pellet plants supplying Drax Power Station with renewable fuel. Others in the series can be found here

What is sustainable forest management?

Sustainable forest management is frequently defined in terms of providing a balance of social, environmental, and economic benefits, not just for today but for the future too. It might be seen as the practice of maintaining forests to ensure they remain healthy, absorb more carbon than they release, and can continue to be enjoyed and used by future generations.

To achieve this, foresters apply science, knowledge, and standards that help ensure forests continue to play an important role in the wellbeing of people and the planet.

Managed forests, also called working forests, fulfil a variety of environmental, social, and economic functions. These range from forests managed to attract certain desired wildlife species, to forests grown to provide saw timber and reoccurring revenue for landowners.

How are forests sustainably managed?

How forests are managed depends on landowner goals – managing for recreation and wildlife, focusing on maximising production of wood products, or both. Each forest requires management tailored to its owner’s or manager’s objectives.

There are many ways to manage forests to keep them healthy – there is no ‘one size fits all’ – but keeping track of how they are doing can be tricky. One alternative for monitoring forests is to use satellite imagery.

One common sustainable forestry practice is thinning, which involves periodically removing smaller, unhealthy, or diseased trees to enable stronger ones to thrive. Thinning reduces competition between trees for resources like sunlight and water, and it can also help promote biodiversity by creating more space for other forest flora.

The wood removed from forests through thinning is sometimes not high-quality enough to be used in industries such as construction or furniture. However, the biomass industry can use it to make compressed wood pellets; a feedstock for renewable source electricity.

By providing a market for low-quality wood, pellet production encourages landowners to carry out thinnings. This practice improves the health of the forest, and helps support better growth, greater carbon storage, and creates more valuable woodland.

Fast facts

What are the environmental benefits of sustainably managed forests?

Through their ability to act as carbon sinks, forests are an important part of meeting global climate goals like the Paris Agreement and the UK’s own target of reaching net zero emissions by 2050.

When managed effectively through thinning or active harvesting, and replanting and regeneration, forests can often sequester – or absorb and store – more carbon than forests that are left untouched, increasing productivity and improving planting material.

Harvesting trees before they reach an age when growth slows or plateaus can help prevent fire damage, pests, and disease, so timing of final cutting is important. Though the vast majority of timber from such cutting will go to other markets (construction, furniture etc) and secure higher prices from those markets, being able to sell lower quality wood for biomass provides the landowner with some extra revenue.

Sustainably managed forests also help achieve other environmental goals, such as sustaining biodiversity, protecting sensitive sites and providing clean air and water. Managed forests also have substantial water absorption capacity preventing flooding by slowing the flow of sudden downpours and helping to prevent nearby rivers and streams from overfilling.

Wood from working forests also help tackle climate change in that high-value wood from harvested trees can be used to make timber for the construction or furniture sectors. These wood products lock up carbon for extended periods of time, and the wood can be used at end-of life to displace fossil fuels. Using wood also means materials such as concrete, bricks or steel are not used, and these materials have a large carbon footprint compared to wood.

What are the socioeconomic benefits of sustainably managed forests?

There are also social and economic benefits to managing forests. Sustainably managed working forests make vital contributions both to people and to the planet.

The commercial use of wood in industries like furniture and construction drives revenue for landowners. This encourages landowners to continue to replant forests and manage them in a sustainable way that continues to deliver returns.

Healthy forests can also improve living standards for local communities for jobs and helping to address unemployment in rural regions. Managed forests can also improve access for recreation. On a larger scale, sustainable forestry can offer a valuable export for regions and nations and foster trade between countries.

Go deeper 

How is carbon stored?

Carbon storage is the process of capturing and trapping that CO2. This can occur naturally in the form of carbon sinks like forests, oceans, and soils that store carbon. However, it can also be manually carried out through technology.   

One of the most well-established ways of storing carbon through the use of technology is by injecting CO2 into naturally occurring geological formations that can lock in or sequester the molecule on a permanent basis. Carbon storage is the final phase of the carbon capture, usage, and storage (CCUS) process.

Why do we need to store carbon?

Global bodies like the UN’s Intergovernmental Panel on Climate Change (IPCC), as well as the UK’s own Climate Change Committee, emphasise carbon capture and storage as crucial to achieving net zero emissions and meeting the Paris Agreement’s goal of limiting temperature rises to within 1.5oC.

This includes supporting forest growth through afforestation and reforestation, and other nature-based solutions to store carbon, alongside CCUS technology.

The European Commission also highlights CCUS’s role in balancing increased energy demand and continued fossil fuel use in the future, with the need to reduce greenhouse gas emissions and prevent them entering the atmosphere.

How is carbon captured and transported to storage?

In naturally occurring examples, forests and ocean fauna absorb carbon through photosynthesis. When the vegetation eventually decomposes the carbon is sequestered into soil and seabeds.

Carbon can also be captured from emissions sources such as factories or power plants. The carbon is captured either pre-combustion, where it is removed from the fuel source, or post-combustion, where it is removed from exhaust fumes in the form of CO2.

The CO2 is then converted into a supercritical state where it has the viscosity of a gas but the density of a liquid, meaning it can travel more easily through pipelines. It can also be transported via trucks and ships, but pipelines are the most efficient.

Where can carbon be stored?

Natural carbon sinks differ all over the world, from peatlands in Scotland to Pacific coral reefs to the massive forests that cover countries like Russia, Canada, and Brazil. Wooden buildings also act as carbon storage as they maintain the carbon within the wood for long time periods.

The CO2 captured by manmade technologies can also be stored in different types of geological formation: unused natural gas reserves, saline aquifers, and un-minable coal mines.

The North Sea, with its expansive layers of porous sandstone, also offers the UK alone an estimated 70 billion tonnes of potential CO2 storage space.

If negative emissions technologies (which actively remove emissions from the atmosphere) were to capture and store the equivalent amount of CO2 as the 258 million tonnes expected to remain in the UK economy in 2050, it would take up just 0.36% of the available storage space.

Years of research by the oil and gas industries mean many such geological structures have been mapped and are well understood all around the world.

Carbon storage fast facts

How is the carbon kept in place?

In nature-based carbon sinks the carbon does not always remain in one location. In a forest, for example, trees and plants will hold carbon until the end of their lifetime after which they decompose, releasing some CO2 into the atmosphere while some is sequestered into soil.

When CO2 captured through CCUS is stored several things can happen to it in a geological storage site. It can be caught in the minute intervening spaces within the rock through capillary action, or trapped by a layer of impermeable cap-rock, which prevents it from moving upwards.

CO2 may also dissolve in the water and then sinks as it is heavier than normal water. The carbonated water reacts with basaltic rocks which cover most of the ocean floor. The reaction releases elements like calcium, magnesium, and iron into the water stream. Over time, these elements combine with the dissolved CO2 to form stable carbonate minerals that permanently fill pores within the rock.

How does CO2 enter the storage sites?

The CO2 is injected into the porous rocks of depleted or unused natural gas or oil reserves, as well as saline aquifers – geologic strata, filled with brine or saline water. Porous rock is filled with holes and gaps between the grains that make up the rock. When CO2 is injected into these structures, the CO2 floods the pores, displacing the brine or remnants of oil and gas. It then spreads out and is trapped in the dome-like structures of the rock strata called anticlines.

How long can CO2 be stored?

Appropriately selected and maintained geological reservoirs are “very likely” to retain 99% of sequestered carbon for more than 100 years and are “likely” to retain 99% of sequestered carbon for more than 1,000 years, according to the 2005 Special Report on CCS by the IPCC. Another study by Nature found that more than 98% of injected CO2 will remain stored for over 10,000 years.

In natural carbon sinks, the length of time that carbon is stored varies and depends on environments being preserved. Peatland, for example, builds up over thousands of years storing carbon. However, as peatlands degrade from attempts to drain them to create arable land, as well as peat extraction for fuel, they begin to emit CO2. The lifecycle of a tree by contrast is relatively short before it decomposes and releases some CO2 back into the atmosphere.

The ability for geological storage to contain CO2 for millennia means it can truly remove and permanently store emissions.

Go deeper

Forests, net zero and the science behind biomass

Tackling climate change and spurring a global transition to net zero emissions will require collaboration between science and industry. New technologies and decarbonisation methods must be rooted in scientific research and testing.

Drax has almost a decade of experience in using biomass as a renewable source of power. Over that time, our understanding around the effectiveness of bioenergy, its role in improving forest health and ability to deliver negative emissions, has accelerated.

Research from governments and global organisations, such as the UN’s Intergovernmental Panel on Climate Change (IPCC) increasingly highlight sustainably sourced biomass and bioenergy’s role in achieving net zero on a wide scale.

The European Commission has also highlighted biomass’ potential to provide a solution that delivers both renewable energy and healthy, sustainably managed forests.  Frans Timmermans, the executive vice-president of the European Commission in charge of the European Green Deal has emphasised it’s importance in bringing economies to net zero, saying: “without biomass, we’re not going to make it. We need biomass in the mix, but the right biomass in the mix.”

The role of biomass in a sustainable future

Moving away from fossil fuels means building an electricity system that is primarily based on renewables. Supporting wind and solar, by providing electricity at times of low sunlight or wind levels, will require flexible sources of generation, such as biomass, as well as other technologies like increased energy storage.

In the UK, the Climate Change Committee’s (CCC) Sixth Carbon Budget report lays out its Balanced Net Zero Pathway. In this lead scenario, the CCC says that bioenergy can reduce fossil emissions across the whole economy by 2 million tonnes of CO2 or equivalent emissions (MtCO2e) per year by 2035, increasing to 2.5 MtCO2e in 2045.

Foresters in working forest, Mississippi

Foresters in working forest, Mississippi

Biomass is also expected to play a crucial role in supplying biofuels and hydrogen production for sectors of the global economy that will continue to use fuel rather than electricity, such as aviation, shipping and industrial processes. The CCC’s Balanced Net Zero Pathway suggest that enough low-carbon hydrogen and bioenergy will be needed to deliver 425 TWh of non-electric power in 2050 – compared to the 1,000 TWh of power fossil fuels currently provide to industries today.

However, bioenergy can only be considered to be good for the climate if the biomass used comes from sustainably managed sources. Good forest management practises ensure that forests remain sustainable sources of woody biomass and effective carbon sinks.

A report co-authored by IPCC experts examines the scientific literature around the climate effects (principally CO2 abatement) of sourcing biomass for bioenergy from forests managed according to sustainable forest management principles and practices.

The report highlights the dual impact managed forests contribute to climate change mitigation by providing material for forest products, including biomass that replace greenhouse gas (GHG)-intensive fossil fuels, and by storing carbon in forests and in long-lived forest products.

The role of biomass and bioenergy in decarbonising economies goes beyond just replacing fossil fuels. The addition of carbon capture and storage (CCS) to bioenergy to create bioenergy with carbon capture and storage (BECCS) enables renewable power generation while removing carbon from the atmosphere and carbon cycle permanently.

The negative emissions made possible by BECCS are now seen as a fundamental part of many scenarios to limit global warming to 1.5oC above pre-industrial levels.

BECCS and the path to net zero

The IPCC’s special report on limiting global warming to 1.5oC above pre-industrial levels, emphasises that even across a wide range of scenarios for energy systems, all share a substantial reliance on bioenergy – coupled with effective land-use that prevents it contributing to deforestation.

The second chapter of the report deals with pathways that can bring emissions down to zero by the mid-century. Bioenergy use is substantial in 1.5°C pathways with or without CCS due to its multiple roles in decarbonising both electricity generation and other industries that depend on fossil fuels.

However, it’s the negative emissions made possible by BECCS that make biomass  instrumental in multiple net zero scenarios. The IPCC report highlights BECCS alongside the associated afforestation and reforestation (AR), that comes with sustainable forest management, are key components in pathways that limit climate change to 1.5oC.

Graphic showing how BECCS removes carbon from the atmosphere. Click to view/download

There are two key factors that make BECCS and other forms of emissions removals so essential: The first is their ability to neutralise residual emissions from sources that are not reducing their emissions fast enough and those that are difficult or even impossible to fully decarbonise. Aviation and agriculture are two sectors vital to the global economy with hard-to-abate emissions. Negative emissions technologies can remove an equivalent amount of CO2 that these industries produce helping balance emissions and progressing economies towards net zero.

The second reason BECCS and other negative emissions technologies will be so important in the future is in the removal of historic CO2 emissions. What makes CO2 such an important GHG to reduce and remove is that it lasts much longer in the atmosphere than any other. To help reach the Paris Agreement’s goal of limiting temperature rises to below 1.5oC removing historic emissions from the atmosphere will be essential.

In the UK, the  CCC’s 2018 report ‘Biomass in a low-carbon economy’ also points to BECCS as both a crucial source of energy and emissions abatement.

It suggests that power generation from BECCS will increase from 3 TWh per year in 2035 to 45 TWh per year in 2050. It marks a sharp increase from the 19.5 TWh that biomass (without CCS) accounted for across 2020, according to Electric Insights data. It also suggests that BECCS could sequester 1.1 tonnes of CO2 for every tonne of biomass used, providing clear negative emissions.

However, the report makes clear that unlocking the potential of bioenergy and BECCS is only possible when biomass stocks are managed in a sustainable way that, as a minimum requirement, maintains the carbon stocks in plants and soils over time.

With increased attention paid to forest management and land use, there is a growing body of evidence that points to bioenergy as a win-win solution that can decarbonise power and economies, while supporting healthy forests that effectively sequester CO2.

How bioenergy ensures sustainable forests

Biomass used in electricity generation and other industries must come from sustainable sources to offer a renewable, climate beneficial [or low carbon] source of power.

UK legislation on biomass sourcing states that operators must maintain an adequate inventory of the trees in the area (including data on the growth of the trees and on the extraction of wood) to ensure that wood is extracted from the area at a rate that does not exceed its long-term capacity to produce wood. This is designed to ensure that areas where biomass is sourced from retain their productivity and ability to continue sequestering carbon.

Ensuring that forestland remains productive and protected from land-use changes, such as urban creep, where vegetated land is converted into urban, concreted spaces, depends on a healthy market for wood products. Industries such as construction and furniture offer higher prices for higher-quality wood. While low-quality, waste wood, as well as residues from forests and wood-industry by-products, can be bought and used to produce biomass pellets.

A report by Forest 2 Market examined the relationship between demand for wood and forests’ productivity and ability to sequester carbon in the US South, where Drax sources about two-thirds of its biomass.

The report found that increased demand for wood did not displace forests in the US South. Instead, it encouraged landowners to invest in productivity improvements that increased the amount of wood fibre and therefore carbon contained in the region’s forests.

A synthesis report, which examines a broad range of research papers,  published in Forest Ecology and Management in March of 2021, concluded from existing studies that claims of large-scale damage to biodiversity from woody biofuel in the South East US are not supported. The use of these forest residues as an energy source was also found to lead to net GHG greenhouse emissions savings compared to fossil fuels, according to Forest Research.

Importantly the research shows that climate risks are not exacerbated because of biomass sourcing; in fact, the opposite is true with annual wood growth in the US South increasing by 112% between 1953 and 2015.

Delivering a “win-win solution”

The European Commission’s JRC Science for Policy literature review and knowledge synthesis report ‘The use of woody biomass for energy production in the EU’ suggests  a win-win forest bioenergy pathway is possible, that can reduce greenhouse gas emissions in the short term, while at the same time not damaging, or even improving, the condition of forest ecosystems.

However, it also makes clear “lose-lose” situations is also a possible, in which forest ecosystems are damaged without providing carbon emission reductions in policy-relevant timeframes.

Win-win management practices must benefit climate change mitigation and have either a neutral or positive effect on biodiversity. A win-win future would see the afforestation of former arable land with diverse, naturally regenerated and dedicated industrial forests.

The report also warns of trade-offs between local biodiversity and mitigating carbon emissions, or vice versa. These must be carefully navigated to avoid creating a lose-lose scenario where biodiversity is damaged and natural forests are converted into plantations, while BECCS fails to deliver the necessary negative emissions.

In a future that will depend on science working in collaboration with industries to build a net zero future continued research is key to ensuring biomass can deliver the win-win solution of renewable electricity with negative emissions while supporting healthy forests.

Updating on ambitions for pellet plants, biomass sales and BECCS

Foresters in working forest, Mississippi

Highlights

  • New targets for pellet production and biomass sales
    • Biomass pellet production – targeting 8Mt pa by 2030 (currently c.4Mt)
    • Biomass pellet sales to third parties – targeting 4Mt pa by 2030 (currently c.2Mt)
  • Continued progress with UK BECCS(1) and biomass cost reduction
    • BECCS at Drax Power Station – targeting 8Mt pa of negative CO2 emissions by 2030
    • Biomass cost reduction – continuing to target biomass production cost of $100/t(2)
  • £3bn of investment in opportunities for growth 2022 to 2030
    • Pellet production, UK BECCS and pumped storage
    • Self-funded and significantly below 2x net debt to Adjusted EBITDA(3) in 2030
  • Development of additional investment opportunities for new-build BECCS
    • Targeting 4Mt pa of negative CO2 emissions outside of UK by 2030
  • Targeting returns significantly in excess of the Group’s cost of capital

Will Gardiner, Drax Group CEO, said:

Drax Group CEO Will Gardiner

Will Gardiner, CEO, Drax Group. Click to view/download.

“Drax has made excellent progress during 2021 providing a firm foundation for further growth. We have advanced our BECCS project – a vital part of the East Coast Cluster that was recently selected to be one of the UK’s two priority CCS projects. And we’re now setting out a strategy to take the business forward, enabling Drax to make an even greater contribution to global efforts to reach net zero.

“We believe Drax can deliver growth and become a global leader in sustainable biomass and negative emissions and a UK leader in dispatchable, renewable generation. We aim to double our sustainable biomass production capacity by 2030 – creating opportunities to double our sales to Asia and Europe, where demand for biomass is increasing as countries transition away from coal.

“As a global leader in negative emissions, we’re going to scale up our ambitions internationally. Drax is now targeting 12 million tonnes of carbon removals each year by 2030 by using bioenergy with carbon capture and storage (BECCS). This includes the negative emissions we can deliver at Drax Power Station in the UK and through potential new-build BECCS projects in North America and Europe, supporting a new sector of the economy, which will create jobs, clean growth and exciting export opportunities.”

Capital Markets Day

Drax is today hosting a Capital Markets Day for investors and analysts.

Will Gardiner and members of his leadership team will update on the Group’s strategy, market opportunities and development projects. The day will outline the significant opportunities Drax sees to grow its biomass supply chain, biomass sales and BECCS, as well as long-term dispatchable generation from biomass and pumped storage.

Purpose and ambition

The Group’s purpose is to enable a zero carbon, lower cost energy future and its ambition is to be a carbon negative company by 2030. The Group aims to realise its purpose and ambition through three strategic pillars, which are closely aligned with global energy policies, which increasingly recognise the unique role that biomass can play in the fight against climate change.

Strategic pillars

  • To be a global leader in sustainable biomass pellets
  • To be a global leader in negative emissions
  • To be a leader in UK dispatchable, renewable generation

The development of these pillars remains underpinned by the Group’s continued focus on safety, sustainability and biomass cost reduction.

A Global leader in sustainable biomass pellets

Drax believes that the global market for sustainable biomass will grow significantly, creating opportunities for sales to third parties in Asia and Europe, BECCS, generation and other long-term uses of biomass. Delivery of these opportunities is supported by the expansion of the Group’s biomass pellet production capacity.

The Group has 13 operational pellet plants with nameplate capacity of c.4Mt, plus a further two plants currently commissioning and other developments/expansions which will increase this to c.5Mt once complete.

Drax is targeting 8Mt of production capacity by 2030, which will require the development of over 3Mt of new biomass pellet production capacity. To deliver this additional capacity Drax is developing a pipeline of organic projects, principally focused on North America. Drax expects to take a final investment decision on 0.5-1Mt of new capacity in 2022, targeting returns significantly in excess of the Group’s cost of capital.

Underpinned by this expanded production capacity, Drax aims to double sales of biomass to third parties to 4Mt pa by 2030, developing its market presence in Asia and Europe, facilitated by the creation of new business development teams in Tokyo and London.

Drax is a major producer, supplier and user of biomass, active in all areas of the supply chain with long-term relationships and almost 20 years of experience in biomass operations. The Group’s innovation in coal-to-biomass engineering, supply chain management and leadership in negative emissions can be deployed alongside its large, reliable and sustainable supply chain to support customer decarbonisation journeys with long-term partnerships.

Drax expects to sell all the biomass it produces, based on an appropriate market price, typically with long-term index-linked contracts.

Continued focus on cost reduction

In 2018 the Group’s biomass production cost was $166/t(2). At the H1 2021 results, through a combination of fibre sourcing, operational improvements and capacity expansion (including the acquisition of Pinnacle Renewable Energy Inc), the production cost had reduced to $141/t(2). Drax’s aims to use the combined expertise of Drax and Pinnacle to apply learnings and cost savings across its portfolio and continues to target $100/t(2) (£50/MWh equivalent(4)) by 2027.

A Global leader in negative emissions

The Intergovernmental Panel on Climate Change(5) and the Coalition for Negative Emissions(6) have both outlined a clear role for BECCS in delivering the negative emissions required to limit global warming to 1.5oC above pre-industrial levels and to achieve net zero by 2050, identifying a requirement of between 2bn and 7bn tonnes of negative emissions globally from BECCS.

Separately, the UK Government has recently published its Net Zero Strategy and Biomass Policy Statement reaffirming the established international scientific consensus that sustainable biomass is renewable and that it will play a critical role in helping the UK achieve its climate targets. It also signposted an ambition for at least 5Mt pa of negative emissions from BECCS and Direct Air Capture by 2030, 23Mt pa by 2035 and up to 81Mt pa by 2050. The reports commit the Government to the development during 2022 of a financial model to support BECCS to meet these requirements.

Subject to the right regulatory environment, Drax plans to transform Drax Power Station into the world’s biggest carbon capture project using BECCS to permanently remove 8Mt of CO2 emissions from the atmosphere each year by 2030. The project is well developed, the technology is proven and an investment decision could be taken in 2024 with the first BECCS unit operational in 2027 and a second in 2030, subject to the right investment framework.

The Group aims to build on this innovation with a new target to deliver 4Mt of negative CO2 emissions pa from new-build BECCS outside of the UK by 2030 and is currently developing models for North American and European markets.

A UK leader in dispatchable, renewable generation

The UK’s plans to achieve net zero by 2050 will require the electrification of heating and transport systems, resulting in a significant increase in demand for electricity. Drax believes that over 80% of this could be met by intermittent renewable and inflexible low-carbon energy sources – wind, solar and nuclear. However, this will only be possible if the remaining power sources can provide the dispatchable power and non-generation system support services the power system requires to ensure security of supply and to limit the cost to the consumer.

Long-term biomass generation and pumped storage hydro can provide these increasingly important services. Drax Power Station is the UK’s largest source of renewable power by output and the largest dispatchable plant. The Group is continuing to develop a lower cost operating model for this asset, supported by a reduction in fixed costs associated with the end of coal operations.

Drax is also developing an option for new pumped storage – Cruachan II – which could take a final investment decision in 2024 and be operational by 2030, providing an additional 600MW of dispatchable long-duration storage to the power system.

In its Smart Systems and Flexibility plan (July 2021), the UK Government described long-duration storage technologies as essential for achieving net zero and has committed to take actions to de-risk investment for large-scale and long-duration storage.

Capital allocation and dividend

Strategic capital investment (3Mt of new biomass pellet production capacity, BECCS at Drax Power Station and Cruachan II) is expected to be in the region of £3bn between 2022 and 2030, backed by long-term contracted cashflows and targeting high single-digit returns and above.

No final investment decision has been taken on any of these projects and both BECCS and Cruachan II remain subject to further clarity on regulatory and funding mechanisms.

The Group believes these investments can be self-funded through strong cash generation over the period with net debt to Adjusted EBITDA significantly below 2x at the end of 2030, providing flexibility to support further investment, such as new-build BECCS as these options develop.

Drax remains committed to the capital allocation policy established in 2017, noting that average annual dividend growth was around 10% in the last 5-years.

Webcast and presentation material

The event will be webcast from 10.00am and the material made available on the Group’s website from 7:00am. Joining instructions for the webcast and presentation are included in the links below.

https://secure.emincote.com/client/drax/drax016

Notes:
(1) BioEnergy Carbon Capture and Storage.
(2) Free on Board – cost of raw fibre, processing into a wood pellet, delivery to Drax port facilities in US and Canada, loading to vessel for shipment and overheads.
(3) Earnings before interest, tax, depreciation, amortisation, excluding the impact of exceptional items and certain remeasurements.
(4) From c.£75/MWh in 2018 to c.£50/MWh, assuming a constant FX rate of $1.45/£.
(5) Coalition for Negative Emissions (June 2021).
(6) Intergovernmental Panel on Climate Change (August 2021).

Enquiries:

Drax Investor Relations: Mark Strafford
+44 (0) 7730 763 949

Media:

Drax External Communications: Ali Lewis
+44 (0) 7712 670 888

Website: www.drax.com

Forward Looking Statements
This announcement may contain certain statements, expectations, statistics, projections and other information that are or may be forward-looking. The accuracy and completeness of all such statements, including, without limitation, statements regarding the future financial position, strategy, projected costs, plans, investments, beliefs and objectives for the management of future operations of Drax Group plc (“Drax”) and its subsidiaries (the “Group”), including in respect of Pinnacle Renewable Energy Inc. (“Pinnacle”), together forming the enlarged business, are not warranted or guaranteed. By their nature, forward-looking statements involve risk and uncertainty because they relate to events and depend on circumstances that may occur in the future. Although Drax believes that the statements, expectations, statistics and projections and other information reflected in such statements are reasonable, they reflect the Company’s current view and beliefs and no assurance can be given that they will prove to be correct. Such events and statements involve significant risks and uncertainties. Actual results and outcomes may differ materially from those expressed or implied by those forward-looking statements. There are a number of factors, many of which are beyond the control of the Group, which could cause actual results and developments to differ materially from those expressed or implied by such forward-looking statements. These include, but are not limited to, factors such as: future revenues being lower than expected; increasing competitive pressures in the industry; and/or general economic conditions or conditions affecting the relevant industry, both domestically and internationally, being less favourable than expected; change in the policy of key stakeholders, including governments or partners or failure or delay in securing the required financial, regulatory and political support to progress the development of Drax and its operations. We do not intend to publicly update or revise these projections or other forward-looking statements to reflect events or circumstances after the date hereof, and we do not assume any responsibility for doing so.

END

2021 Adjusted EBITDA around top of current analyst expectations

Highlights

  • Major planned outage on CfD(1) unit completed on schedule
  • Incremental power sales on biomass ROC(2) units since July 2021 capturing higher prices
  • Commissioning of 550Kt of new biomass pellet production capacity in US Southeast
  • 2021 Adjusted EBITDA(3) – around the top end of current range of analyst expectations, subject to continued baseload generation on biomass units throughout December
  • Positive policy developments for biomass and framework for UK BECCS(4)

Pellet Production

In North America, the Group has made good progress integrating Pinnacle Renewable Energy Inc. (“Pinnacle”) since acquisition in April 2021 and is currently in the final stages of commissioning over 360Kt of new production capacity at Demopolis, Alabama. In October 2021, the Group commissioned a 150Kt expansion at its LaSalle plant in Louisiana and at Leola, Arkansas, a new 40Kt satellite plant is due to be commissioned in December.

These developments, along-side incremental new capacity in 2022, support the Group’s continued focus on production capacity expansion and cost reduction. Once fully commissioned, Drax will operate around 5Mt of production capacity across three major North American fibre baskets – British Columbia, Alberta and the US Southeast, of which around 2Mt are contracted to high-quality third-party counterparties under long-term contracts, with the balance available for Drax’s own-use requirements.

There has been no disruption to own-use or third-party volumes from the global supply chain delays currently being experienced in some other sectors. However, as outlined at the Group’s 2021 Half Year Results, summer wildfires led to pellet export restrictions in Canada. More recently, heavy rainfall and flooding in British Columbia have led to some further disruption to rail movements and regional supply chains. Through its enlarged and diversified supply chain Drax has been able to manage and limit the impact on biomass supply for own-use and to customers.

In addition, due to the Group’s active and long-term hedging of freight costs, there has been no material impact associated with higher market prices for ocean freight. The Group uses long-term contracts to hedge its freight exposure on biomass for its Generation business, and following the acquisition of Pinnacle, is taking steps to optimise freight requirements between production centres in the US Southeast and Western Canada, and end markets in Asia and Europe.

Generation

In the UK, the Group’s biomass and pumped storage generation assets have continued to play an important role providing stability to the UK power system at a time when higher gas prices, European interconnector issues, and periods of low wind have placed the system under increased pressure. The Group’s strong forward sold position means that it has not been a significant beneficiary of higher power prices from these activities in 2021 but has been able to increase forward hedged prices in 2022 and 2023.

In March, the Group’s two legacy coal units ended commercial generation activities and will formally close in September 2022 following the fulfilment of their Capacity Market obligations. Reflecting the system challenges described above, these units were called upon in the Balancing Mechanism by the system operator for limited operations in September and November. These short-term measures helped to stabilise the power system during periods of system stress and have not resulted in any material increase in the Group’s total carbon emissions.

In September, the Generation business experienced a two-week unplanned outage on one biomass unit operating under the ROC scheme. The unit’s contracted position in this period was bought back and the generation reprofiled across the two unaffected biomass ROC units and deferred until the fourth quarter. During this period, the Group’s pumped storage power station (Cruachan) provided risk mitigation from the operational or financial impact of any additional forced outages.

In November, the Generation business successfully completed a major 98 day planned outage on its biomass CfD unit, which included the third in a series of high-pressure turbine upgrades. Drax now expects the unit to benefit from thermal efficiency improvements and lower maintenance costs, incrementally reducing the cost of biomass generation at Drax Power Station.

Customers

The Group continues to expect the Customers business will return to profitability at the Adjusted EBITDA level for 2021, inclusive of an expected increase in mutualisation costs associated with the failure of a number of energy supply businesses in the second half of 2021. Separately, the Group is continuing to assess operational and strategic solutions to support the development of the SME(5) supply business.

Full year expectations

Reflecting these factors, the Group now expects that full year Adjusted EBITDA for 2021 will be around the top of the range of current analyst expectations(6), subject to good operational performance during December, including baseload running of all four biomass units. The Group’s financial expectations do not include any Balancing Mechanism activity in December for the coal units.

Drax continues to expect net debt to Adjusted EBITDA to return to around 2x by the end of 2022.

Negative emissions

In October, the UK Government selected the East Coast Cluster and Hynet as the first two regional clusters in the UK to take forward the development of the infrastructure required for carbon capture and storage. In addition, the UK Government published its Net Zero Strategy and Biomass Policy Statement, reaffirming the established international scientific consensus that sustainable biomass is renewable and indicating that it will play a critical role in helping the UK achieve its climate targets. It also signposted an ambition for at least 5Mt pa of negative emissions from BECCS and Direct Air Capture by 2030, 23Mt pa by 2035 and up to 81Mt pa by 2050. The reports commit the Government to the development during 2022 of a financial model to support the development of BECCS to meet these requirements.

The Group is continuing to progress its work on BECCS with the aim to develop 8Mt of negative CO2 emissions pa at Drax Power Station by 2030 and expects to make a decision on the commencement of a full design study in the coming weeks.

Generation contracted power sales

As at 25 November 2021, Drax had 34.3TWh of power hedged between 2021 and 2023 at £61.3/MWh as follows:

202120222023
Fixed price power sales (TWh)16.012.45.8
Of which ROC (TWh)10.810.15.8
Of which CfD (TWh)(7)(8)3.82.1-
Other (TWh)1.40.2-
Average achieved price (£ per MWh)54.070.7 61.2
Of which ROC (£ per MWh)56.961.161.2
Of which CfD (£ per MWh)(7)47.3118.3-
Of which Other (£ per MWh)50.058.2-

Since the Group’s last update on 29 July 2021, incremental power sales from the ROC units were 3.3TWh between 2022 and 2023, at an average price of £98.7/MWh.

Notes:
(1) Earnings before interest, tax, depreciation, amortisation, excluding the impact of exceptional items and certain remeasurements.
(2) BioEnergy Carbon Capture and Storage.
(3) Renewable Obligation Certificate.
(4) Contract for Difference.
(5) Small and Medium-size Enterprise.
(6) As at 26 November 2021 analyst consensus for 2021 Adjusted EBITDA was £380 million, with a range of £374-£391 million. The details of this company collected consensus are displayed on the Group’s website.
(7) The CfD biomass unit typically operates as a baseload unit, with power sold forward against a season ahead reference price. The CfD counterparty pays the difference between the season ahead reference price and the strike price. The contracted position therefore only includes CfD volumes and prices for the front six months.
(8) Expected annual CfD volumes of around 5TWh. Lower level of generation in 2021 unit due to major planned outage.

Enquiries:

Drax Investor Relations: Mark Strafford
+44 (0) 7730 763 949

Media:

Drax External Communications: Ali Lewis
+44 (0) 7712 670 888

Website: www.drax.com

Forward Looking Statements
This announcement may contain certain statements, expectations, statistics, projections and other information that are or may be forward-looking. The accuracy and completeness of all such statements, including, without limitation, statements regarding the future financial position, strategy, projected costs, plans, investments, beliefs and objectives for the management of future operations of Drax Group plc (“Drax”) and its subsidiaries (the “Group”), including in respect of Pinnacle Renewable Energy Inc. (“Pinnacle”), together forming the enlarged business, are not warranted or guaranteed. By their nature, forward-looking statements involve risk and uncertainty because they relate to events and depend on circumstances that may occur in the future. Although Drax believes that the statements, expectations, statistics and projections and other information reflected in such statements are reasonable, they reflect the Company’s current view and beliefs and no assurance can be given that they will prove to be correct. Such events and statements involve significant risks and uncertainties. Actual results and outcomes may differ materially from those expressed or implied by those forward-looking statements. There are a number of factors, many of which are beyond the control of the Group, which could cause actual results and developments to differ materially from those expressed or implied by such forward-looking statements. These include, but are not limited to, factors such as: future revenues being lower than expected; increasing competitive pressures in the industry; and/or general economic conditions or conditions affecting the relevant industry, both domestically and internationally, being less favourable than expected; change in the policy of key stakeholders, including governments or partners or failure or delay in securing the required financial, regulatory and political support to progress the development of Drax and its operations. We do not intend to publicly update or revise these projections or other forward-looking statements to reflect events or circumstances after the date hereof, and we do not assume any responsibility for doing so.

END

The jobs needed to build a net zero energy future

Many components are needed to tackle climate change and reach environmental milestones such as meeting the goals of the Paris Agreement. One of those components is the right workforce, large enough and with the necessary skills and knowledge to take on the green energy jobs of a low-carbon future. In 2020, the renewable energy sector employed 11.5 million people around the world, but as the industry continues to expand that workforce will only grow.

Last year, a National Grid report found that in the UK alone, 120,000 jobs will need to be filled in the low-carbon energy sector by 2030, to meet the country’s climate objectives. That figure is expected to rise to 400,000 by 2050.  The UK energy sector as a whole currently supports 738,000 jobs and much of this workforce already has the skills needed for a low carbon society . Others can be reskilled and retrained, helping to bolster the future workforce by supporting employees through the green transition.

At a global level energy sector jobs are expected to increase from 18 million to 26 million by 2050. Jobs that will span the full energy spectrum; from researching and advising on low-carbon solutions to installing and implementing them.

Here are some of the roles that will be key to the low-carbon energy transformation:

A wind farm under construction off the English coast

Wind turbine technicians

According to the International Energy Agency (IEA), wind power is this year set for a 17% increase in global energy generation compared to 2020, the biggest increase of any renewable power source. The IEA also forecasts that wind power will need to grow tenfold by 2050 if the world is to meet the goals of the Paris Agreement. It’s not surprising, therefore, that wind turbine technicians – the professionals who install, inspect, maintain, and repair wind turbines – are in high demand. In the US, wind turbine technician is the fastest-growing job in the country – with 68% growth projected over the 2020-2030 period – to give just one example.

In the UK, many wind turbine technicians have a background in engineering or experience from the wider energy sector. Although there are wind turbine technician and maintenance courses available, they are not a prerequisite, and many employers offer apprenticeships and on-the-job training – smoothing the path for energy professionals to transition into the role.

Solar panel installers

Today, solar photovoltaic (solar PV) is the biggest global employer in renewable energy, accounting for 3.8 million jobs. The IEA also reported a 23% uptick in solar PV installations around the world in 2020. In the UK, there are currently 13.2 gigawatts (GW) of installed solar power capacity. Trade association Solar Energy UK predicts this will need to rise to at least 40 GW by 2030 if the UK is to succeed in becoming a net zero economy by 2050. The trade association believes this could see the creation of 13,000 new solar energy jobs.

Solar panel installers – who carry out the important job of installing and maintaining solar PV – are essential to a low-carbon future. Many solar panel installers in the UK come from a background in electrical installation or have transitioned from engineering. While there are training courses specifically designed for solar panel installers, they are not a necessity, particularly if you already have on-the-job experience in a relevant sector. This makes a move to becoming a solar panel installer relatively easy for someone already working in energy or with a mind for engineering.

Energy consultants

Businesses of all kinds must play a role in the transition to net zero. Organisations must be able to manage their energy use and begin switching to renewable sources. As professionals who advise companies on this process, renewable energy consultants are a key part of the green energy workforce. Aspects of the job include identifying how organisations use their electric assets and helping businesses optimise those assets to build responsiveness and flexibility into energy-intensive operations. The core responsibilities of a renewable energy consultant are to reduce a company’s environmental impact while helping the business reduce energy costs and identifying opportunities.

Carbon accountants

A growing number of businesses are setting targets for reducing their greenhouse gas (GHG) emissions. But that’s only possible if you can first determine what your GHG emissions are and where they come from, which is where the relatively young field of carbon accounting comes in. Through what is known as physical carbon accounting, companies can assess the emissions their activities generate, and where in the supply chain the emissions are occurring. This allows businesses to implement more accurate actions and be realistic in their timelines for reducing emissions.

On a wider scale, accurate carbon accounting will be crucial in certifying emissions reductions or abatement, as well as in the distribution of carbon credits or penalties as whole economies push towards net zero.

Battery technology researchers

Energy storage is essential to a low-carbon energy future.  The ability to store and release energy from intermittent sources such as wind and solar will be crucial in meeting demand and balancing a renewables-driven grid. While many forms of energy storage already exist, developing electric batteries that can be deployed at scale is still a comparatively new and expanding area.

Global patenting activities in the field of batteries and other electricity storage increased at an annual rate of 14% –  four times faster than the average for technology – between 2005 and 2018. However, it’s estimated that to meet climate objectives, the world will need nearly 10,000 GW hours of battery and other electricity storage by 2040. This is 50 times the current level and research and innovation will be crucial to delivering bigger and more efficient batteries.

Farmers and foresters

How we use and manage land will be important in lowering carbon emissions and creating a sustainable future for people and the planet. Crops like corn, sugarcane, and soybean can serve as feedstock for biofuel and bioenergy, and farming by-products such as cow manure can be used in the development of biofuel.

Techniques adopted in the agricultural sector will also be important in optimising soil sequestration capabilities while ensuring it is nutrient-rich enough to grow food. These techniques include the use of biochar, a solid form of charcoal produced by heating biomass without oxygen. Research indicates that biochar can sequester carbon in the soil for centuries or longer. It also helps soil retain water and could contribute to reducing the use of fertilisers by making the soil more nutrient-dense.

Forests, meanwhile, provide material for industries like construction, the by-products from which can serve as feedstock for woody biomass, primarily in the shape of low-grade wood that would otherwise remain unused. Sustainably managed forests, such as those from which Drax sources its biomass, have two-fold importance. They both enable woody biomass for bioenergy and ensure CO2 is removed from the atmosphere as part of the natural carbon cycle.

Biofuel engineers and scientists

Farmers and foresters provide feedstock for biofuels, but it’s biofuel scientists and engineers who research, develop, and enhance them, opening the door to alternative fuels for vehicles, heating, and even jet engines.

According to the IEA, production of biofuel that can be used as an alternative to fossil fuels in the transport sector grew 6% in 2019. However, the organisation forecasts that production will need to increase 10% annually until 2030to be in line with Paris Agreement climate targets.

Scientific innovations that can help boost the production of biofuel around the world, therefore, continues to be vital. As is the work of biofuel engineers who assess and improve existing biofuel systems and develop new ones that can replace fossil fuels like petrol and diesel.

The wealth of knowledge around fuels in the oil and gas industries means there is ample opportunity for scientists and engineers who work with fossil fuels to bring their skills to crucial low-carbon roles.

Geologists

The overriding goal of the Paris Agreement is to limit global warming to “well below” 2 and preferably to 1.5 degrees Celsius, compared to pre-industrial levels. This is an objective the IEA has said will be “virtually impossible” to fulfil without carbon capture and storage (CCS) technologies. CCS entails capturing CO2 and transporting it for safe and permanent underground storage in geological formations such as depleted oil and gas fields, coal seams, and saline aquifers.

According to the Global CCS Institute, the world will need a 100-fold increase on the 27 CCS project currently in operation by 2050. Knowledge and research into rock types, formations, and reactivity will be important in helping identify sites deep underground that can be used for safe, permanent carbon storage, and sequestration. Skills and expertise gained in the oil and gas industries will allow professionals in these sectors to make the switch from careers in fossil fuel to roles that help power a net zero economy.  

Employees working at Drax Power Station

Chemists

The role of chemists is also vital to decarbonisation. Knowledge and research around CO2 is a potent force in the effort to reduce and remove it from the atmosphere.

Technologies like CCS, bioenergy with carbon capture and storage (BECSS) and direct air carbon capture and storage (DACCS) are based around such research. Carbon capture processes are chemical reactions between emissions streams and solvents, often based on amines, and GHGs. Understanding and controlling these processes makes chemistry a key component of delivering carbon capture at the scale needed to help meet climate targets.

Chemists’ role in decarbonisation is far from limited to carbon capture methods. From battery technology to reforestation, chemists’ understanding of the elements can help drive action against climate change.

Bringing together disciplines

Tackling climate change on the scale needed to achieve the aims of the Paris Agreement depends on collaboration between industries, countries, and disciplines. Decarbonisation projects such as the UK’s East Coast Cluster, which encompasses both Zero Carbon Humber and Net Zero Teesside, fuse engineering and construction jobs with scientific and academic work.

Zero Carbon Humber, which brings together 12 organisations, including Drax, is expected to create as many as 47,800 jobs in the region by 2027. Among these are construction sector jobs for welders, pipefitters, machine installers and technicians. In addition, indirect jobs are predicted to be created across supply chains, from material manufacturing to the logistics of supporting a workforce.

Meeting climate challenges and delivering projects on the scale of Zero Carbon Humber, depends on creating an energy workforce that combines the knowledge of the past with the green energy skills of the future.

Drax’s apprenticeships have readied workers for the energy sector for decades, and will continue to do so as we build a low-carbon future. Options include four-year technical apprenticeships in mechanical, electrical, and control and instrumentation engineering. Getting on-the-job training and practical experience, apprentices receive a nationally recognised qualification, such as a BTEC or an NVQ Level 3, at the end of the programme.

Apprentices at Drax Power Station [2021]

The workforce needed to make low carbon societies a reality will be a diverse one – stretching from apprentices to experienced professionals with a background in traditional or renewable energy. It will also span every aspect of the renewable energy field, from the chemists and biofuel scientists who develop key technologies to the solar panel installers and wind turbine technicians who fit and maintain the necessary equipment.

The skills needed to take on these roles are already plentiful in the UK and around the world. Overcoming challenges on the road to net zero requires refocussing these existing talents, skills, and careers towards a new goal.