Tag: biomass

Trading Update – Strong performance and options to invest

RNS Number: 0978L
Drax Group plc
(“Drax” or the “Group”; Symbol:DRX)

Highlights

  • Strong performance – FlexGen(1), Pellet Production and Biomass Generation
  • Full year 2025 expectations for Adj. EBITDA(2) around the top end of consensus estimates(3)

Adj. EBITDA and free cash flow targets from existing business

  • Continuing to target post 2027 Adj. EBITDA of £600-700 million pa(4)
  • Targeting £3 billion of free cash flow(5) from the existing business (2025 to 2031), supporting:
    • >£1 billion returns to shareholders
    • Up to c.£2 billion for options to invest in growth

Options to invest in growth – energy security, data centres and flexible, renewable energy

  • FlexGen – flexible, renewable energy, including GW scale pipeline of BESS(6) opportunities
  • Drax Power Station site – development of options to utilise 4GW of capacity and grid access
    • Planning application in development for potential option for c.100MW data centre
    • Ambition to grow to >1GW data centre post 2031
    • Potential to further develop system support capabilities and FlexGen

Drax Group CEO, Will Gardiner said:

“It is vital that the UK maintains its energy security and delivers affordable routes to decarbonisation into the 2030s and beyond. Drax stands ready to invest in and grow our portfolio to deliver the renewable and flexible power the country needs while also supporting economic growth in the communities where we operate.

“By 2050, demand for power is expected to double, while secure gas generation reduces and intermittent renewable generation increases, meaning more dispatchable and reliable generation will be required to help keep the lights on when the wind isn’t blowing and the sun isn’t shining.

“Aligned to the UK’s future energy needs and underpinned by a strong balance sheet, good cash generation, and a disciplined approach to capital allocation, we are working to maximise the value of our existing portfolio, while driving growth over the short, medium and long term.

“Our year to date operational and financial performance has been strong, and we are focused on delivering c.£3 billion of free cash flow between 2025 and 2031, which can support investment in energy security, data centres and flexible, renewable energy underpinning long-term value creation and returns to shareholders.”

Full year expectations

Reflecting a strong performance across the Group in the second half of 2025, Drax now expects 2025 full year Adj. EBITDA to be around the top end of consensus estimates(3). Full year expectations remain subject to continued good operational performance.

Generation contracted power sales

As at 9 December 2025, Drax had c.£2.3 billion of contracted forward power sales between 2025 and Q1 2027 on its Renewables Obligation (RO) biomass, pumped storage and hydro generation assets. RO generation is fully hedged for 2025 and 2026, with over £1 billion of associated ROCs.

Contracted power sales as at 9 December 2025202520262027Total
Net RO, hydro and gas (TWh)(7)10.710.92.223.7
Average achieved £ per MWh(8)117.176.779.495.1
Contract for Difference (CfD) (TWh)4.81.8-6.5

Capital returns

In October 2025, the Group completed a £300 million share buyback programme which had commenced in August 2024. The Group subsequently began a £450 million share buyback programme (first announced in July 2025), with an initial £75 million tranche. In aggregate, during 2025, up to 9 December 2025, the share buyback programmes have purchased c.33 million shares for c.£216 million. The total number of voting rights in Drax Group, excluding treasury shares, as at 9 December 2025 was c.341 million. In October 2025 an interim dividend of 11.6 pence per share was paid, totalling c.£40 million.

Outlook

Adj. EBITDA and free cash flow targets from existing business

The Group is continuing to target post 2027 Adj. EBITDA of £600-700 million pa before development expenditure. Delivery of this target is underpinned by disciplined cost management and an operating model adapted to reflect the structure of the recently signed low-carbon, dispatchable CfD agreement with the Low Carbon Contracts Company (a UK Government body) for Drax Power Station, combined with a high-performance culture.

Reflecting growing UK power demand, combined with an increased system reliance on intermittent and inflexible generation, Drax expects to grow its FlexGen business to comprise a greater proportion of total Adj. EBITDA over time.

Open Cycle Gas Turbines (OCGTs) will be a key component of the FlexGen portfolio. The flexibility of these grid balancing assets can enable the increased use of intermittent renewables across the UK system, supporting energy security and a reduction in net carbon emissions. Reflecting these factors, Drax now expects to retain these assets as a part of its FlexGen portfolio.

Taking strong cash flows from the current business (2025-2026) together with targeted Adj. EBITDA (2027-2031), plus working capital, less maintenance capex, interest and tax, Drax is targeting free cash flow of c.£3 billion (2025-2031)(5).

The Group’s capital allocation policy remains unchanged. Drax expects to initially allocate >£1 billion of free cash flow to shareholder returns (2025-2031). This is inclusive of the ongoing £450 million three-year share buyback programme and the continuation of its long-standing policy to pay a sustainable and growing dividend, through which the dividend per share has grown on average by 11% pa since 2017.

Drax expects to allocate up to c.£2 billion to incremental investment, primarily in the flexible and renewable energy the UK needs, as well as opportunities to maximise value from the Drax Power Station site.

Returns to shareholders and investment for growth follow a capital ranking process which aims to maximise risk adjusted returns to shareholders.

Options to invest in growth – FlexGen – flexible, renewable energy

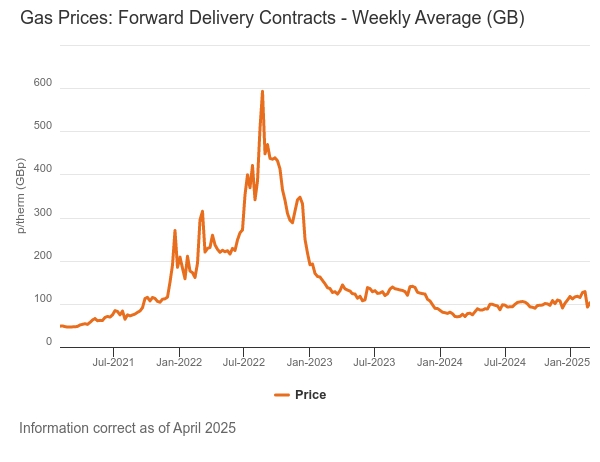
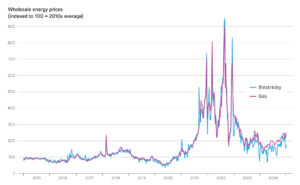
The UK National Energy System Operator’s Future Energy Scenarios indicate a doubling of power demand by 2050, via electrification and new sources of demand, including data centres. At the same time, the continued decarbonisation of the system is leading to a greater reliance on intermittent renewables. The system is becoming cleaner but more volatile, driving a growing need for dispatchable power and system support services, creating long-term earnings opportunities for, and value from, the Group’s FlexGen assets. While the trend is clear, it is hard to forecast from year to year, being dependent on weather and associated renewable activity as much as underlying commodity prices.

This position informs the Group’s view on the value of its FlexGen portfolio and opportunities for growth which can support energy security and the continued deployment of renewables. Since acquisition of the pumped storage and hydro assets in 2018, utilisation of these assets has increased significantly, delivering a five-year payback.

Pumped Storage and Hydro

An £80 million investment to refurbish and upgrade two units at Cruachan Power Station is progressing, with an initial planned outage programme through 2025. The project, which is underpinned by 15-year Capacity Market agreements worth over £220 million (c.£15 million Adj. EBITDA pa), will add 40MW of additional capacity by 2027 and improve unit operations. An additional planned outage programme associated with a transformer upgrade is expected to complete shortly.

OCGTs

Drax expects to take commercial control of the first of the three OCGTs (Hirwaun Power) in Q1 2026. The unit is now commissioning and receiving capacity market payments. The second and third sites are expected to commence commissioning in 2026.This is later than originally planned, primarily due to delays in grid connection by the relevant authorities.

Inclusive of the OCGTs Drax remains committed to its validated SBTi(9) targets and continues to assess options to realise this commitment.

BESS

The Group sees BESS as an important new technology for its FlexGen portfolio, adding fast response capabilities to long duration pumped storage and OCGT assets, which could allow the portfolio to provide a wider range of system support services to the grid.

Drax is developing a GW scale pipeline of BESS opportunities comprised of (1) physical assets and (2) the capabilities to optimise third-party assets with the provision of route to market, floor and tolling structures. In this regard, Drax already provides a route to market for c.2,000 embedded third-party renewable assets with capacity of c.800MW via its Energy Solutions business.

In October 2025, Drax signed an agreement with Apatura Limited (“Apatura”) to acquire three BESS projects, which when fully commissioned will provide capacity totalling 260MW. Drax will pay a fixed amount of £157.2 million in staged payments between 2025 and 2028, reflecting construction milestones and including payments to Apatura linked to their delivery of the projects. The acquisition of the Marfleet (England) and Neilston (Scotland) projects is now complete, with the acquisition of the East Kilbride (Scotland) project expected to be finalised in 2026.

The Group is also assessing options for other renewables, which can complement its FlexGen model.

Options to invest in growth – Drax Power Station Site

The Drax Power Station site comprises over 1,000 acres and 4GW of capacity and grid access, with 2.6GW of active dispatchable generation, cooling systems, and proximity to the UK fibre network.

The Group is focused on options to maximise value from the site, which could utilise multiple generation technologies including its existing biomass generation as well as flexible, renewable energy, to continue to support energy security, while potentially meeting the power demands of a large-scale data centre and in the long-term the potential for carbon removals from BECCS(10).

Data centre

Drax is considering a range of options for the site which could utilise its existing land, grid access, active generation, cooling solutions, site security, location and skilled workforce to meet the needs of data centre developers.

Drax is preparing a planning application to support the potential option for a first phase data centre of c.100MW on land identified at Drax Power Station, using existing infrastructure and transformers previously used to support coal generation to import power directly from the grid (front-of-the-meter). This could support the operation of a data centre at Drax Power Station as soon as 2027.

In November 2025, Drax signed a CfD agreement with the UK Government to provide c.6TWh of biomass generation pa between April 2027 and March 2031 – equivalent to c.30% of baseload output – with a strike price of £109.90/MWh (2012 real). In addition to the option to produce additional merchant generation above the cap and for system support and ancillary services, the agreement includes a mechanism for Drax to request up to 500MW to power a data centre during this period. This is subject to agreement with the UK Government, taking into account a number of factors, including value for money for consumers, energy security, and sustainability.

In the long term Drax is assessing options for over 1GW of data centre capacity, which is expected to utilise existing generation capabilities at Drax Power Station to provide a distributed (behind-the-meter) energy solution with around-the-clock renewable power directly to a data centre under a long-term Power Purchase Agreement, subject to necessary consents.

Any decision to develop data centres at Drax Power Station will require a full assessment of the capital cost and investment case as well as establishment of the commercial and development structures, including joint ventures.
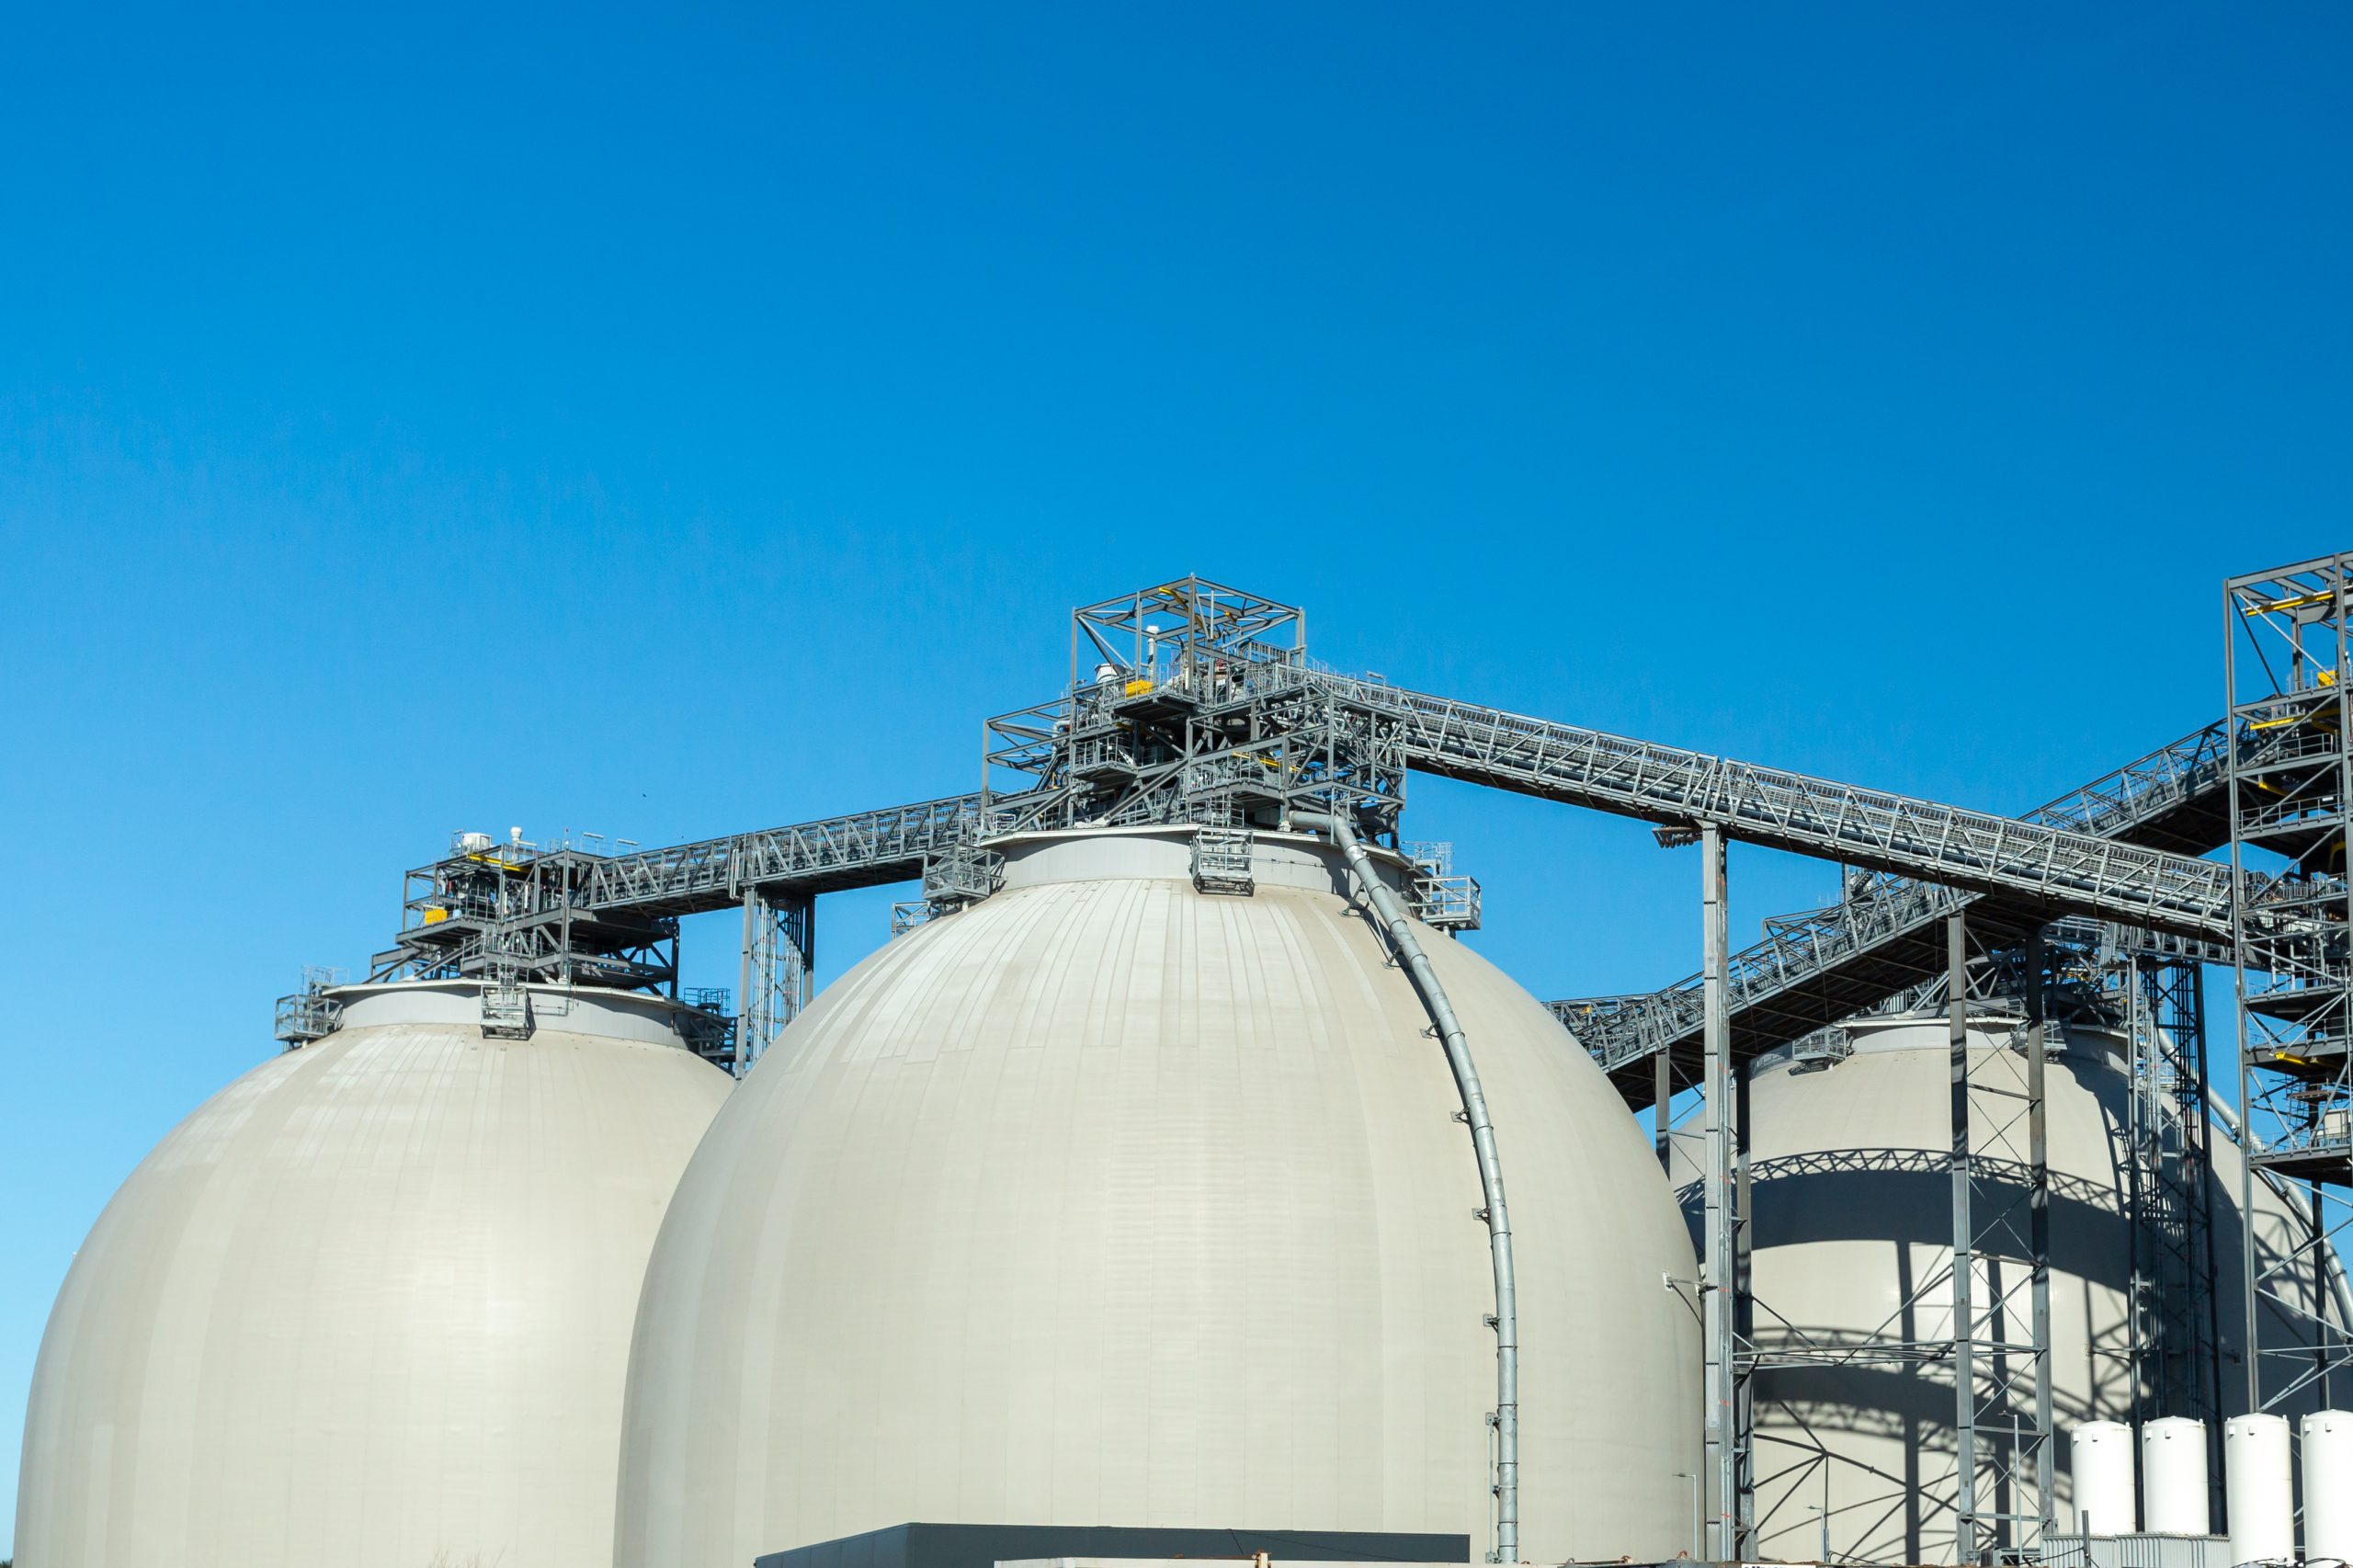
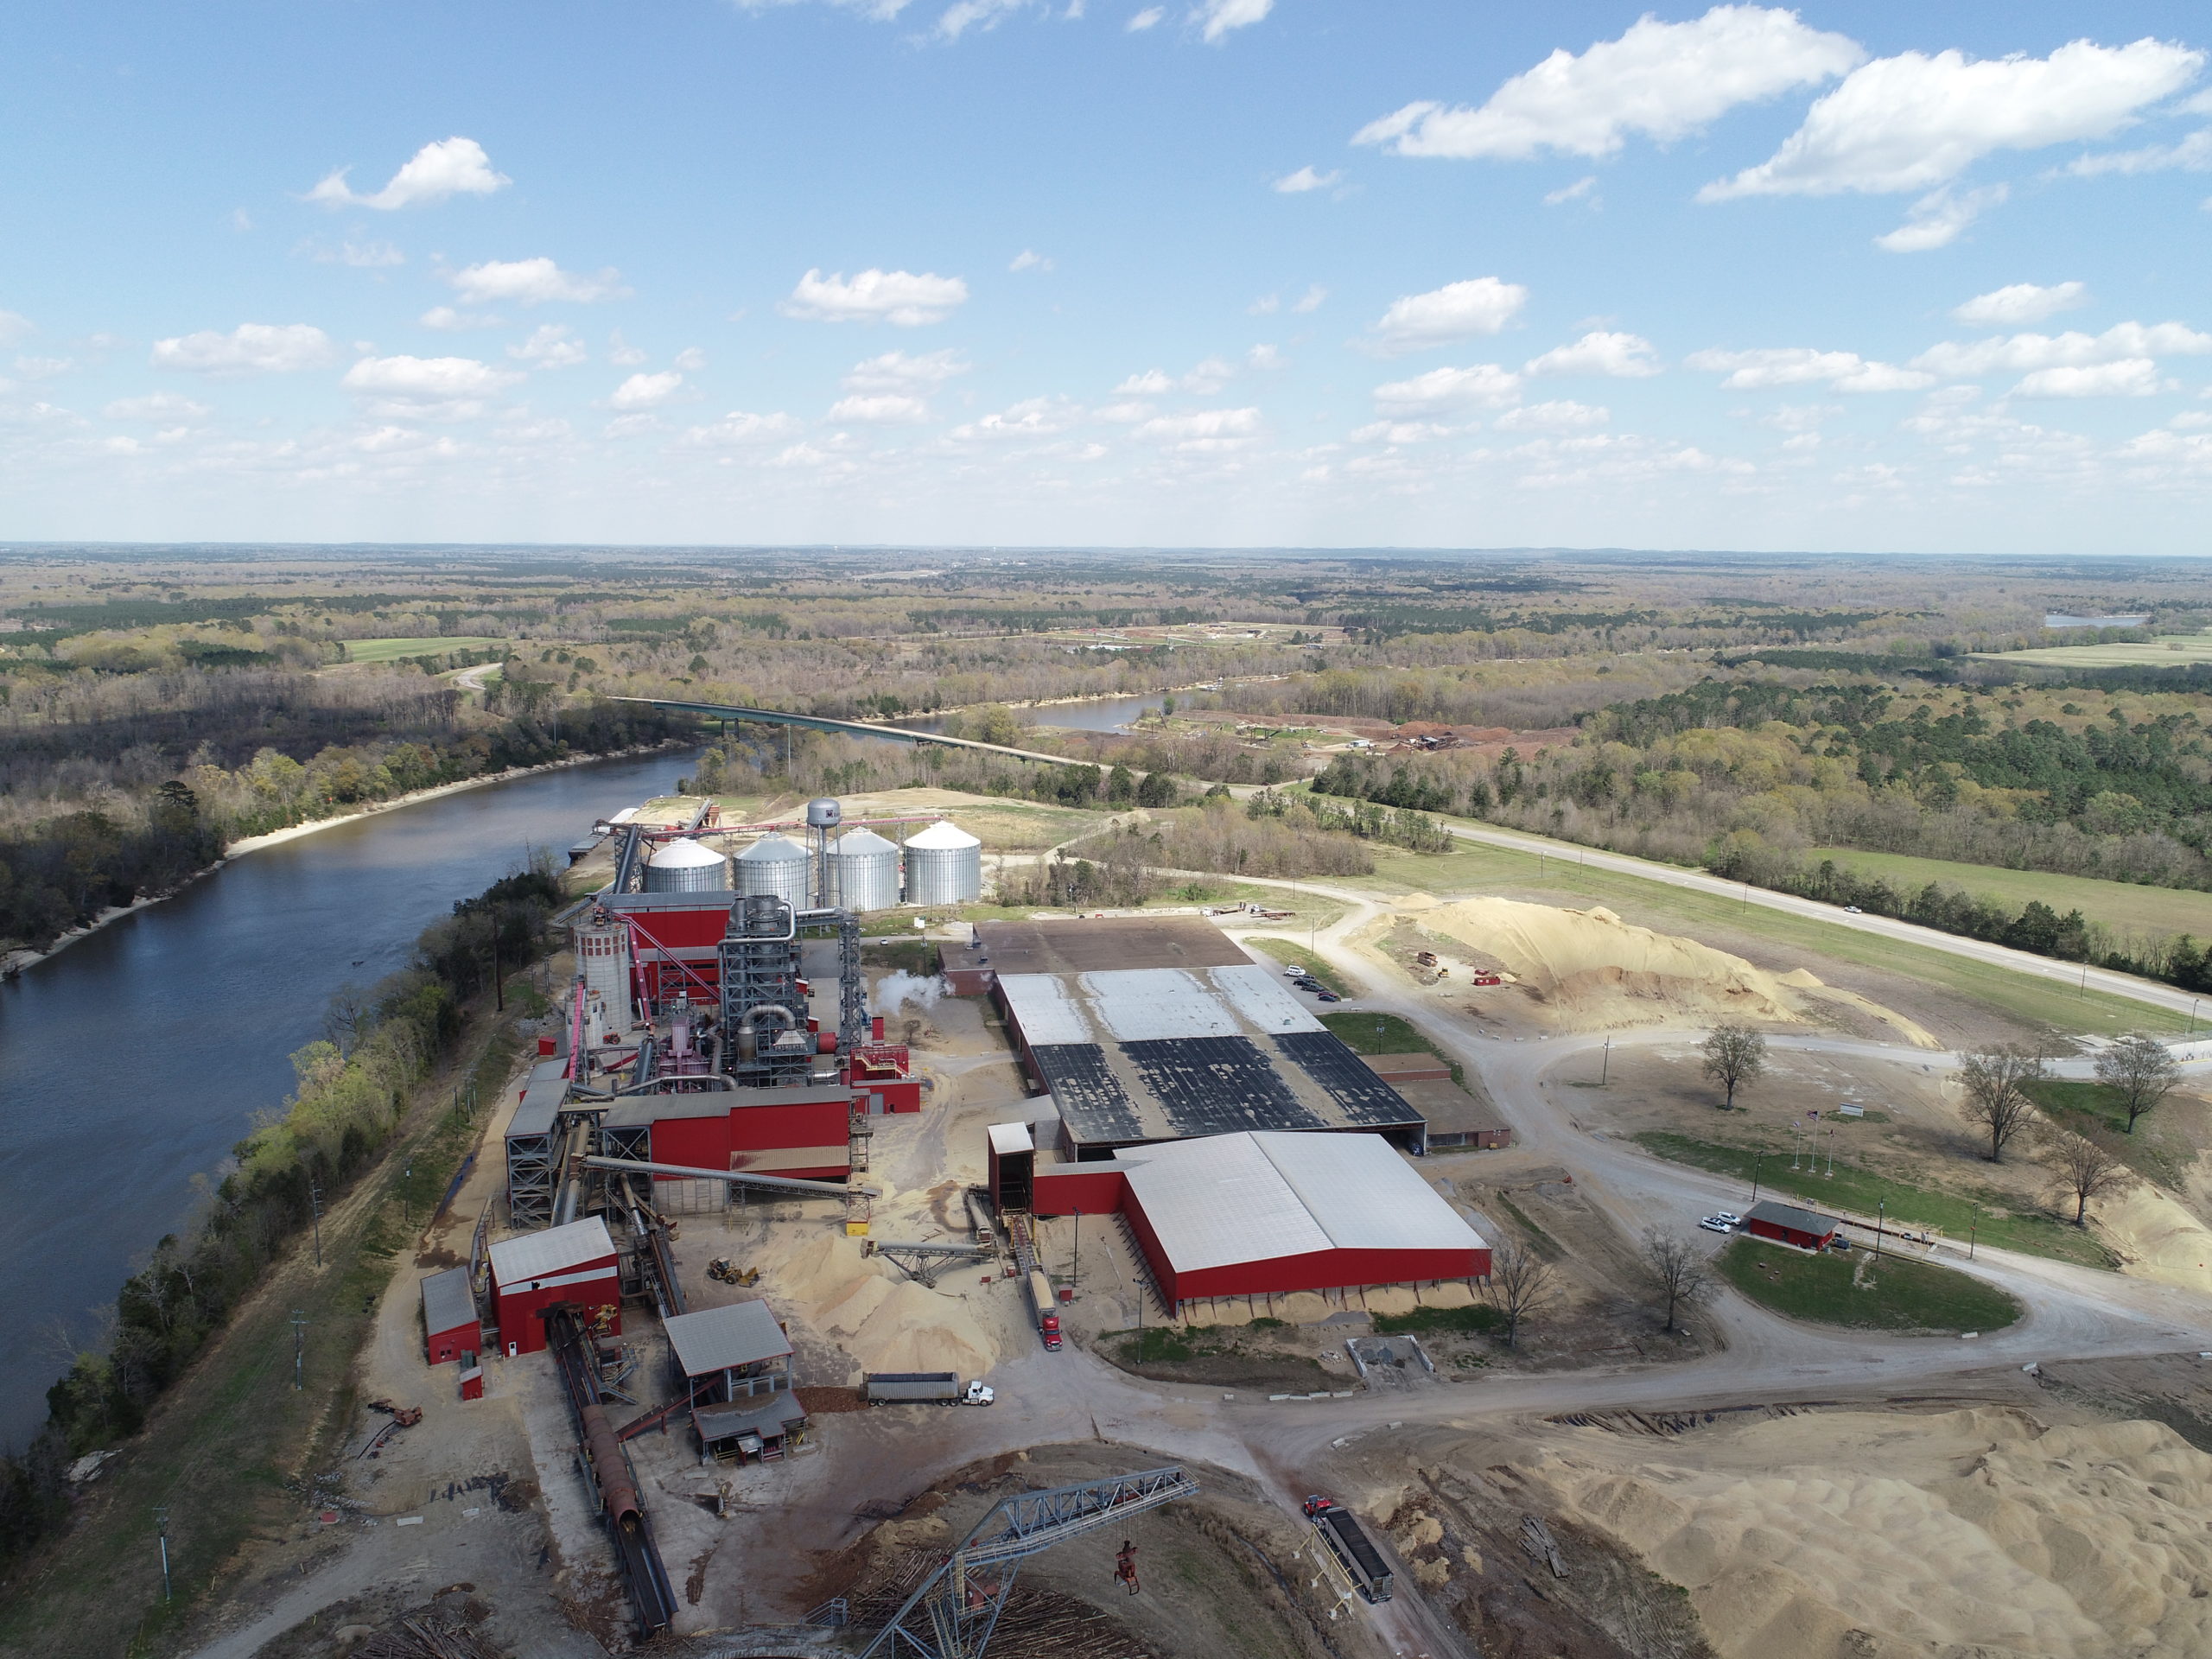
Pellet Production

In the medium term, the Group’s US business is well underpinned by sales into the UK. The Group’s Canadian business, which primarily sells pellets into Asia, is expected to be more challenged, which has contributed to the decision to close Drax’s pellet plant in Williams Lake. Against this backdrop the Group does not currently expect to invest in additional capacity in the short to medium term, including the paused Longview project.

In the long term, Drax remains positive on biomass’ role in industrial decarbonisation and carbon removals via its Elimini business. Drax is continuing to assess options for own-use and third-party sales, from existing and new markets, including Sustainable Aviation Fuel, which could represent a major market opportunity from 2030 onwards.

Other matters

Drax will report its full year results on Thursday 26 February 2026.

Notes:

  1. Flexible Generation (FlexGen) is currently comprised of the Group’s pumped storage and hydro assets, three OCGT plants which are expected to enter commercial service in 2026 and an Energy Solutions business which provides renewable energy and services to I&C customers as well as a route to market for small renewable assets.
  2. Earnings before interest, tax, depreciation, amortisation, excluding the impact of exceptional items and certain remeasurements. Adj. EBITDA includes the Electricity Generator Levy (EGL).
  3. As of 4 December 2025, analyst consensus for 2025 Adj. EBITDA was £902 million, with a range of £892 – £909 million. The details of this consensus are displayed on the Group’s website.
    Consensus – Drax Global
  4. Excludes investment opportunities including development expenditure in Elimini, Innovation, Capital Projects and Other.
  5. Free cash flow pre-dividend, including targets for post 2027 Adj. EBITDA, c.£0.5 billion working capital inflow from end of RO scheme, maintenance capex, interest, taxes and EGL.
  6. Battery Energy Storage System.
  7. Includes <0.1TWh of structured power sales in 2026 and 2027 (forward gas sales as a proxy for forward power), transacted for the purpose of accessing additional liquidity for forward sales from RO units and highly correlated to forward power prices.
  8. Presented net of cost of closing out gas positions at maturity and replacing with forward power sales.
  9. Science Based Targets Initiative.
  10. Bioenergy with Carbon Capture and Storage.

Enquiries:

Drax Investor Relations:
Mark Strafford
[email protected]
+44 (0) 7730 763 949

Chris Simpson
[email protected]
+44 (0) 7923 257 815


Media:

Drax External Communications:
Chris Mostyn
[email protected]
+44 (0) 7743 963 483

Andy Low
[email protected]
+44 (0) 7841 068 415

Website: www.Drax.com

Forward Looking Statements

This announcement may contain certain statements, expectations, statistics, projections, and other information that are, or may be, forward looking. The accuracy and completeness of all such statements, including, without limitation, statements regarding the future financial position, strategy, projected costs, plans, beliefs, and objectives for the management of future operations of Drax Group plc (“Drax”) and its subsidiaries (the “Group”), are not warranted or guaranteed. By their nature, forward-looking statements involve risk and uncertainty because they relate to events and depend on circumstances that may occur in the future. Although Drax believes that the statements, expectations, statistics and projections and other information reflected in such statements are reasonable, they reflect Drax’s current view and no assurance can be given that they will prove to be correct. Such events and statements involve risks and uncertainties. Actual results and outcomes may differ materially from those expressed or implied by those forward-looking statements. There are a number of factors, many of which are beyond the control of the Group, which could cause actual results and developments to differ materially from those expressed or implied by such forward-looking statements. These include, but are not limited to, factors such as: future revenues being lower than expected; increasing competitive pressures in the industry; uncertainty as to future investment and support achieved in enabling the realisation of strategic aims and objectives; and/or general economic conditions or conditions affecting the relevant industry, both domestically and internationally, being less favourable than expected, including the impact of prevailing economic and political uncertainty, the impact of conflict including those in the Middle East and Ukraine, the impact of cyber-attacks on IT and systems infrastructure (whether operated directly by Drax or through third parties), the impact of strikes, the impact of adverse weather conditions or events such as wildfires, changes to the regulatory and compliance environment within which the Group operates. Drax do not intend to publicly update or revise these projections or other forward-looking statements to reflect events or circumstances after the date hereof, and we do not assume any responsibility for doing so.

END


How Wood Pellets Support Clean Energy Goals, Forests, and Communities

By Kyla Cheynet, Director of Sustainability, Drax

When we think of clean energy, solar panels and wind turbines often dominate the conversation, but as we work to enable a zero carbon, lower cost energy future, it’s going to take all clean energy industries working together. Biomass, in the form of wood pellets, has been quietly making a big impact by helping countries reduce carbon emissions, support sustainable forestry, and transition away from fossil fuels. 

What Are Wood Pellets? 

At Drax, we operate within the larger forest industry, making our wood pellets from sawmill residues and low-grade wood from the forest. Mill residuals come in the form of shavings, sawdust and chips, while material sourced from sustainable harvests comes from tree trunks, tops, and limbs which are too small or malformed to make sawtimber.  Wood that arrives in roundwood form is debarked and chipped on-site, with bark being used as fuel to dry the high-moisture chips and sawdust.  Once the fiber is dried it, is resized by “hammermills” into a very small particles which are then compressed under high pressure by “pellet mills” which cause the natural resins in the wood to bind together forming small wood pellets that look just like those used for pellet burning grills or home heating.  The wood pellets we produce are: 

  • Renewable: Sourced from sustainably managed forests and manufacturing residuals. 
  • Efficient: Low moisture content means high energy output. 
  • Easily transported: Pellets can be loaded on trucks, railcars, and ships with ease.  

Supporting Sustainable Forestry 

The forests that we source our biomass from are managed in accordance with best practices designed to support the health and growth of these forests over the long term.   We have strict criteria in place to ensure our fiber sourcing helps maintain or improve forest health, landscape-level carbon stocks, biodiversity, and forest-related values communities depend on.  

In the U.S. South, forest inventory has expanded rapidly in recent decades, largely due to improved forest management on private lands These vigorously growing forests are considered a wood basket to the world.  Active forest management is essential to maintaining the productivity and ecological value of these forests.  Thinning, an intermediate harvest aimed at reducing tree density, is essential to maintaining forest health. Thinning not only increases future sawtimber yields by allocating greater resources to “crop trees”, but also improves the forest’s resilience to pests, disease, and wildfire, all while enhancing understory plant diversity and wildlife habitat. 

Most trees removed during thinning operations are generally undersized or unsuitable for lumber, but they are ideal for producing wood pellets! In this way, the biomass market creates an incentive for managers to engage in practices that increase the health and vigor of forests on their land. 

Why Is This Important? 

At Drax, our mission is to help meet the world’s increasing demand for secure energy, sustainably. Sustainably sourced biomass plays an important role in supporting energy security as the world decarbonizes, displacing fossil fuels with renewable, dispatchable power that supports intermittent renewables like wind and solar.  

Biomass markets also bring business to rural communities. In addition to direct employment opportunities in manufacturing Drax’s operations supports hundreds of jobs throughout the larger forest industry in Mississippi. Drax pellet plants also create market opportunities for landowners hoping to generate a return on their forest investment.  Markets for low-grade biomass incentivize landowners to continue managing forests rather than converting or selling them off to other uses.  And we all benefit when forests remain forests!

To learn more about Drax’s impact in Gloster, Mississippi, visit www.drax.com/gloster  

Price matters – lowering the cost of the energy transition

  • Analysis by Baringa shows that Drax Power Station, operating under a new low-carbon dispatchable CfD, will lower the costs of the UK clean energy transition between 2027 and 2031 by £1.6 to 3.1bn, compared with a scenario without Drax.
  • When there isn’t enough electricity from weather dependent renewables to meet demand, Drax will step in to increase generation.
  • This brings down the amount of costly ‘standby’ capacity the Government needs to buy on the capacity market to avoid shortages
  • It also makes the UK less reliant on gas and imports via interconnectors, reducing the upwards influence they have on the wholesale cost of energy.
  • By displacing gas, Drax will reduce emissions from the electricity sector by approximately 4 MtCO2 between 2027 and 2031 – equivalent to taking 1.5 million diesel or petrol cars off the road.   

Over the next six years, the UK will increasingly rely on electricity generated by intermittent renewables and, by 2030, wind and solar will provide the majority of our electricity.

Drax Power Station will play an essential supporting role, stepping up generation when windless, gloomy weather causes wind and solar output to drop, and stepping down again to balance the grid when the weather changes.

As a clean energy source, its flexibility to do this is rare. Nuclear, for instance, provides a steady flow of clean electricity, but it can’t be turned up and down in the same way Drax’s biomass generation units can.

The Government has designed a new low carbon dispatchable CfD to support Drax’s flexible generation between 2027 and 2031.

Analysis by Baringa shows that this lowers the costs of the clean energy transition between 2027 and 2031 by between £1.6 – 3.1bn. There are two major factors in this: lower capacity market costs and Drax’s impact on the wholesale costs of electricity. These are explained in more detail below.

Reduced capacity market payments

The capacity market is colloquially referred to as the UK’s black out prevention system. It works by paying some energy generators to have extra ‘standby’ capacity available, which can then be drawn on when there is a shortage of electricity.

Prices in the capacity market vary from year to year and are affected by the amount of existing guaranteed capacity in the market – the more that there is, the less that needs to be procured in the capacity market, and the lower the price.

Drax Power Station provides 2.6GW of capacity. That’s more than any other single source in the UK and more than double the capacity of the average gas power station. It’s also more than the combined capacity of the UK’s two largest operational nuclear power stations – Heysham 2 and Torness (2.4 GW). *

Having it on the system brings down prices in the capacity market as the Government needs to purchase less capacity. Baringa estimate that this saves the UK between £640m and £1bn from 2027 to 2031.

Reduced wholesale energy cost

Electricity generated at Drax Power Station will make the UK less reliant on gas and interconnector imports. Both are typically expensive, particularly in the winter months when high demand in the UK and Europe, as well as Asia, pushes up prices.

For instance, when the UK was hit with a period of cold, gloomy windless weather in early January, demand increased as supply from wind and solar plummeted and the UK called on additional gas and imports to fill the gap. Power prices briefly surged to £2,900/MWh (40 times their average) as a result.

Research by Baringa estimates that Drax Power Station will reduce gas generation by around 4.3% and imports by almost 4.9%. This brings down the wholesale electricity price, saving £1.8bn compared to a counterfactual scenario without Drax, and potentially more if the price of gas is higher than anticipated.

Drax Power Station also reduces the UK’s exposure to ongoing price volatility in these markets, which influences the wholesale prices of energy in the UK on an ongoing basis. For example, the price of gas shot up by 130% when Russia invaded Ukraine in 2022 and, as the graph below shows, it continues to fluctuate.

Displacing gas reduces fossil fuel use and cuts carbon

Displacing gas not only has a price benefit, it lowers fossil fuel use. In the case of the low-carbon, dispatchable CfD with Drax, reducing emissions from the energy sector by 1 million tonnes CO2e per year (4 MtCO2e over the course of the four-year term). This equates to c.5% of total power sector emissions and is equivalent to taking 1.5 million diesel or petrol cars off the road.

Overall, as the UK moves to a clean energy system, Drax makes sense for consumers and the climate. Beyond 2030 there is also the potential to add carbon capture and storage technology to Drax Power Station, converting it to BECCS. This could create the world’s largest carbon removal facility; saving the UK £15bn on its path to net zero and helping position us at the leading edge of an exciting new technology area that will be critical to meeting global climate targets.

Report: ‘Value for money assessment of the low carbon dispatchable CfD for Drax Power Station’, Baringa (2025) can be read in full here


Leading the way with transparency and action

Two Drax workers in forest

  • Voluntary reporting for Drax’s EU Taxonomy alignment shows why we must keep leading on sustainable finance
  • Our upgraded CDP scores further underline our credentials for best practice in both strategy and action

Sustainability shapes how we operate at Drax. It provides our stakeholders with the trust they need as we demonstrate how we strive to provide secure, renewable energy to millions of homes and businesses, in a responsible way.

That is why we are pleased to hit another significant milestone in our ongoing sustainability journey, with the release of our first ever EU Taxonomy Report.

The report reflects our deep commitment to sustainability and highlights our continued work towards aligning ourselves with the European Union’s sustainability goals. In terms of results, the report shows that 71% of Drax’s revenue qualifies as eligible and aligned with the Taxonomy, with 99% of that aligned revenue meeting sustainability principles.

But what is it? EU Taxonomy is a classification system that was created by the European Commission, to define which economic activities contribute to environmental sustainability. It serves as a core part of the EU’s sustainable finance framework, guiding investment flows towards activities that align with the EU’s Green Deal and its broader climate goals.

It’s essentially a roadmap for companies and investors to understand what qualifies as environmentally sustainable. For businesses like Drax, aligning with the EU Taxonomy is essential, as it reinforces our ambition to help tackle climate change while maintaining strong financial performance.

So, why is the EU Taxonomy so important in the context of Drax’s sustainability journey? It’s because the system establishes clear guidelines and benchmarks aimed at ensuring that investment is directed towards activities that contribute meaningfully to environmental sustainability.

It plays a crucial role in accelerating the transition to a green economy and helps companies like Drax with their ambitions to meet their global sustainability targets. By aiming to align what we do with the EU Taxonomy, we aim to ensure that our operations, revenue generation, and financial models support these crucial climate objectives.

The results of our first EU Taxonomy Report demonstrate how far we’ve come in our sustainability efforts. The headline figure that 99% of our eligible revenue meets the sustainability criteria is a source of pride. This is a strong affirmation of our long-term dedication to environmental stewardship and is a significant achievement.

Compared to the broader business landscape, our results are an extraordinary achievement. A 2024 report from EY, that used a sample of 307 European companies non-financial disclosures, showed that the average EU Taxonomy alignment for turnover was 10% across all sectors, with the energy and power sector rising to 37%. For Drax, this rises even further to 71%, positioning us as a leader in taxonomy-aligned sustainability principles.

The reason for this alignment is simple: Drax has made intentional and strategic decisions over the years to transition our business towards renewable energy, with the most notable being the transition from coal to biomass at Drax Power Station.

However, achieving alignment with the EU Taxonomy goes beyond just ticking the necessary boxes. We’re focused on aiming to exceed the minimum standards set out by the taxonomy. The fact that 71% of our revenue is fully aligned with the EU Taxonomy speaks to the forward-thinking strategies that we have put in place.

One of the key pillars of sustainability at Drax is our focus on forestry, specifically how we manage and source biomass. Forests are a crucial component of the global carbon cycle. As part of our commitment to achieve net zero by the end of 2040 across our value chain, we endeavour to source our biomass from sustainably managed forests and must be mindful of the impact our activities have on biodiversity, carbon sequestration, communities, and forest health.

This is where the importance of our CDP (Carbon Disclosure Project) scores come in and these act like a snapshot of a company’s performance on environmental action. Their annual reports provide valuable insights into a company’s efforts to reduce emissions and manage natural resources responsibly, using voluntarily disclosed data to provide a score based upon three main critical areas: greenhouse gas emissions, water management, and deforestation.

We have worked hard on these areas, to demonstrate our dedication and progress towards climate action to our investors and other stakeholders. We have maintained our A- CDP climate score and alongside this our CDP Forests score was upgraded to A-. For the first time this positions Drax in the highest ‘leadership’ banding of CDP scores, recognising best practice for both strategy and action, and ranking Drax in the leading group of FTSE businesses.

The upgraded CDP score for forestry reflects our ongoing efforts to aim to ensure that our biomass sourcing practices do not contribute to deforestation or degradation of ecosystems. By sourcing from responsibly managed forests, we aim to ensure that our biomass is part of a sustainable, circular process where forest health is maintained and enhanced.

We recognise that both environmental sustainability as measured by the EU Taxonomy and our evolving CDP scores will require consistent work to maintain and improve. Alongside this we have developed a new sustainability framework, in consultation with a variety of different groups including representatives from the scientific community, academics, employees, investors and environmental NGOs.

But this holistic approach must be seen as the starting point of a journey. With the climate crisis becoming an even bigger threat to our planet, we must redouble our efforts. That means open and frank conversations with internal and external stakeholders where possible and concerted efforts to decarbonise our supply chain. It also means continuing to prioritise the rigorous standards of best practice measured by mechanisms such as EU taxonomy and CDP ratings. These pillars will be the key to proving that Drax can keep the lights on for millions of people using sustainable biomass generation, responsibly.

Wind droughts show the need for low-carbon flexible generation

By Dr Iain Staffell, Imperial College London 

As our energy mix changes and a different weather challenge has been taking up the headlines, latest analysis from Electric Insights has revealed that the need for reliable low-carbon generation when the wind doesn’t blow and the sun doesn’t shine is becoming more important. Dr Iain Staffell took a look at the data.   

“Dunkelflaute” must surely be an early contender for the 2025 Oxford Dictionary word of the year.  A German word meaning “dark doldrums”, it is used in the energy world to describe a dark, cold, calm spell of weather during which very little energy can be generated with wind or solar power.

In December and January, Britain has faced two spells of so-called Dunkelflaute.  The first, hitting around the 12 December, saw wind – the largest source of energy in the UK last year overall – drop to 6% of total supply.  In response, gas power stations ramped up to their highest output ever recorded, supplying more than 73% of Britain’s electricity and sending power prices soaring.  Wind output dropped suddenly again in the New Year causing prices to hit £2,900/MWh (40 times their average) on 8 January.

This winter has again demonstrated some of the challenges we must address in reaching a clean power system by 2030.  The combination of a long cold snap and low wind speeds left Britain’s power system relying heavily on natural gas and imports, drawing down the nation’s gas storage to ‘concerningly low’ levels, and coming close to generation falling short of peak demand.  Options for low-carbon flexibility are urgently needed – both investing in new technologies and maintaining existing sources – as electricity supply and demand become more dependent on the weather.

Daily average electricity mix in Britain during mid-December, highlighting the Dunkelflaute period, and the difference between output from dispatchable technologies which we control, and those that are driven by the weather or foreign power markets.

Gas was not the only technology to help during the shortfall.  Biomass and hydro plants increased their output by 40% and 60% on the peak day (12 December) compared to the weekends before and after.  While this helped meet the shortfall of wind, the impact was muted as Britain has relatively little capacity of either technology.  In previous years, coal power stations would have also helped to meet demand, but the last one closed in September.  Pumped hydro and batteries helped meet the evening peak on the 12th, but these only supply power for a few hours, and so cannot help with multi-day shortages.

Interconnection with neighbouring countries also provides flexibility, but on the 12th when we most needed them, imports from abroad fell by half relative to the surrounding days.  Britain’s neighbours were suffering from the same wind drought, as weather systems are often the size of continents.  More power could have flowed into Britain, but only if our prices rose high enough.  This exposes a key problem with relying on interconnection to solve capacity shortages, which leaves countries competing for limited supply of power at the same time.

Altogether, this leaves gas as the only large-scale source of flexibility in the country.  This is a risky proposition on three fronts: affordability, energy security, and our climate goals.

The cost of our gas dependence: We are still reeling from the gas price crisis.  Gas is very much the ‘crutch’ of the grid, and British electricity is more strongly swayed by gas prices than in any other European country, as we have so few alternatives for flexible generation (no coal, limited hydro and biomass, and less storage than neighbouring countries).  Gas sets the electricity price in 98% of hours, despite meeting only a third of electricity demand. That means Britain’s electricity prices track almost perfectly with gas prices, leaving consumers particularly vulnerable to price shocks, as seen during the recent gas price crisis.

The change in electricity and natural gas prices on Britain’s wholesale markets over the last decade, indexed to the 2010–19 average.  Gas prices increased by over 50% between February and December last year, dragging electricity prices up with them.

Energy security at risk: Relying so heavily on a single technology in times of system stress is leaving all our eggs in one basket.  Capacity was tight on 12 December and 8 January, causing NESO to issue rare Capacity Market Notices, a ‘blackout prevention system’ used to encourage generators to prepare extra capacity just in case.   Britain’s last coal plant has retired, all bar one nuclear plant is coming towards their end of life, and it is unclear if biomass will continue operating beyond 2027.  This all comes just as peak electricity demand is expected to grow from electric vehicles, heat pumps, AI, and data centres.  Unless more capacity is built or existing capacity has its lifetime extended, Capacity Market Notices will be increasingly likely in future.

The carbon challenge: Gas is the most polluting fuel remaining on the grid.  In just five years, government aim to run a clean power system, meaning just 5% of electricity produced from fossil fuels, down from over 25% today.  These plans include retaining almost all the current gas capacity to cover rare but intense periods of low renewable output.  Put together, this means gas plants will see fewer operating hours in the future, just as coal plants did over the last decade.  Either they will need to charge more for their output to cover costs, or the system needs to move more towards paying for availability than for output (e.g. capacity payments).

Phasing out gas will largely be achieved by scaling up wind and solar power, but that further intensifies the challenges posed by weather variability.  Both the CCC and NESO recognise that a balanced approach is needed, using all the tools at our disposal – flexible low-carbon generation, long-duration energy storage, interconnectors and a continued (but increasingly limited) role for gas.  Looking ahead, policy frameworks envisage the arrival of more low-carbon dispatchable power from 2030 onward.  This includes power stations equipped with carbon capture and storage (CCS), hydrogen, and long-duration storage.  All of these play little or no role in today’s power system, so the task now is to define a clear strategy for scaling and deploying these resources at pace, while avoiding cost escalation to consumers due to all the new investments.  By planning for Britain’s future energy needs and taking strategic action now, government, industry and investors can break free from paying for volatile gas expensive imports, and seize the opportunity of clean, stable, and lower cost electricity.

Read the full article here or in the Q4 2024 Electric Insights report, coming soon.

This article was written by Dr Iain Staffell, Senior Lecturer at Imperial College London, as part of the Electric Insights project. Drax does not guarantee the accuracy, reliability or completeness of this content.

Newsweek Pillars of the Green Transition interview with Drax CEO, Will Gardiner

This interview appeared first in Newsweek Investment Reports.

Given the recent energy challenges in Europe, especially since the war in Ukraine, how do you view Drax’s transition from fossil fuels to biomass? Do you believe this model is scalable and reliable enough to meet Europe’s long-term energy demands amidst geopolitical instability?

The war in Ukraine has demonstrated how critical biomass can be as an alternative energy source and its role in the energy transition. While solar and wind are often seen as the core renewable energy technologies, they aren’t always reliable, especially when there’s no wind or sun. Biomass serves as an essential solution that offers the same stability and reliability as coal but without the associated CO2 emissions. It provides critical ancillary services to the grid, like inertia and reactive power, similar to large-scale thermal plants, making it a valuable asset in ensuring energy supply.

However, it’s important to recognize that biomass should not be the primary energy source. Its usage must be sustainable, meaning there have to be clear rules on sourcing feedstock. At Drax, our transition from coal to biomass has been guided by strict sustainability requirements, ensuring that the biomass we use is renewable and responsibly sourced.

Can you briefly explain what biomass is and how it fits into Drax’s operations?

Biomass involves using sustainable wood pellets instead of fossil fuels to generate power. Drax, originally the largest coal-fired power station in Western Europe, underwent a significant transformation over the past two decades to switch from coal to biomass. Today, instead of burning coal, we use around 7 to 8 million tons of wood pellets annually, primarily sourced from the southeastern U.S. and western Canada.

The transition involved building a new supply chain tailored to biomass, which includes customized storage, logistics, and transport processes. Once the biomass reaches our power station, it’s used in the boilers to generate electricity in a way that’s similar to coal-fired generation, but with a much lower carbon footprint.

Drax has set a goal to be carbon negative by 2030. How do you plan to achieve this, and what role will carbon capture and storage play in the process?

Biomass is already a low-carbon power generation method, but by incorporating carbon capture and storage (CCS), we can take it a step further. Our plan is to install carbon capture units at our UK power station starting in 2027, with the goal of being fully operational by 2030. This technology will capture the CO2 emissions that come out of the power station and store them under the North Sea, effectively making our operations carbon negative.

Once fully operational, this process will remove 4 million tons of CO2 annually from the atmosphere. To put this into perspective, capturing 8 million tons of CO2 is equivalent to installing heat pumps in every home in Birmingham, the UK’s second-largest city.

How do you ensure that the biomass you source is sustainable and doesn’t contribute to deforestation?

The sustainability of biomass hinges on it being a renewable resource. This means that the CO2 absorbed by trees as they grow is released when we burn the pellets but is reabsorbed by new trees, maintaining a balanced cycle within the biosphere. Unlike fossil fuels, which release CO2 that’s been locked in rocks for millions of years, biomass doesn’t add new carbon to the atmosphere.

To ensure sustainability, all our biomass is sourced from forests that are actively regenerating, with no contribution to deforestation. In fact, the forests we source from are required to have increasing or stable carbon stocks. In the southeastern U.S., where most of our pellets come from, carbon stocks have been steadily growing since the 1950s. Additionally, strict limits are in place for CO2 emissions throughout the supply chain, from pellet production to transport, ensuring that biomass remains a low-carbon process.

Our sourcing practices are also rigorously documented and regulated, ensuring compliance with UK government standards. Importantly, the majority of our feedstock comes from byproducts such as sawdust and shavings from sawmills, contributing to a more well-managed forest ecosystem.

How do you integrate biomass with other renewable energy sources to create a reliable energy mix?

The UK’s energy system relies on a mix of different fuels, including wind, solar, gas, biomass, and hydro. Each source plays a different role in ensuring energy stability. For instance, on a sunny day with light wind, around a quarter of the UK’s power might come from solar, 13% from wind, 25% from gas, and 8% from biomass.

Biomass is unique because it’s a renewable, dispatchable energy source, meaning it can be turned up or down based on demand. This flexibility is crucial for maintaining a balanced energy system, especially when wind and solar aren’t generating power.

Drax’s strategy focuses on providing dispatchable renewable power to support the grid when other sources aren’t available, ensuring a reliable and stable energy supply.

As biomass continues to expand, particularly in North America, how do you plan to scale up operations, and what challenges do you anticipate for the industry?

The history of biomass power generation, especially over the last 25 years, has largely been about replacing coal, which is one of the most carbon-intensive fuel sources. As wind and solar become more affordable and widespread, the role of biomass will evolve. The next generation of biomass power stations will likely integrate carbon capture and storage, enabling biomass to act as a source of carbon removal.

For Drax, our plan is to build biomass power stations in the U.S. with integrated carbon capture and storage technology, which offers two key benefits: 24/7 green power and significant carbon removal. This combination is crucial for achieving net zero and meeting the growing demand for sustainable power, especially as technologies like AI drive increased energy consumption.

Why do you think biomass, despite being a significant part of the energy mix, isn’t as well-known as wind or solar energy?

Biomass tends to be more geographically specific. It’s an important part of the energy transition in countries like the UK, Germany, Denmark, and the Netherlands, where sustainable forestry is prevalent. In regions with fewer forests, like Southern Europe, it’s less common. Moreover, in places with consistent sunshine, like the Middle East, solar energy paired with batteries is often more viable. The visibility and relevance of biomass vary based on regional resources and energy needs.

How significant will carbon capture be in reducing emissions, and when do you think it will become a scalable solution?

Carbon capture is poised to play a crucial role in reducing emissions. The technology is proven and has been used by oil and gas companies for many years. The shift toward making carbon capture a viable business solution has gained momentum, particularly after COP26, with major players in the energy sector investing in this technology.

There are also growing incentives in countries like the U.S., Sweden, and Denmark, making carbon capture economically viable. By 2030, we expect to see the first significant projects, including ours in the UK and the U.S., with broader adoption occurring by the mid-2030s.

How do you educate the public about carbon capture and ensure they understand its importance in achieving net zero?

The need to achieve net zero is now widely accepted by the public and business leaders alike, especially as climate events like hurricanes, floods, and droughts continue to highlight the urgency of the situation. However, it’s crucial to convey that simply reducing emissions won’t be enough—we must also remove CO2 from the atmosphere to reach net zero.

We spend considerable time working with governments to ensure they understand this narrative, as government support is vital for driving the adoption of carbon capture technology. Once governments are on board, it becomes easier to communicate this message to the public, making carbon capture a more integral part of the green energy transition.

Biomass and BECCS are essential in the UK’s journey to Net Zero

The Strategy provides an important steer on the short-, medium- and long-term use of biomass in the UK’s 2050 Net Zero target.

With the Government’s Strategy in hand, I am more certain than ever on two things.  First, that there remains a clear and powerful role for biomass and BECCS in helping the UK balance harder to abate sectors, like aviation, and reach Net Zero.

And secondly, that bioenergy with carbon capture and storage (BECCS) has a vital role to play in our global energy transition – and that Drax is well placed to deliver.

Why we should be confident

In developing the Strategy, the Government has considered several factors including: availability of biomass and the priorities for end use; impacts on air quality; the sustainability of biomass use; as well as the role of BECCS in helping to reach our long-term climate goals.

The ‘Priority Use Framework’ evaluates where biomass would be most sustainably and efficiently used across sectors, given supply constraints. This framework is an important tool, which has been developed with four key principles in mind; sustainability; air quality; the circular economy and resource efficiency; and ability to support us getting to Net Zero.

Critically, the Priority Use Framework states that:

  1. In the short-term (2020s) government will continue to facilitate sustainable biomass deployment through a range of incentives and requirements covering power, heat and transport
  2. In the medium-term (to 2035) government intends to further develop biomass use for utilities such as heat and power with a view to where possible transition to BECCS
  3. Biomass for use in BECCS should be prioritised in the long term (to 2050)

It’s very encouraging to see Government recognise the important role that biomass plays in our energy transition in both the short and medium term, as well as its prioritisation of BECCS in the long term.

Although there are various routes for deploying BECCS across different industries, the strategy further prioritises the deployment of BECCS on existing biomass generation plants with established supply chains, further supported by the development of the Power-BECCS business model for the first BECCS projects.

The Strategy is also promising as it presents an evidence-driven basis for long-term policy stability and I believe if the Government continues in this direction, it will draw investment to the UK’s bioenergy industry.

Why this is critical for the country

Biomass has already played an important role in supporting energy security while helping the UK decarbonise, displacing fossil fuels with a source of renewable, dispatchable power. Our work has also made a significant contribution to the UK economy, adding an estimated £1.8 billion to the UK GDP and supporting 17,800 jobs in 2021 alone.

And, looking to the future, BECCS presents an enormous opportunity to the UK.

Early investment in this critical technology has the potential to support energy security, and climate targets whilst creating jobs and making the UK a leader in the potentially trillion-dollar global CDR market.

This work needs to happen now – nearly all realistic pathways to limit warming to 1.5C require the carbon removal technology and renewable power BECCS offers, and expert voices at the UN’s Intergovernmental Panel on Climate Change, the UK’s Climate Change Committee, and Forum for the Future have said that carbon removals will be needed to address the climate crisis.

Today’s Strategy is a clear signal from Government that they recognise the importance of BECCS and the urgency with which we must employ it within the UK.

Why this is encouraging for Drax

Drax is an international, growing, sustainable business at the heart of global efforts to deliver Net Zero and energy security and I believe the Strategy we have seen from Government today is a clear indication of their support for the work that we do.

With BECCS, Drax has the ability to become a global leader in carbon removals technology. We are engaged in formal discussions with the UK Government about the project and, providing these are successful, we plan to invest billions in transforming Drax Power Station into the world’s largest carbon removals project. The prioritisation of BECCS within the Priority Use Framework shows the Government is aligned to this vision.

As we look forward

We welcome the Government’s Biomass Strategy and will continue to unpack what it means for our business over the coming days and weeks with a mind to our next steps.

Government must now ensure that as it progresses its consultation on biomass sustainability that that process is equally evidence-driven and ensures that science-based methods drive the policy forward. We hope to continue to work alongside Government to support these efforts.

Our formal discussions with the UK Government on BECCS and a ‘bridging mechanism’ to support the transition to BECCS have been productive, but to realise the scale of the ambition included in the Government’s Strategy, we need commitment through the delivery of a clear business model that supports BECCS.

Today’s support from Government brings us a big step closer and we look forward to continuing the work.

Will Gardiner
CEO
Drax

Read RNS here

Acquisition of 90,000 tonnes Canadian pellet plant

RNS Number: 8081U
Drax Group plc
(“Drax” or the “Group”; Symbol:DRX)

The plant, which has been operating since 1995, has the capacity to produce 90,000 tonnes of wood pellets a year, primarily from sawmill residues. Around half of the output from the plant is currently contracted to Drax.

The plant is located close to the Group’s Armstrong and Lavington plants and the port of Vancouver, and has 32 employees, who are expected to join Drax.

Following completion of the acquisition the plant is expected to contribute to the Group’s strategy to increase pellet production to 8 million tonnes a year by 2030.

The acquisition is expected to complete in Q3 2022.

Drax CEO, Will Gardiner

Will Gardiner, Drax Group CEO said:

“We look forward to welcoming the Princeton pellet plant team to Drax Group as we continue to build our global pellet production and sales business, supporting UK security of supply and increasing pellet sales to third parties in Asia and Europe as they displace fossil fuels from energy systems. Drax’s strategy to become a world leader in sustainable biomass, supports international decarbonisation goals and puts Drax at the heart of the global, green energy transition.”

Enquiries:

Drax Investor Relations: Mark Strafford
+44 (0) 7730 763 949

Media:

Drax External Communications: Ali Lewis
+44 (0) 7712 670 888

Website: www.Drax.com

END

View RNS here

Enviva Cottondale pellet plant catchment area analysis

The Enviva Cottondale pellet mill has a production capacity of 760,000 metric tonnes of wood pellets annually. Raw material used by the mill includes a combination of roundwood, chips, and secondary residuals (i.e., sawdust and shavings), with pine accounting for 80‐90% of total feedstock. In October 2018, Hurricane Michael passed through the centre of the Cottondale catchment area, causing significant damage to the forest resource with more than 500,000 hectares (ha) of forestland destroyed and an estimated loss of 42 million m3of timber (equivalent to around 4 times the UK annual production of roundwood).

This event has had an impact on the data trends for forest inventory, growth and harvesting removals – as harvesting levels were increased to salvage as much timber as possible before it became unusable due to decay. This can be clearly seen in many of the charts below. However, these forest areas have been restored and now continue to grow, allowing the catchment area to return to its pre-hurricane trends in the medium term.

Forest Area 

The catchment area around Enviva’s Cottondale pellet mill includes 4.3 million ha of land, based on the historical feedstock sourcing patterns of the mill. Timberland represents 68.7% (2.95 million ha) of the total land area in the Cottondale catchment area, this has increased slightly since 2000 from 67.8% and can be considered to have remained stable over this time period.  There are also around 300,000 ha of woodland (associated with agricultural land) and around 800,000 ha of cropland and pastureland.  Forestry is the dominant land use in this catchment area (Figure 1).

Figure 1: Land area by usage

Planted pine represents 33% of the timberland area, natural pine 20%, with 10% mixed stands and the remainder being hardwood forest of which 94% is naturally regenerated (Figure 2).  The breakdown of forest type and species composition has remained relatively stable and largely unchanged over the last 20 years, in contrast to other parts of the US South where some natural pine stands have been converted to planted pine. The pine and mixed forest areas are actively managed and produce the majority of the timber harvest in the catchment area. Despite the large area of hardwood forest, management and timber production is limited. Much of this area is classified as bottomland hardwood located alongside rivers, streams, and creeks and in streamside management zones (SMZs), which restricts active management. In addition, the proportion of this catchment area located in Florida contains a large area of swampland, which is largely composed of hardwoods and cannot be actively managed for timber production and is recognised as having important ecological value.

Figure 2: Breakdown of forest type

Volume and Growth

The overall trend of volume and growth in the Cottondale catchment area is of a maturing forest resource and an increasing accumulation of standing volume, particularly in the larger forest product classes (saw-timber and chip-n-saw). Figure 3 shows that total standing volume increased by 64 million m3 from 2000 to 2018, with the largest increases in the pine saw-timber and chip-n-saw categories. In 2018, the devastating impact of Hurricane Michael caused a substantial reduction in the standing volume across every product category with the total standing volume being reduced by 42 million m3. This event has had a significant impact on the forest resource and is a primary cause of recent data trends.

However, the overall long-term trend in the catchment area is of maturing forest and increasing inventory. This should continue in the long-term once the impact of the hurricane damage has been managed and replacement forest areas begin to mature.

Figure 3: Standing volume by product category

Pine pulpwood inventory increased steadily by around 8 million m3 from 2000 to 2013, reaching a peak of 49 million m3. This then declined slightly to 46 million m3 in 2018 due to the maturing age class of the forest and pulpwood forest growing into the larger size class of chip-n-saw and saw-timber forest (Figure 4), in addition to an increase in pulpwood demand as biomass markets became operational and ramped up production. Following the hurricane in 2018, the pine pulpwood inventory dropped by more than 10 million m3. 

Replanting and reforestation of damaged areas will ensure that future pine pulpwood production will increase again once these forests start to mature.

In the period from 2000 to 2018 pine sawtimber standing volume increased by 41.5 million m3 (78%) and chip-n-saw by 19.6 million m3 (73%), indicating a maturing age class and a growing forest resource. The 2018 hurricane caused a reduction in standing volume in both of these product categories of 11.6 and 8 million m3respectively (12% and 17% of the 2018 volume). However, the increasing trend is likely to continue once the forest area recovers.

Figure 4: Standing volume by product category

The growth drain ratio (GDR) is the comparison of average annual growth to removals (typically harvesting), where the growth exceeds removals the GDR will be in excess of 1 and this is considered sustainable, where removals exceed growth then the GDR will be less than 1 and this is not sustainable if maintained in the long-term – although in the short-term this can be a factor of large areas of mature forest with low growth rates and high rates of harvesting, short periods of high demand for a particular product or salvage harvesting after a natural disturbance. The GDR should be considered over a longer time period to ensure it reflects the long-term trend. In the period from 2003 to 2020 the combined GDR for pine products averaged 1.52 with a high of 1.84 and a low of 1.08 (Figure 5).

Figure 5: Growth to drain ratio by product category

The maturing forest resources can be clearly seen from the growth to removals data for each product category. Average tree sizes getting larger and more pulpwood class stands moving into the larger saw-timber and chip-n-saw categories. This trend can be seen by comparing the data values from 2003 and 2018 where saw-timber average annual growth increased by 90% (1.6 million m3), and removals by 41% (0.98 million m3).  Chip-n-saw growth increased by 73% (1.3 million m3) whilst removals increased by 160% (1.9 million m3). Pulpwood growth decreased by 7.5% (0.4 million m3) whilst removals increased by 63% (1.6 million m3).  Over this time period the total annual surplus of pine growth compared to removals averaged 3.7 million m3 per year (Figure 6).

Figure 6: Pine growth and removals by product category and year

Hardwood saw-timber and pulpwood removals declined by 20% and 40% respectively between 2000 and 2018, whilst growth increased by 23% for hardwood saw-timber and declined by 16% for hardwood pulpwood. The average annual hardwood surplus over this time period was 1.5 million m3 per year (Figure 7).

Figure 7: Hardwood growth and removals by product category and year

Despite a short-term imbalance in some product categories, the overall surplus of pine growth compared to removals has remained strong, with an average of 3.3 million m3 between 2000 and 2020, which includes the increased salvage harvesting in 2018 (Figure 8).

Figure 8: Cumulative annual surplus of growth compared to removals

Wood Prices

Stumpage price is the value paid to the forest owner for each category of product at the time of harvesting. The variation in prices in the Cottondale catchment area has been significant and shows some interesting trends. The higher value pine products (saw-timber and chip-n-saw) began with high stumpage values in 2000, as markets were strong for construction and furniture grade timber and supply limited at that stage due to the young age class and predominance of pulpwood stands at that time.  In 2008, following the global economic crisis and the crash in housing and construction markets, saw-timber prices declined substantially reaching a low of $23 per ton, a 47% decline from the 2000 price. This stumpage price has never recovered, despite an improvement in the economy and an increase in housing starts and demand for structural timber. The reason for the continued deflated saw-timber stumpage price is a substantial surplus of supply in this catchment area.  As the forest area has matured and more saw-timber grade stands are available, markets have been able to satisfy demand without an increase in price.

Pine pulpwood prices at Cottondale were lower than the US South-wide average in 2000 and remained relatively low until around 2013. A reduction in saw-timber production, and consequent reduction in mill residuals, due to the recession of 2008, led to a shortage of pulp mill feedstock and increased harvesting of pulpwood stands. This caused an increase in pine pulpwood stumpage values alongside an overall increase in demand as biomass and pellet markets began production around this time. The data shows a short-term spike in pine pulpwood stumpage prices in 2013-14, but this returned to a more normal trend as more saw-timber residues became available and pulpwood stumpage values have been around $10-11 per ton since 2015 (Figure 9).

Figure 9: Variation in stumpage value over time

Biomass demand 

Biomass demand in the Cottondale catchment area began in 2008 and has averaged around 800 thousand m3per year since that time with a high of just over 1 million m3 in 2013 to 2015 and a low of 200 thousand m3 in 2008. Other pulpwood markets have had an average annual demand of 3.97 million m3 between 2000 and 2020 with a high of 4.76 million m3 in 2018 and a low of 3.2 million m3 in 2009.  In 2020 the biomass market represented 16% of the total pulpwood demand in the Cottondale catchment area (Figure 10).

Figure 10: Total pulpwood demand

Forest Management

The average size of clear-cut harvesting sites from 2000 to 2020 has been 47 ha, ranging from 38 ha up to 56 ha. The average size of thinning sites has been 65 ha, ranging from 55 ha up to 76 ha. When isolating the period from 2000 to 2010 and 2011 to 2020, the averages and range remain very similar, suggesting that there has been no significant change in harvesting coupe size over this period.

Figure 11: Average size of harvesting sites

The impact of biomass and wood pellet demand on the key metrics in this catchment area are considered below. This is a summary of Hood Consulting’s view on the trends and impacts in the Cottondale catchment area.

Is there any evidence that bioenergy demand has caused the following:

Deforestation?

No. US Forest Service (USFS) data shows a 55,166-hectare (+1.9%) increase in the total area of timberland in the Enviva Cottondale catchment area since the Enviva Cottondale pellet mill commenced production in 2008. Furthermore, a strong positive relationship was identified between biomass demand and timberland area, suggesting that the increase in timberland area since 2008 can be linked, to a degree, to increased demand attributed to bioenergy.

A change in management practices (rotation lengths, thinnings, conversion from hardwood to pine)?

Inconclusive. Changes in management practices have occurred in the catchment area over the last two decades. However, the evidence is inconclusive as to whether increased demand attributed to bioenergy has caused or is responsible for these changes.

Clearcuts and thinnings are the two major types of harvests that occur in this region, both of which are long-standing, widely used methods of harvesting timber. TimberMart-South (TMS) data shows that thinnings accounted for 63% of total reported harvest area in the Cottondale market from 2005-2011 but only 39% of total harvest area reported from 2012-2020. Specifically, the decreased prevalence of thinning since 2012 can be linked to the strengthening of pine pulpwood markets and concurrent weakening of pine sawtimber markets beginning in the mid-2000s.

Prior to the bursting of the US housing bubble in 2006, timber management in this market had been driven to a large degree by pine sawtimber production. However, challenging market conditions saw pine sawtimber stumpages prices decline more than 40% from 2006-2011. At the same time, pine pulpwood markets started to strengthen, with pine pulpwood stumpage prices increasing more than 50% from 2006-2010. So, with sawtimber markets weakening and pulpwood markets strengthening, the data suggests that many landowners decided to alter their management approach (i.e. to take advantage of strong pulpwood markets) and focus on short pulpwood rotations that typically do not utilize thinnings.

Bioenergy has had an impact on this market by adding an average of roughly 680,000 metric tons of additional pine pulpwood demand to this catchment area annually since 2008. However, bioenergy has accounted for only 17% of total softwood pulpwood demand in this market since Enviva Cottondale’s startup. Ultimately, the shift in management approach that occurred in this market can be more closely linked to other factors, such as increased softwood pulpwood demand from non-bioenergy sources (i.e. pulp/paper) as well as the weakening of pine sawtimber markets.

Diversion from other markets?

No. Demand for softwood (pine) sawlogs increased an estimated 23% in the Cottondale catchment area from 2008-2020. Also, there is no evidence that increased demand from bioenergy has caused a diversion from other softwood pulpwood markets (i.e. pulp/paper), as softwood pulpwood demand not attributed to bioenergy has increased 25% since the Cottondale mill’s startup in 2008.

An unexpected or abnormal increase in wood prices?

Inconclusive. The startup of Enviva Cottondale added more than 900,000 metric tons of softwood pulpwood demand to the catchment area from 2008-2013, and this increase in demand coincided with a 28% increase in the delivered price of pine pulpwood (PPW) – the primary roundwood product consumed by the Enviva Cottondale mill. However, since 2013, delivered PPW prices have held flat, despite biomass-related softwood pulpwood demand falling to an average of roughly 635,000 tons per year since 2016, down more than 40% compared to 2013 peak levels. (Note the decrease in roundwood consumption was due to a higher utilization of secondary residuals). It’s also important to point out that the roughly 410,000-metric ton decrease in softwood biomass demand from 2013 to 2020 was offset by a roughly 455,000-metric ton increase in softwood pulpwood demand from other sources.

Statistical analysis did identify a positive relationship between softwood biomass demand and delivered PPW price. However, that relationship was found to be relatively weak. The relationship between delivered PPW price and softwood pulpwood demand from other sources was found to be much stronger, which was not unexpected to find given that softwood pulpwood demand not attributed to bioenergy has accounted for 83% of total softwood pulpwood demand in the catchment area since 2008.

Furthermore, there is some evidence linking the increase in pine sawmill chip prices to increased consumption of secondary pine residuals by Enviva Cottondale. Specifically, consumption of secondary pine residuals by Enviva Cottondale more than doubled from roughly 213,000 metric tons in 2012 to nearly 490,000 metric tons in 2016, and this increased consumption of pine residuals coincided with a nearly 20% increase in the price of pine sawmill chips. However, increased consumption of residuals by the bioenergy sector was only one of several contributing factors that can be linked to the increase in pine sawmill chip prices. Increased consumption of pine residuals by the pulp/paper industry also contributed to higher pine sawmill chip prices. In addition, there is a strong linkage between pine sawmill chip prices and softwood lumber production. Specifically, the increase in softwood lumber production that begun in the early-to-mid-2010s consequently resulted in the increased production of secondary residuals, and the increased availability of this lower-cost material led to greater competition and ultimately higher pine residual prices.

A reduction in growing stock timber?

No. From 2008 (the year Enviva Cottondale commenced production) up until Hurricane Michael struck in late-2018, total growing stock inventory increased an average of 1.8% per year (+19% total) in the Cottondale catchment area. Specifically, inventories of pine sawtimber and pine chip-n-saw increased 58% and 28%, respectively, while pine pulpwood (PPW) inventory decreased 4% over this same period.

However, note that the decrease in pine pulpwood inventory from 2008-2018 was not due to increased demand from bioenergy or increased harvesting above the sustainable yield capacity of the forest area, as annual growth of pine pulpwood exceeded annual removals every year throughout this period. Rather, this slight decrease in PPW inventory levels is more a reflection of the aging of the catchment area forest and the movement of stands classified as pulpwood to stands classified as chip-n-saw.

A reduction in the sequestration rate of carbon?

No. US Forest Service (USFS) data shows the average annual growth rate of total growing stock timber in the Cottondale catchment area decreased from 5.9% in 2008 to 5.2% in 2020, suggesting that the sequestration rate of carbon also declined slightly over this period. However, there is little evidence to suggest that increased demand attributed to bioenergy is responsible for this change.

The reduction in overall growth rate (and therefore reduction in the sequestration rate of carbon) is more a reflection of the aging of the catchment area forest. Specifically, growth rates decline as timber ages, and this is exactly what USFS data shows in the Cottondale catchment area, with the average age of growing stock timber increasing from less than 44 years of age in 2008 to nearly 46 years of age in 2020.

An increase in harvesting above the sustainable yield capacity of the forest area?

No. Growth-to-removals (G:R) ratios, which compare annual timber growth to annual timber removals, provides a measure of market demand relative to supply as well as a gauge of market sustainability. In 2020, the latest available, the G:R ratio for pine pulpwood (PPW), the predominant timber product utilized by the bioenergy sector, equaled 1.26 (recall that a value greater than 1.0 indicates sustainable harvest levels).

Note, however, that the PPW G:R ratio averaged 1.57 in the catchment area from 2013-2017 before falling to 1.20 in 2018 and averaging 1.27 since. This notable drop in 2018 was due to a nearly 35% increase in PPW removals (due to Hurricane Michael). It’s also important to note that while annual removals have moved back in line with pre-Michael levels since 2019, this lower PPW G:R ratio is likely reflective of the new norm (at least over the midterm). Hurricane Michael destroyed an estimated 22% of total pine pulpwood inventory in the Cottondale catchment area, and this loss in inventory will be reflected in reduced growth until the destroyed forests regenerate. However, in spite of this loss, adequate PPW inventory levels still remain and sustainable market conditions are expected to persist moving forward.

Timber growing stock inventory

Neutral. According to USFS data, inventories of pine pulpwood (PPW) decreased 25% in the catchment area from 2008-2020. However, this substantial decrease was due to Hurricane Michael, which destroyed nearly 520,000 hectares of catchment area timberland when it hit the Florida panhandle in late-2018. Prior to this event occurring, PPW inventory levels had held relatively steady, decreasing slightly but averaging 47.2 million m3 in the catchment area from 2008-2018. However, the destruction caused by Hurricane Michael resulted in the immediate loss of more than 10.3 million m3 of PPW inventory, or a 22% decrease compared to pre-hurricane levels.

Moreover, the slight decrease in PPW inventory levels that did occur from 2008-2018 was not due to increased demand from bioenergy. Typically, a reduction in inventory is linked to harvest levels above the sustainable yield capacity of the forest area, but in the Cottondale catchment area, annual growth of PPW exceeded annual removals every year throughout this period. Ultimately, the decrease in PPW inventory from 2008-2018 can be more closely linked to decreased pine sawtimber production beginning in the early to mid-2000s. Specifically, annual removals of pine sawtimber decreased 28% from 2003-2014, and the reduction in harvest levels over this period translated to a reduction in newly-re-established pine stands and ultimately the slight reduction in PPW inventory levels that occurred in the mid-to-late 2010s.

Timber growth rates

Neutral. Overall, timber growth rates declined slightly in the catchment area from 2008 (the year Enviva Cottondale commenced operations) through 2020. However, this decrease in timber growth rates was not due to increased demand attributed to bioenergy but rather to the aging of the catchment area forest. Specifically, USFS data shows the average age timber inventory in the Cottondale catchment area increased from an estimated 43.6 years of age in 2008 to 45.7 years of age in 2020.

Forest area

Positive. In the Enviva Cottondale catchment area, total forest area (i.e. timberland) increased more than 55,100 hectares (+1.9%) from 2008 through 2020, and this increase can be linked to several factors, including increases in softwood pulpwood demand (from both bioenergy and other sources) as well as conversion from farmland.

Specifically, the more than 55,100-hectare increase in catchment area timberland from 2008-2020 coincided with a 1.1-million metric ton increase in annual softwood pulpwood demand (roughly half of which was attributed to bioenergy). While statistical analysis identified moderately strong positive relationships between timberland area and both softwood biomass demand and non-bioenergy-related softwood pulpwood demand, a strong positive correlation was found between timberland and total softwood pulpwood demand – suggesting that the increases in timberland since 2008 can be attributed, in part, to the increase in total softwood pulpwood demand (from both bioenergy and other sources).

The more than 55,100-hectare increase timberland from 2008-2020 also coincided with a roughly 75,000-hectare decrease in farmland (i.e. cropland, woodland, and pastureland) over this period. Specifically, the catchment area experienced a roughly 31,800-hectare loss in cropland, 8,900-hectare loss in pastureland, and 34,300-hectare loss in woodland from 2008-2020. Furthermore, statistical analysis confirmed this inverse relationship, identifying a strong negative correlation between timberland and farmland in the Cottondale catchment area.

Wood prices

Negative / Positive. Total softwood pulpwood demand attributed to bioenergy in the Cottondale catchment area increased from zero tons in 2007 (the year prior to Enviva Cottondale’s startup) to over 1.0 million metric tons in 2013. Over this same period, the price of delivered pine pulpwood (PPW) – the predominant roundwood product utilized by Enviva Cottondale for wood pellet production – increased 42% (from $21.06 per ton in 2007 to $29.82 per ton in 2013).

However, the apparent link between increased softwood biomass demand and increased delivered PPW price is only loosely supported by statistical analysis, which identified a relatively weak positive relationship between these two variables. Furthermore, delivered PPW price has remained nearly unchanged in the catchment area since 2013, despite softwood biomass demand declining and averaging roughly 577,000 metric tons per year since 2016. (Note that the roughly 410,000-metric ton decrease in softwood biomass demand from 2013-2020 was offset by a roughly 455,000-metric ton increase in softwood pulpwood demand from other sources). Ultimately, the increase in delivered PPW prices in the catchment area can be linked to increased demand for softwood pulpwood from all sources, and roughly half of the 1.2-million metric ton increase in softwood pulpwood demand since 2007 can be attributed to bioenergy.

However, it’s also important to note that the increase in bioenergy-related wood demand has been a positive for forest landowners in the Enviva Cottondale catchment area. Not only has bioenergy provided an additional outlet for pulpwood in this market, but the increase in delivered PPW price resulting from increased softwood pulpwood demand from bioenergy has transferred through to landowners in the form of higher PPW stumpage prices. Specifically, over the six years prior to Enviva Cottondale’s startup, PPW stumpage price – the price paid to landowners – averaged roughly $7.40 per ton in the Cottondale catchment area. However, since 2010, PPW stumpage prices have averaged more than $11.15 per ton, representing a more than 50% increase compared to pre-mill startup levels.

Markets for solid wood products

Positive. In the Enviva Cottondale catchment area, demand for softwood sawlogs used to produce lumber and other solid wood products increased an estimated 23% from 2008-2020. This increase in softwood lumber production has consequentially resulted in an increase in sawmill residuals (i.e. chips, sawdust, and shavings) – by-products of the sawmilling process and materials utilized by Enviva Cottondale to produce wood pellets.

Specifically, softwood sawlog demand has increased more than 16% in the catchment area since 2014, and this increase in demand has coincided with a nearly 60% increase in pine residual purchases by Enviva Cottondale. (Note that pine residuals constituted 25% of total raw material purchases by Enviva Cottondale in 2014 but 41% of total raw material purchases in 2020). So, not only has Enviva Cottondale benefited from the greater availability of this sawmill by-product, but lumber producers have also benefited, as Enviva Cottondale has provided an additional outlet for these producers and their by-products.

Read the full report: Enviva Cottondale pellet plant catchment area analysis

This is part of a series of catchment area analyses around the forest biomass pellet plants supplying Drax Power Station with renewable fuel. Others in the series can be found here