Author: Alice Roberts

Notice of half year results announcement

Biomass domes at Drax Power Station
RNS Number : 6129T
Drax Group PLC

Drax Group plc (“Drax”) confirms that it will be announcing its Half Year Results for the six months ended 30 June 2020 on Wednesday 29 July 2020.

Information regarding the results presentation meeting and webcast is detailed below.

Results presentation and webcast arrangements

Management will host a webcast presentation for analysts and investors at 9:00am (UK Time), Wednesday 29 July 2020.

The presentation can be accessed remotely via a live webcast link, as detailed below. After the meeting, the webcast recording will be made available and access details of this recording are also set out below.

A copy of the presentation will be made available from 7:00am (UK time) on Wednesday 29 July 2020 for download at: www.drax.com>>investors>>results-reports-agm>> #investor-relations-presentations or use the link https://www.drax.com/investors/results-reports-agm/#investor-relations-presentations

Event Title: Drax Group plc: Half Year Results

Event Date: Wednesday 29 July 2020, 9:00am (UK time)

Webcast Live Event Link: https://secure.emincote.com/client/drax/drax007

Conference call and pre-register Link: https://secure.emincote.com/client/drax/drax007/vip_connect

Start Date: Wednesday 29 July 2020

Delete Date: Thursday 31 December 2020

Archive Link: https://secure.emincote.com/client/drax/drax007

For further information, please contact Rosie Corbett: [email protected]

Website: www.drax.com

LaSalle catchment area analysis

LaSalle Bioenergy Pellet Plant

The wood supply catchment area for Drax’s LaSalle BioEnergy biomass pellet plant in mid-Louisiana is dominated by larger scale private forest owners that actively manage and invest in their forest for saw-timber production. Eighty-three per cent (83%) of the forest is in private ownership and 60% of this area is in corporate ownership.

The Drax Biomass pellet mill uses just 3.2% of the roundwood in the market and therefore has limited impact or influence on the overall trends. By contrast, the pulp and paper industry consumes 74% of the total pulpwood demand as the most dominant market for low grade fibre.

Forest in LaSalle catchment area

Forest in LaSalle catchment area

The catchment area has seen an increase in total timberland area of 71 thousand hectares (ha) since 2008, this is primarily due to planting of previously non-stocked land. Hardwood areas have remained stable but planted pine has increased, replacing some of the naturally regenerated mixed species areas. The data below shows that deforestation or conversion from pure hardwood to pine is not occurring.

Timberland area by management type

Timberland area by management type

The overall quantity of stored carbon, or the inventory of the standing wood in the forest, has increased by 7% or 32.6 million metric tonnes since 2008. This total is made up of a 49 million tonne increase in the quantity of pine and a 16 million tonne decline in the quantity of hardwood. Since the area of pure hardwood forest has remained stable, this decline is likely to be due to the conversion of mixed stands to pure pine in order to increase saw-timber production and to provide a better return on investment for corporate owners.

Historic area and timberland inventory

Historic area and timberland inventory

Forest in LaSalle catchment area

Forest in LaSalle catchment area

The growth-to-drain ratio and the surplus of unharvested pine growth has been increasing year-on-year from two million tonnes in 2008 to over five million tonnes in 2016.

This suggests that the LaSalle BioEnergy plant (which almost exclusively utilises pine feedstocks) has not had a negative impact on the growth-to-drain ratio and the surplus of available biomass.

The latest data (2016) indicates that the ratio for pine pulpwood is 1.54 and for pine saw-timber 1.24 and that this has been increasing each year for both categories.

Historic growth and removals by species

Historic growth and removals by species

Stumpage prices for all product categories declined between 2010 and 2011. This was followed by a peak around 2015-16 with the recovery in demand post-recession and prices then stabilised from 2016 to 2019. The data indicates that there has been no adverse impact to pine pulpwood prices as a result of biomass demand. In fact, pine pulpwood prices are now nearly 20% lower than in 2014 as shown on the chart below.

LaSalle BioEnergy market historic stumpage prices, USD$:tonne

LaSalle BioEnergy market historic stumpage prices, USD$:tonne

The character of the pine timberland is one of a maturing resource, increasing in the average size of each tree. The chart below chart shows a significant increase in the quantity of timber in the mid-range size classes, indicating a build-up of future resources for harvesting for both thinning and final felling for sawtimber production.

With balanced market demand, the supply of fibre in this catchment area should remain plentiful and sustainable in the medium term.

Historic pine inventory by DBH (diameter at breast height) class

Historic pine inventory by DBH (diameter at breast height) class

Forisk summary of the impact of LaSalle BioEnergy on key trends and metrics in this catchment area

Is there any evidence that bioenergy demand has caused …

Deforestation

No

Change in forest management practices

No

Diversion from other markets

Possibly. Bioenergy plants compete with pulp/paper and oriented strand board (OSB) mills for pulpwood and residual feedstocks. There is no evidence that these facilities reduced production as a result of bioenergy markets, however.

Increase in wood prices

No. There is no evidence that bioenergy demand increased stumpage prices in the market.

Reduction in growing stock of timber

No

Reduction in sequestration of carbon / growth rate

No

Increase in harvesting above the sustainable yield

No 

The impact of bioenergy on forest markets in the LaSalle catchment is …

Growing stock

Neutral

Growth rates

Neutral

Forest area

Neutral

Wood prices

Neutral

Markets for solid wood

Neutral to Positive. Access to viable residual markets benefits users of solid wood (i.e. lumber producers).

Forest in LaSalle catchment area

Forest in LaSalle catchment area

Read the full report: LaSalle, Louisiana Catchment Area Analysis. Read how a $15m rail link from LaSalle BioEnergy to the Port of Greater Baton Rouge helps Drax reduce supply chain emissions and biomass costs here. Take a 360 immersive experience and video tour of LaSalle BioEnergy.

This is part of a series of catchment area analyses around the forest biomass pellet plants supplying Drax Power Station with renewable fuel. Others in the series include: Georgia MillChesapeakeEstonia, Latvia and Drax’s own, other two mills Morehouse Bioenergy and Amite Bioenergy.

Plant more forests and better manage them

Working forests in the US South

There is an ongoing debate about forests’ contribution to fighting the climate crisis.

Forests can act as substantial and effective tools for carbon sequestration during a high growth phase. They can also function as significant and extensive carbon storage areas during maturity and throughout multiple stages of the age class cycle, if managed effectively at a landscape level. Or, they can be emitters of carbon if over-harvested, subject to fire, storm, pest or disease damage.

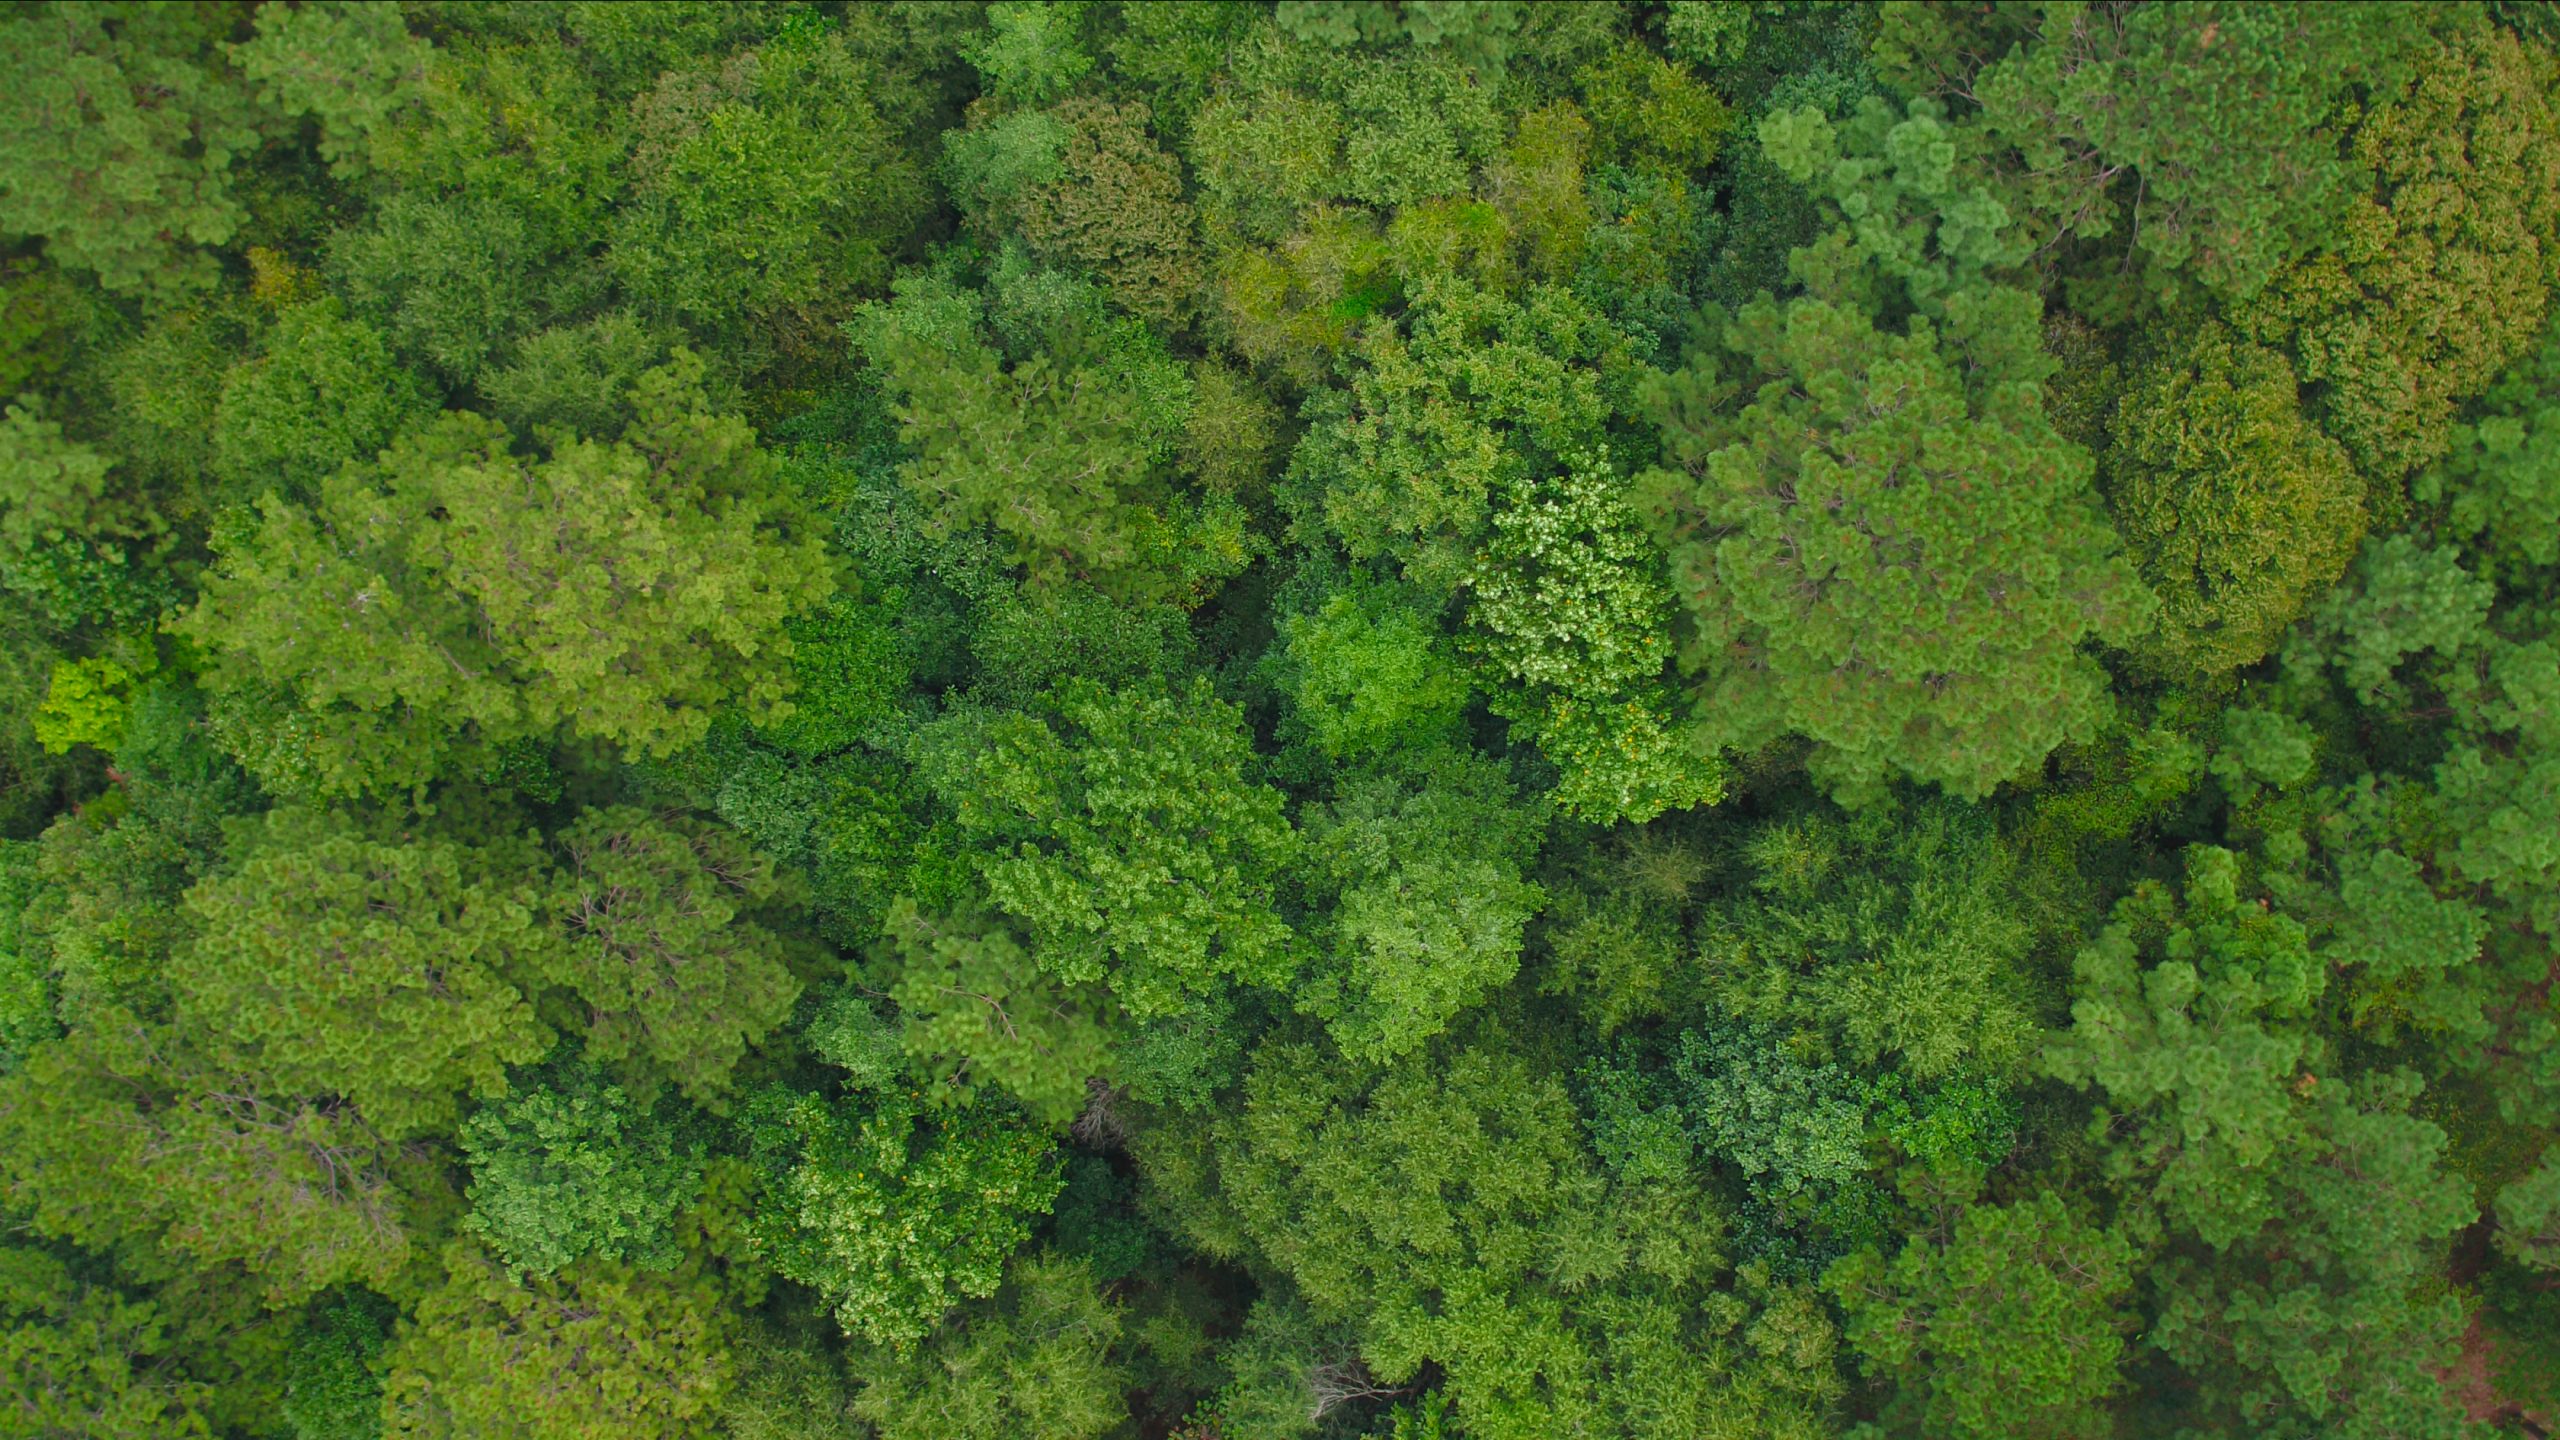
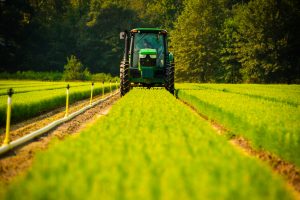
Different age class forest stands in Louisiana

In a natural state, forests will go through each of these life phases: rapid early growth; maturity and senescence; damage, decay and destruction through natural causes. Then they begin the cycle again, absorbing and then emitting carbon dioxide (CO2) in a continual succession.

Recently, loud voices have argued against forest management per se; against harvesting for wood products in particular, suggesting that this reduces both forest carbon stocks and sequestration capacity.

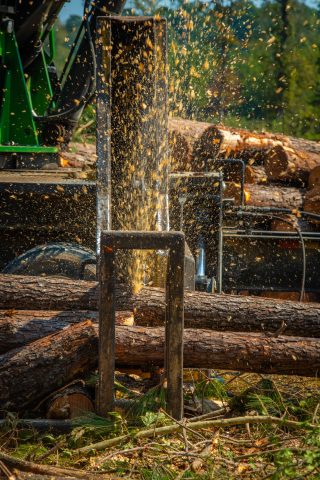
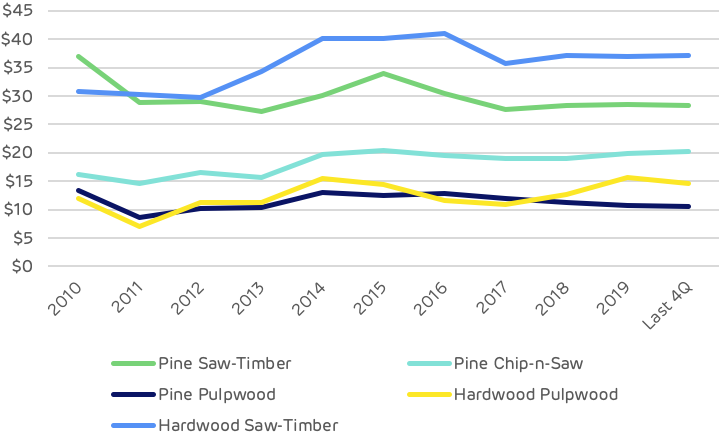
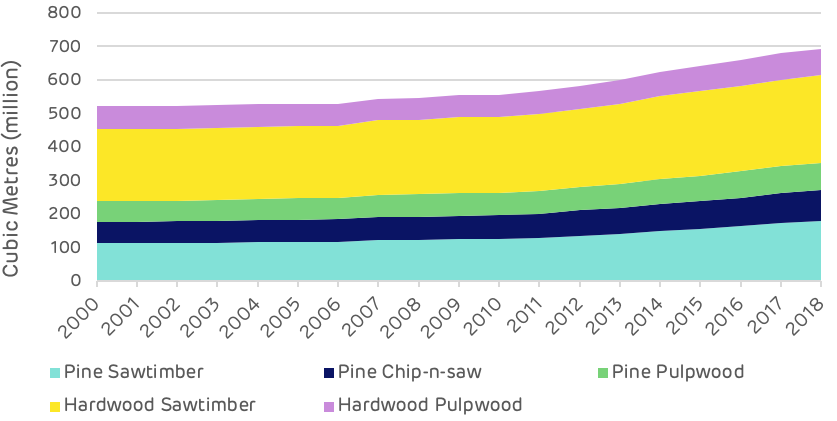
Pine cut in into wood for different wood products markets in Louisiana. Big, thick, straight higher value sections go to sawmills and smaller and misshapen low-grade wood not suitable for timber production is sold to pulp, paper or wood pellet mills.

Many foresters consider that this is just not correct. In fact, the opposite is true. Research and evidence clearly support the foresters’ view. Active forest management, when carried out appropriately, actually increases the amount of carbon sequestered, ensures that carbon is stored in solid wood products, and provides substantial savings of fossil fuels by displacing other high carbon materials (e.g. concrete, steel, brick, plastic and coal).

Oliver et al.(2014)[1] compared the impact of forest harvesting and the use of wood products to substitute other high-carbon materials, concluding that: ‘More CO2 can be sequestered synergistically in the products or wood energy and landscape together than in the unharvested landscape. Harvesting sustainably at an optimum stand age will sequester more carbon in the combined products, wood energy, and forest than harvesting sustainably at other ages.’

This research demonstrated that an increase in the use of structural timber to displace concrete and steel could lead to substantial emissions savings compared to unharvested forest. The use of wood for energy is an essential component of this displacement process, although it is important to use appropriate feedstocks. Burning wood that could be used for structural timber will not lead to a positive climate impact.

The message here is to manage working forests for optimum sawlog production for long-life solid wood products and utilise the by-products for energy where this is the most viable market, this provides the best all-round climate benefit.

What happens when you close the gate

Closing the forest gate and stopping all harvesting and management is one option being championed by some climate change campaigners. There is certainly a vital role for the preservation and protection of forests globally: primary and virgin forests, intact landscapes, high biodiversity and high conservation value areas all need to be protected.

That doesn’t necessarily mean that there is no forest management. It should mean careful and appropriate management to maintain and ensure the future of the resource. In these cases, management is with an objective to reduce the risk of fire, pests and disease, rather than for timber production.

Globally, we need better governance, understanding and implementation of best practice to achieve this. Forest certification and timber tracing systems are a good start. This can equally apply to the many hundreds of millions of hectares of ‘working forest’ that do not fall into the protection categories; forests that have been managed for many hundreds of years for timber production and other purposes. Harvesting in these forests can be more active, but governance, controls and the development of best practice are required. Better management not less management.

During the 1970s there was a significant change of policy in the US, aimed at removing massive areas of publicly owned forest from active management – effectively closing the gate. The drivers behind this policy were well meaning; it was intended to protect and preserve the habitat of endangered species, but the unintended consequences have also had a substantial impact. In the 1970s little thought was given to the carbon sequestration and storage potential of forests and climate change was not at the top of the agenda.

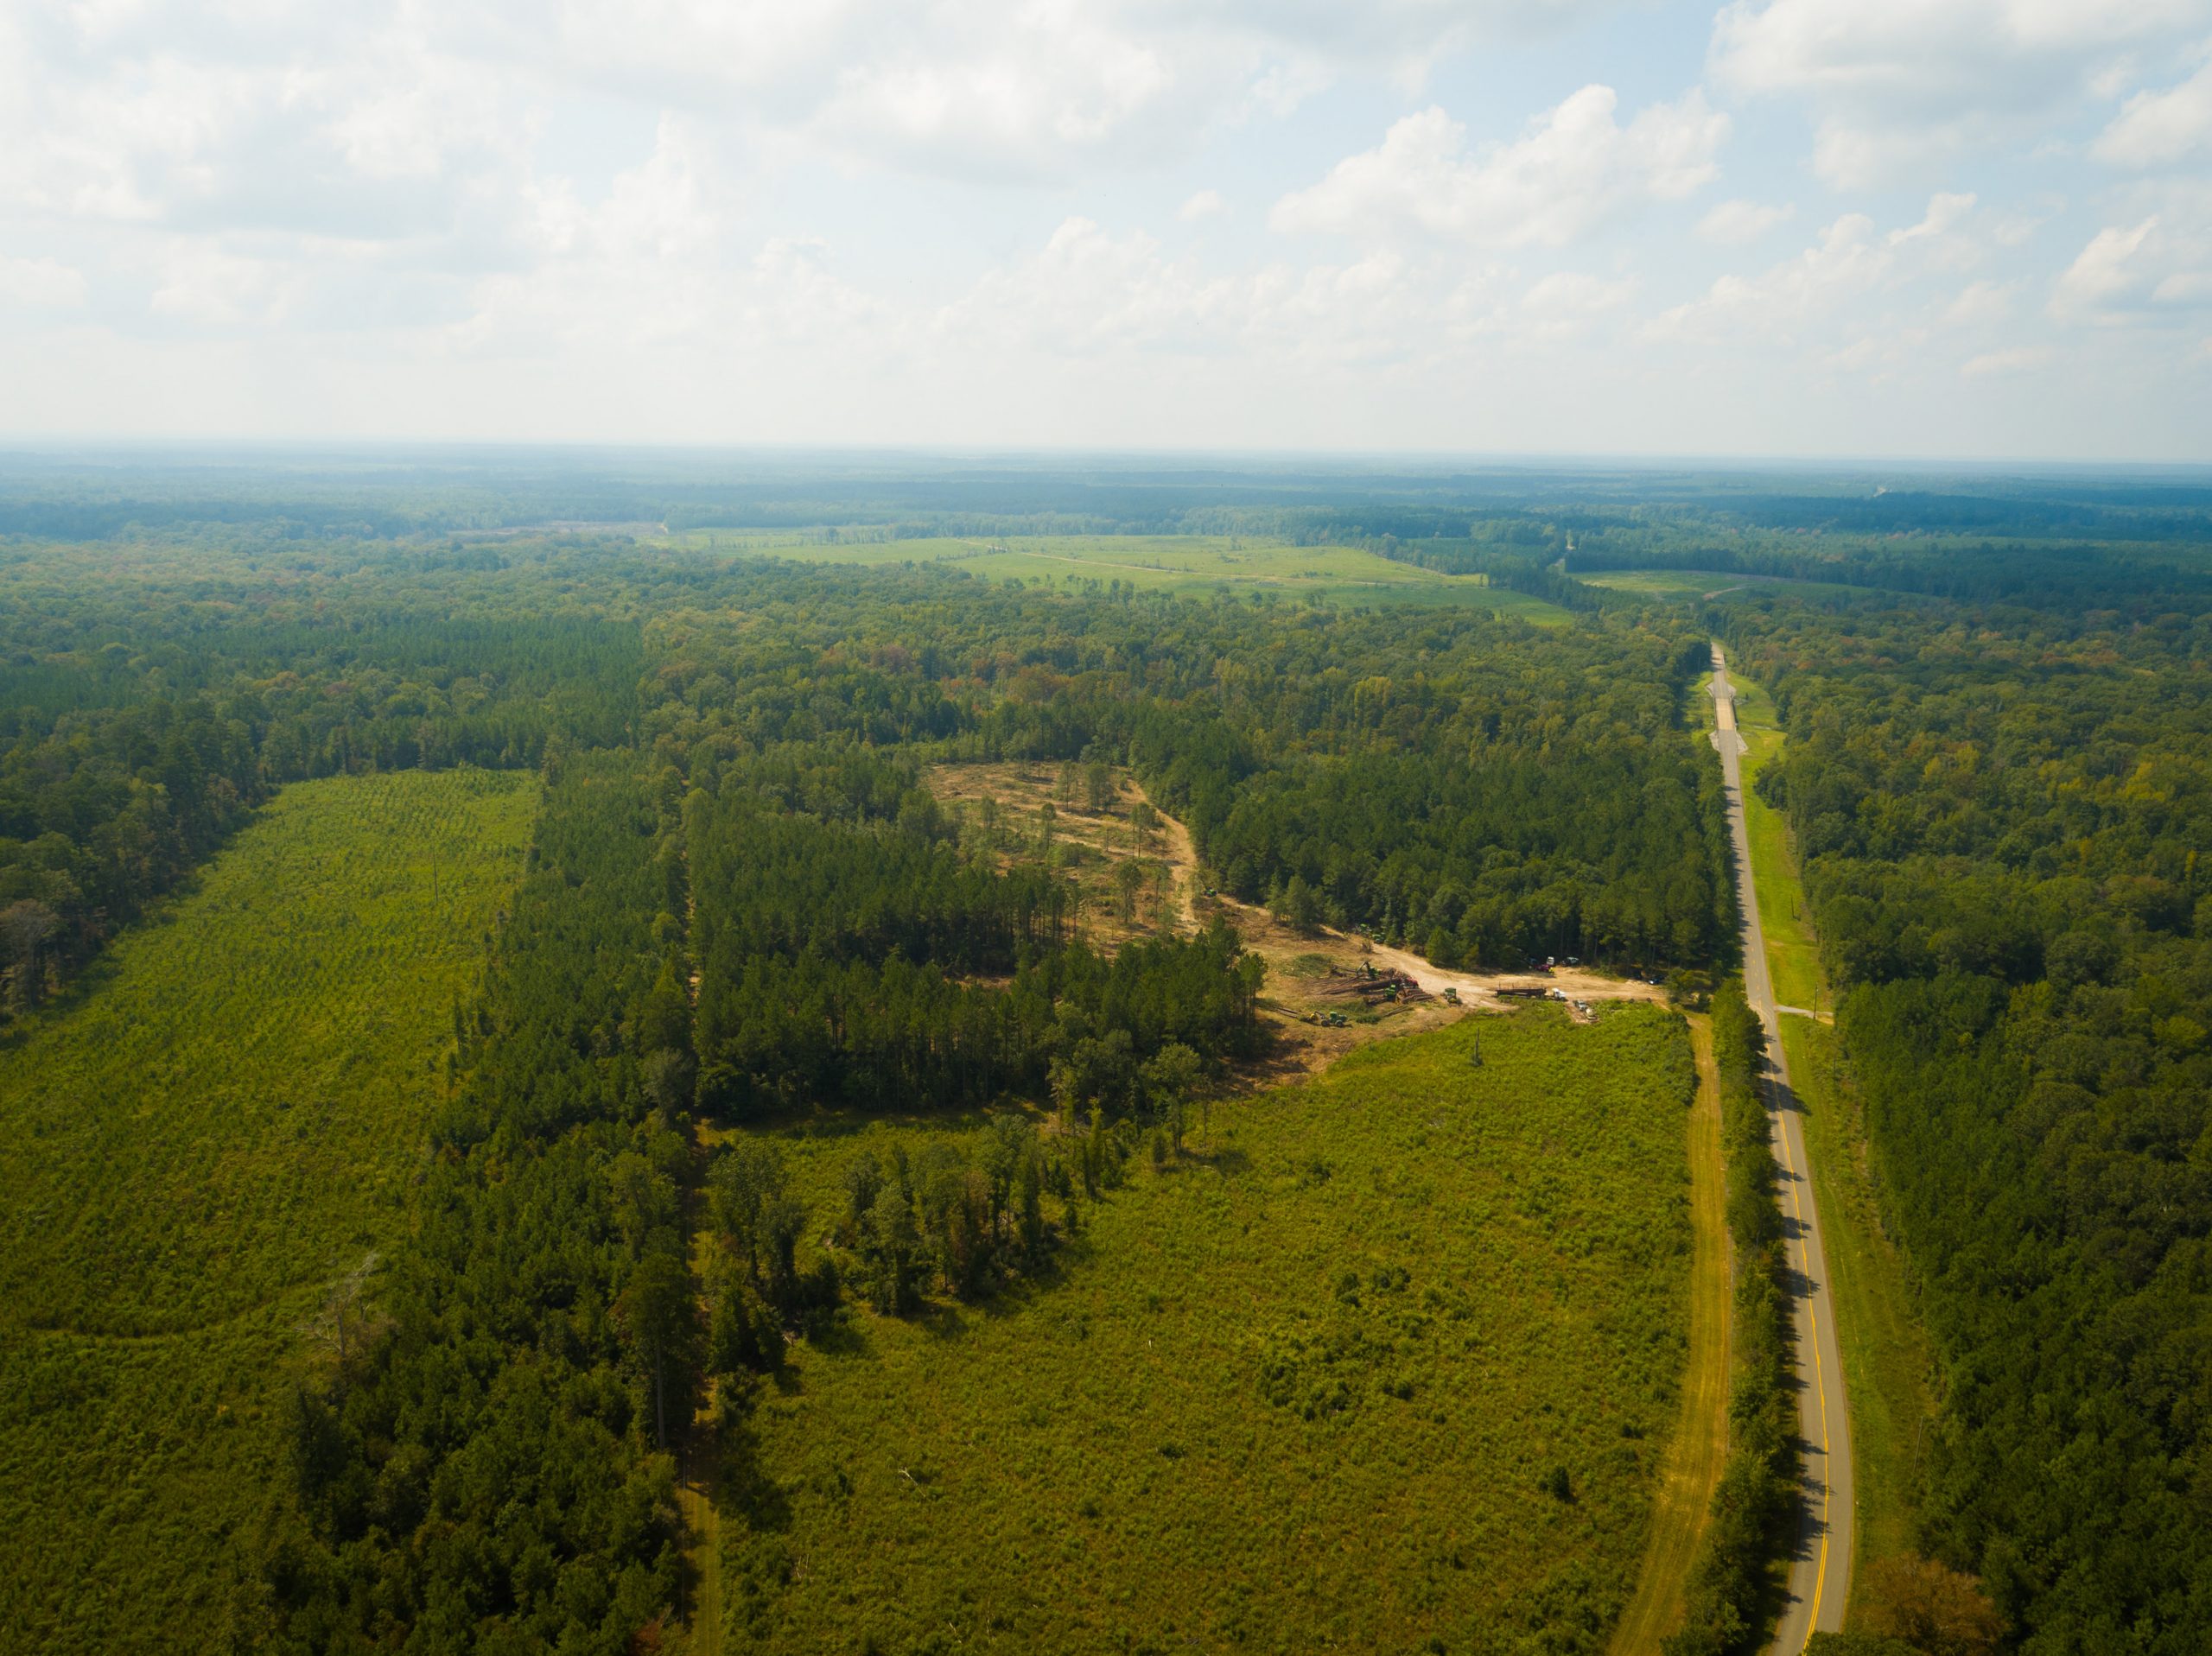
The west coast of the US was most substantially affected by these changes, more than in the US South, but the data below looks at the example of Mississippi which is primarily ‘working forest’ and 88% in private ownership.

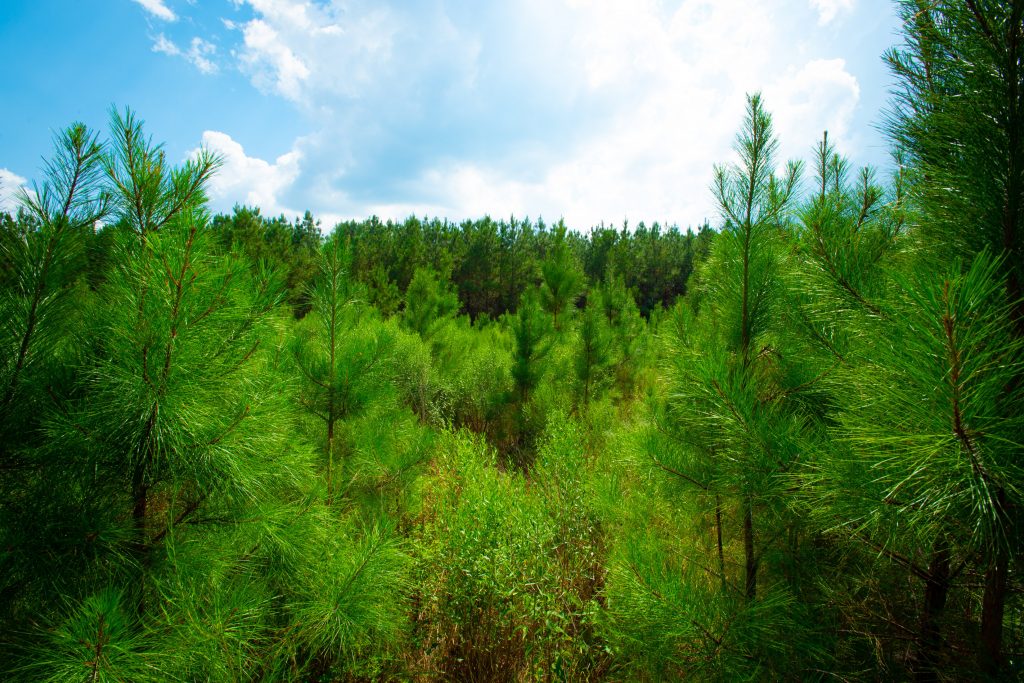
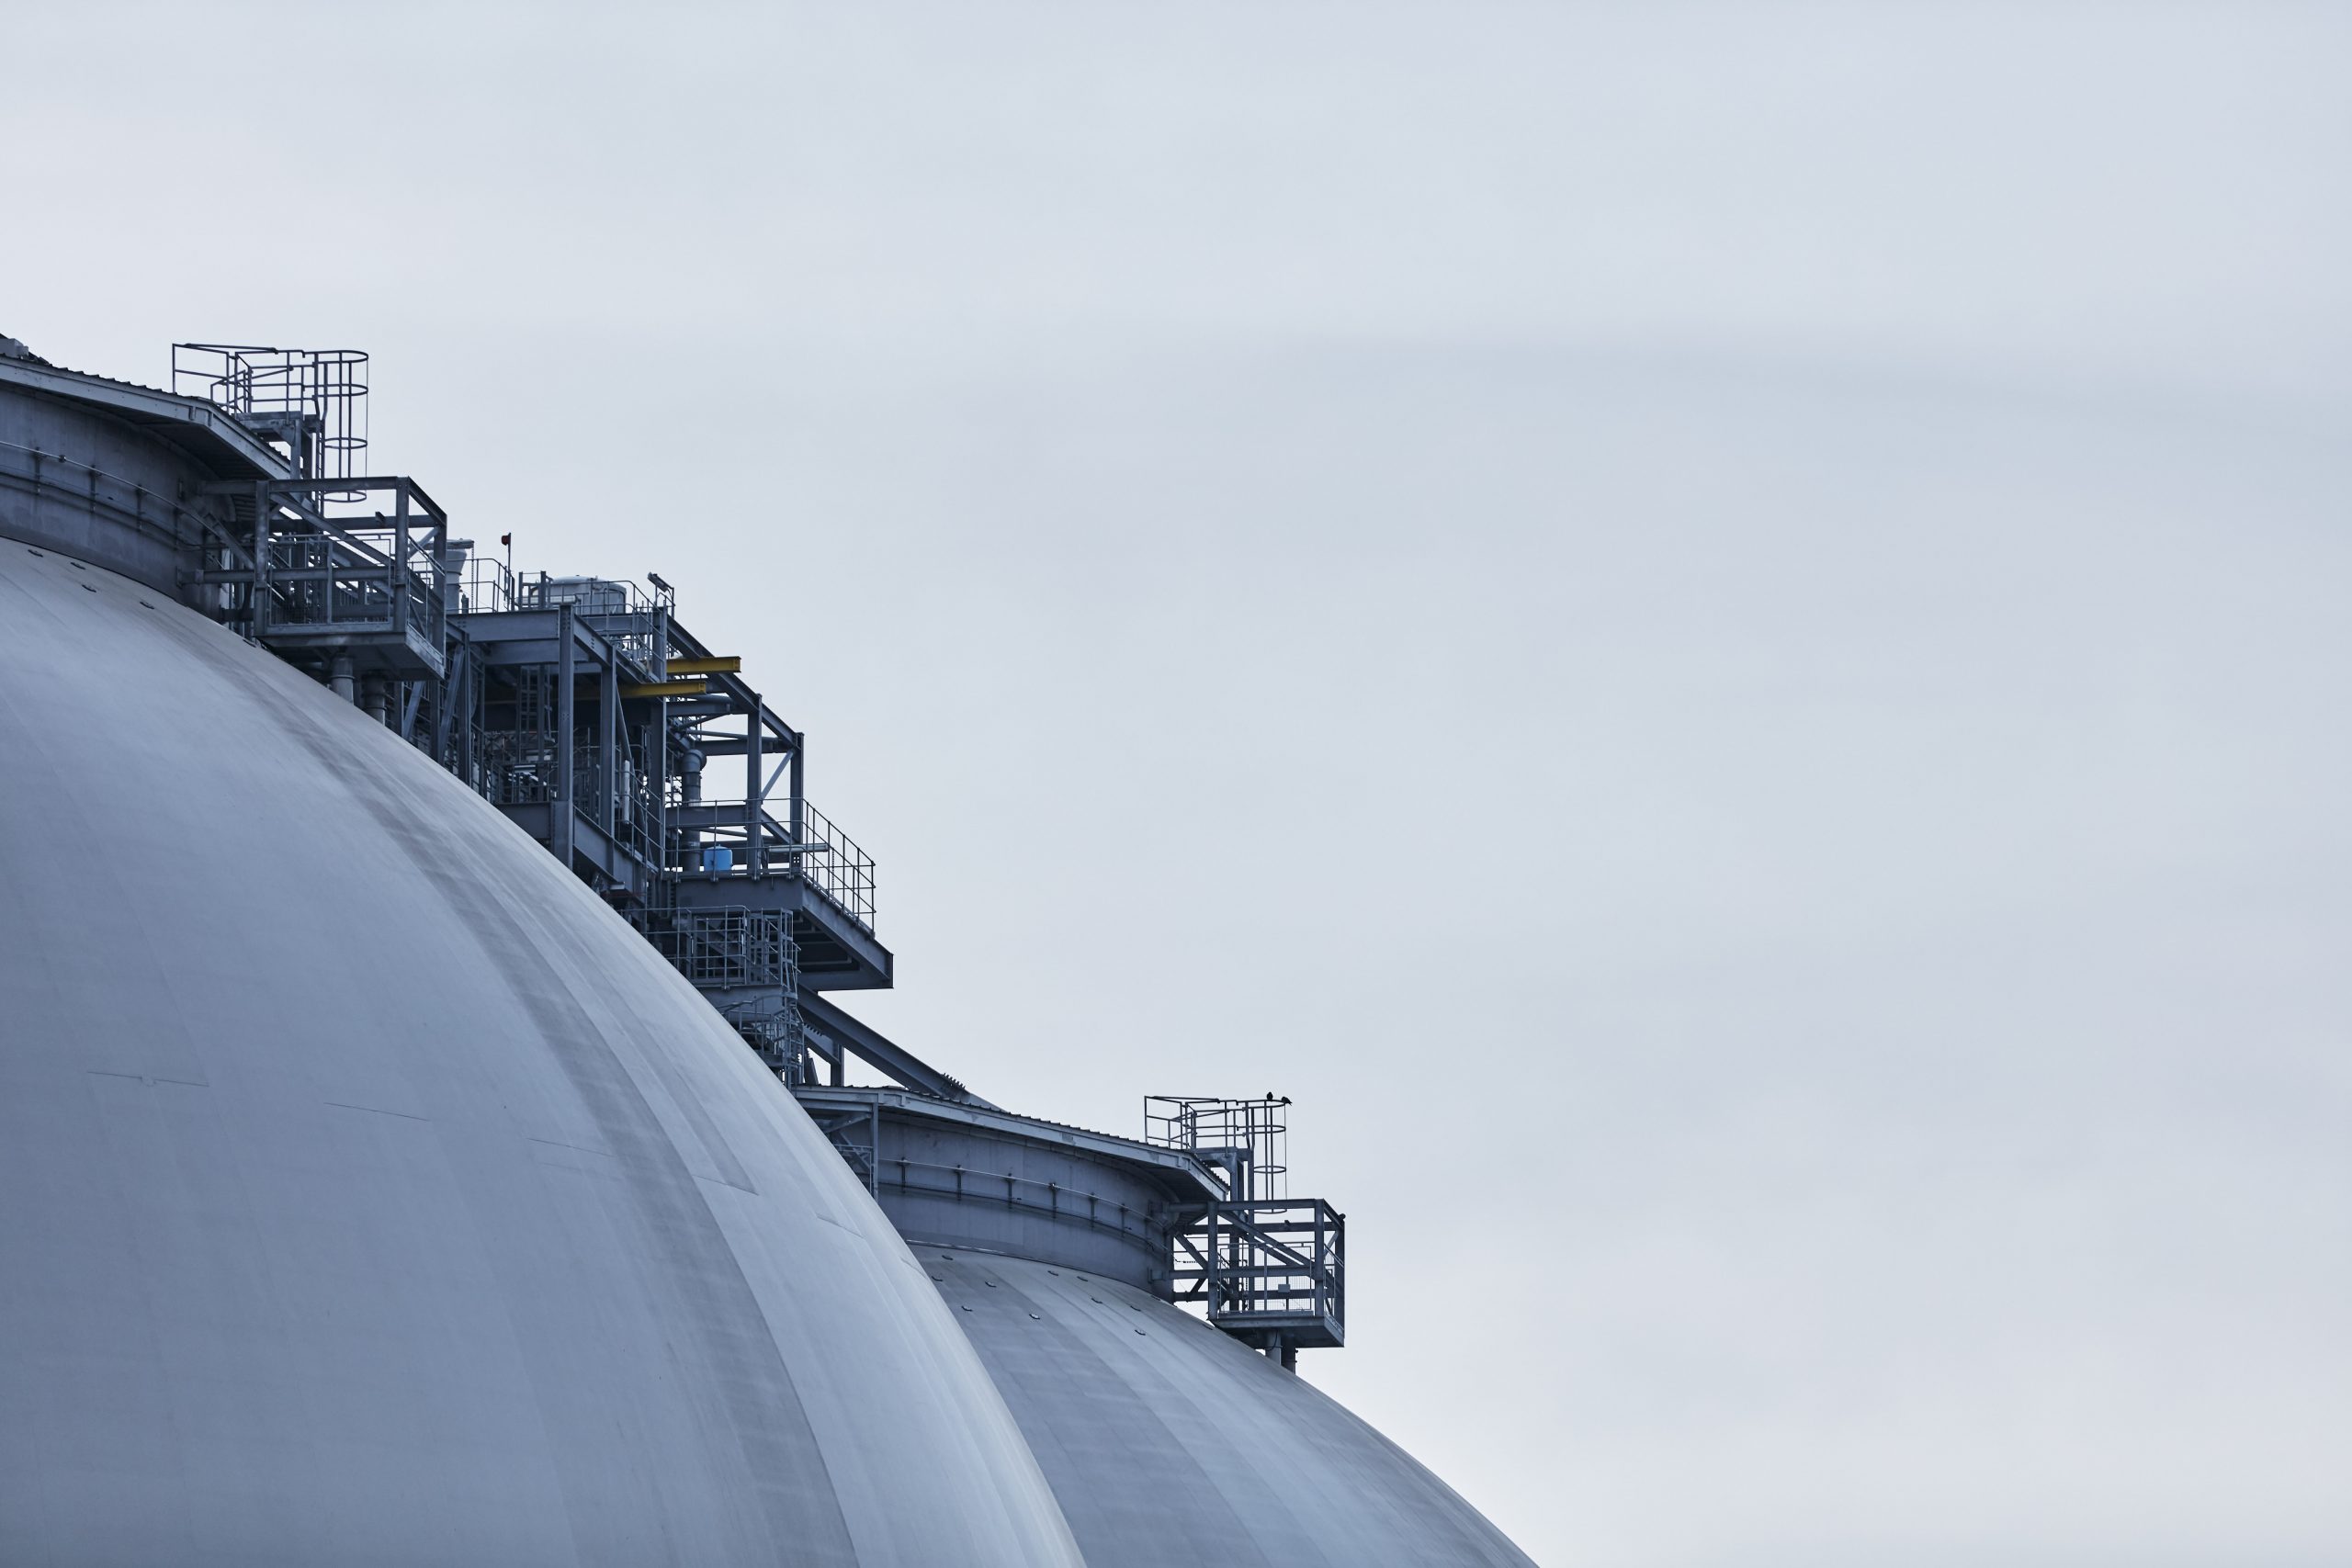
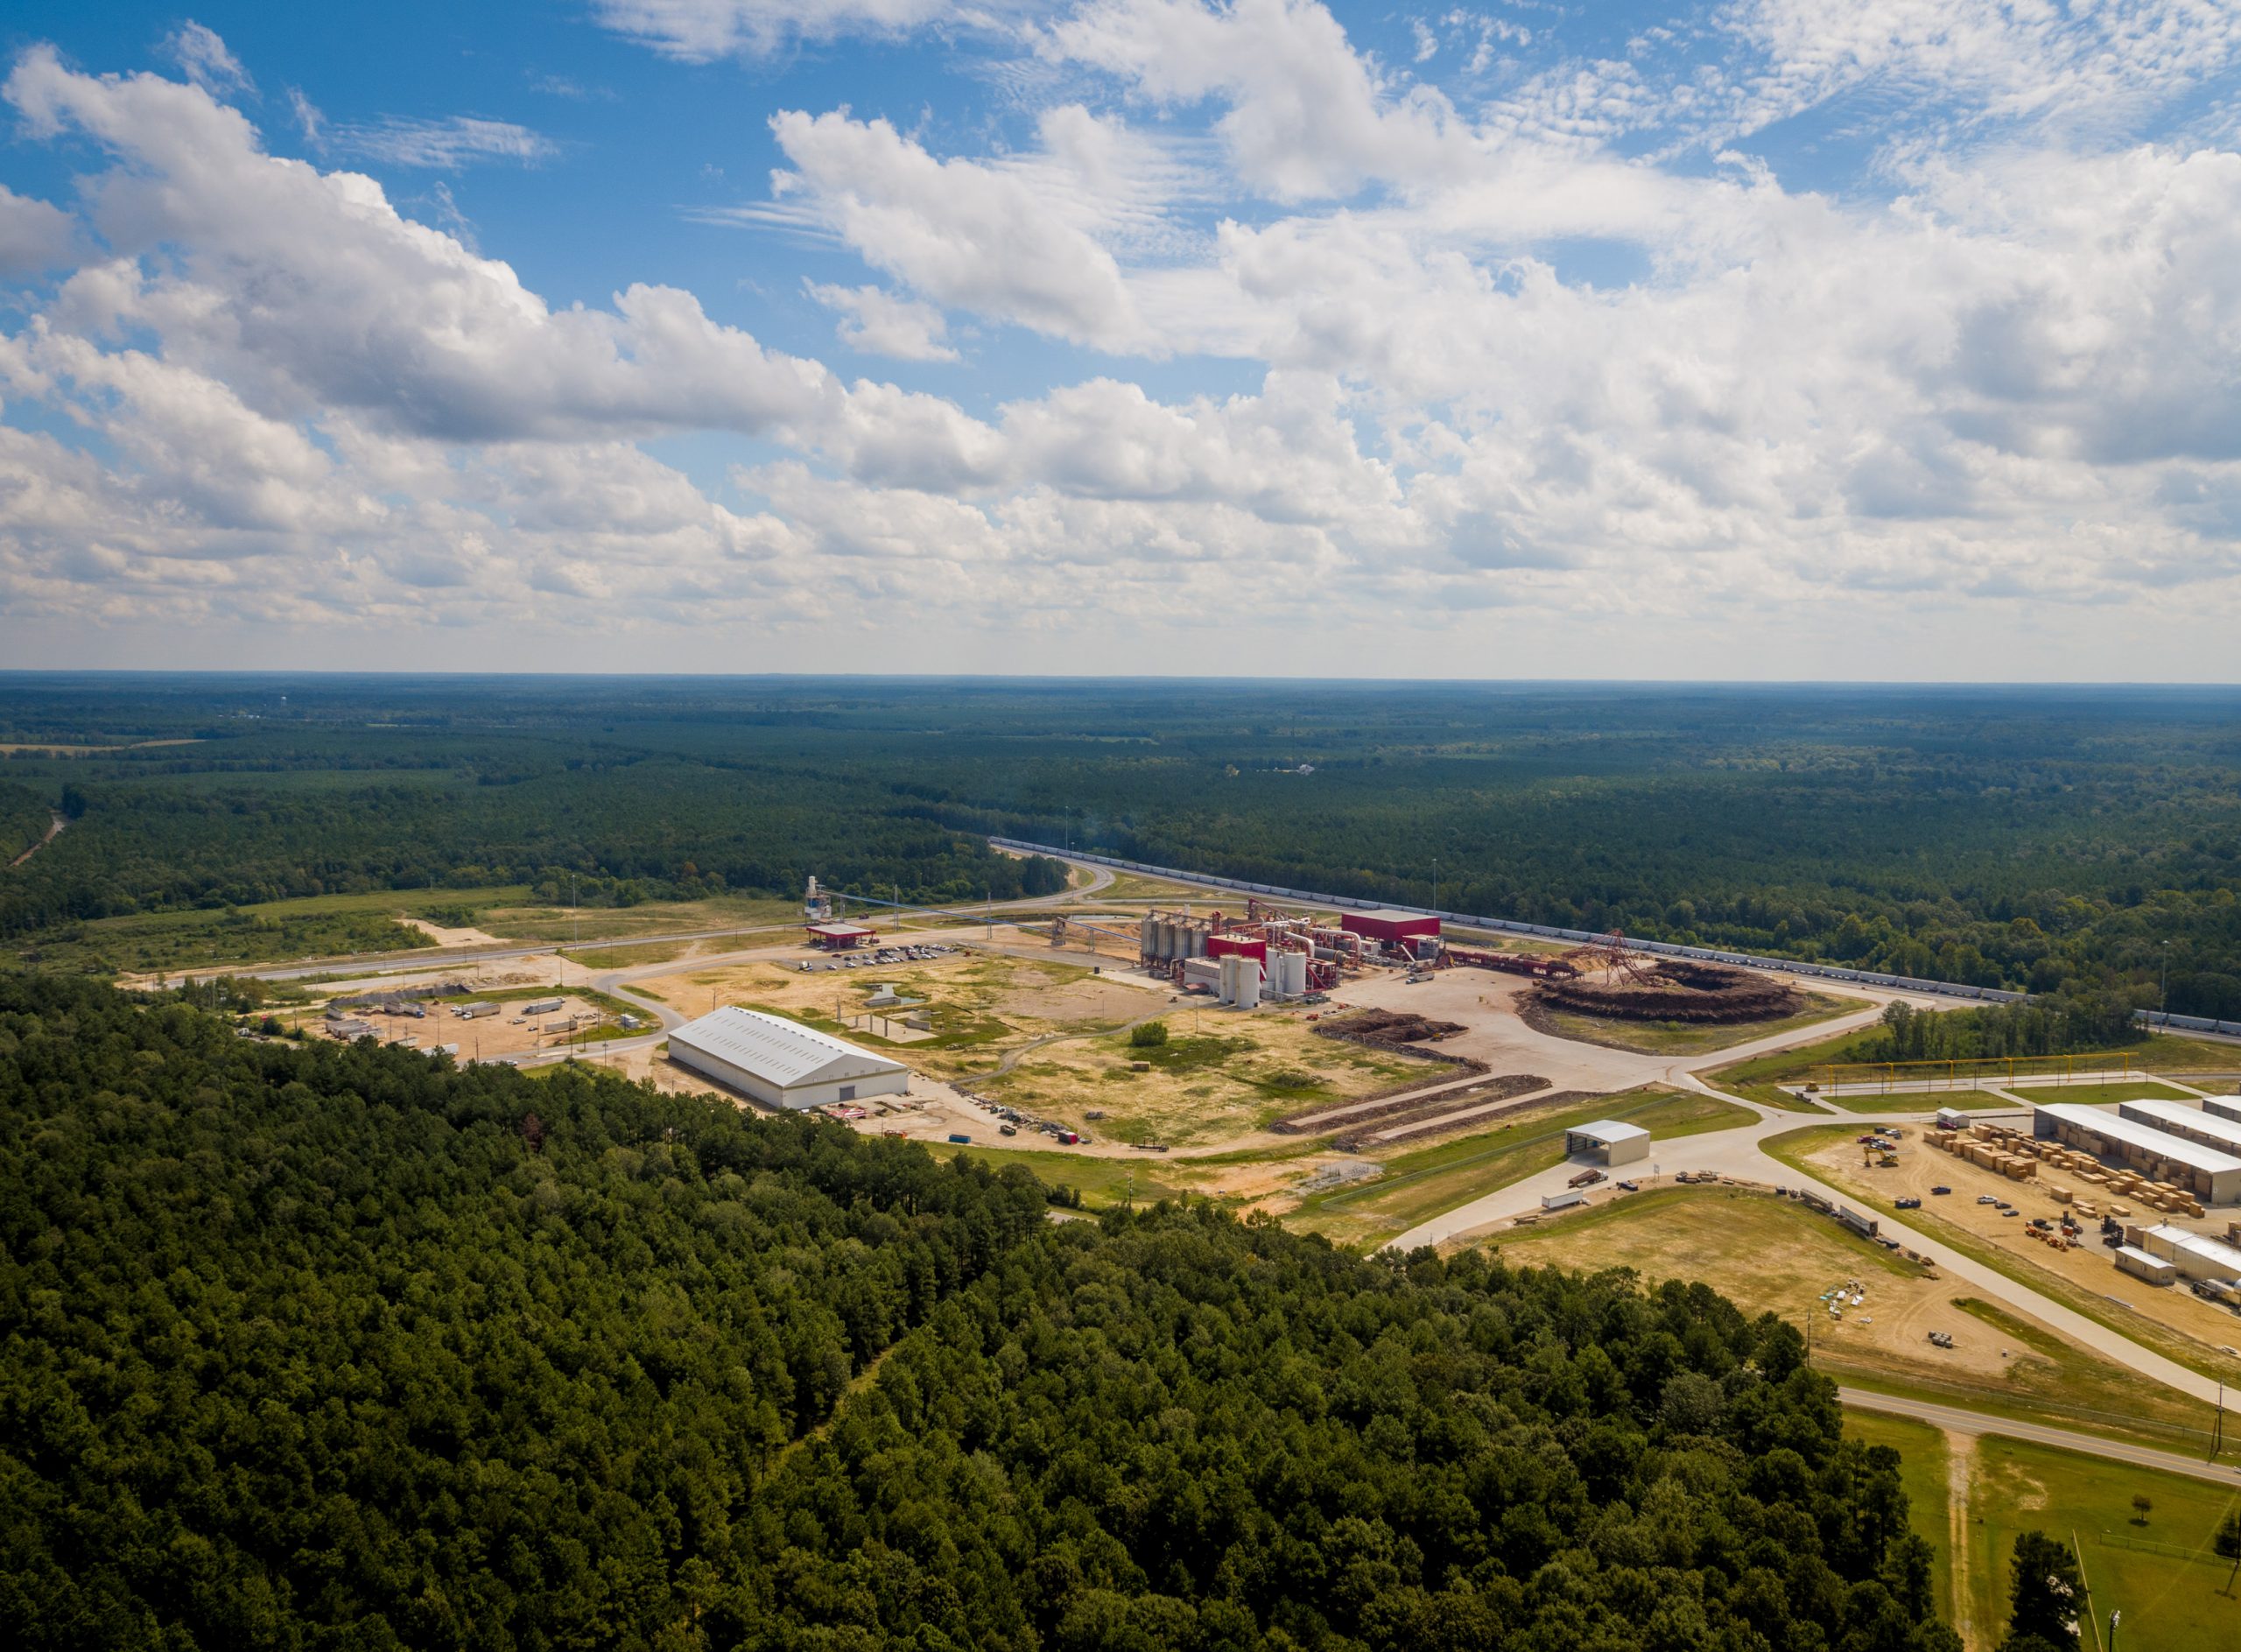
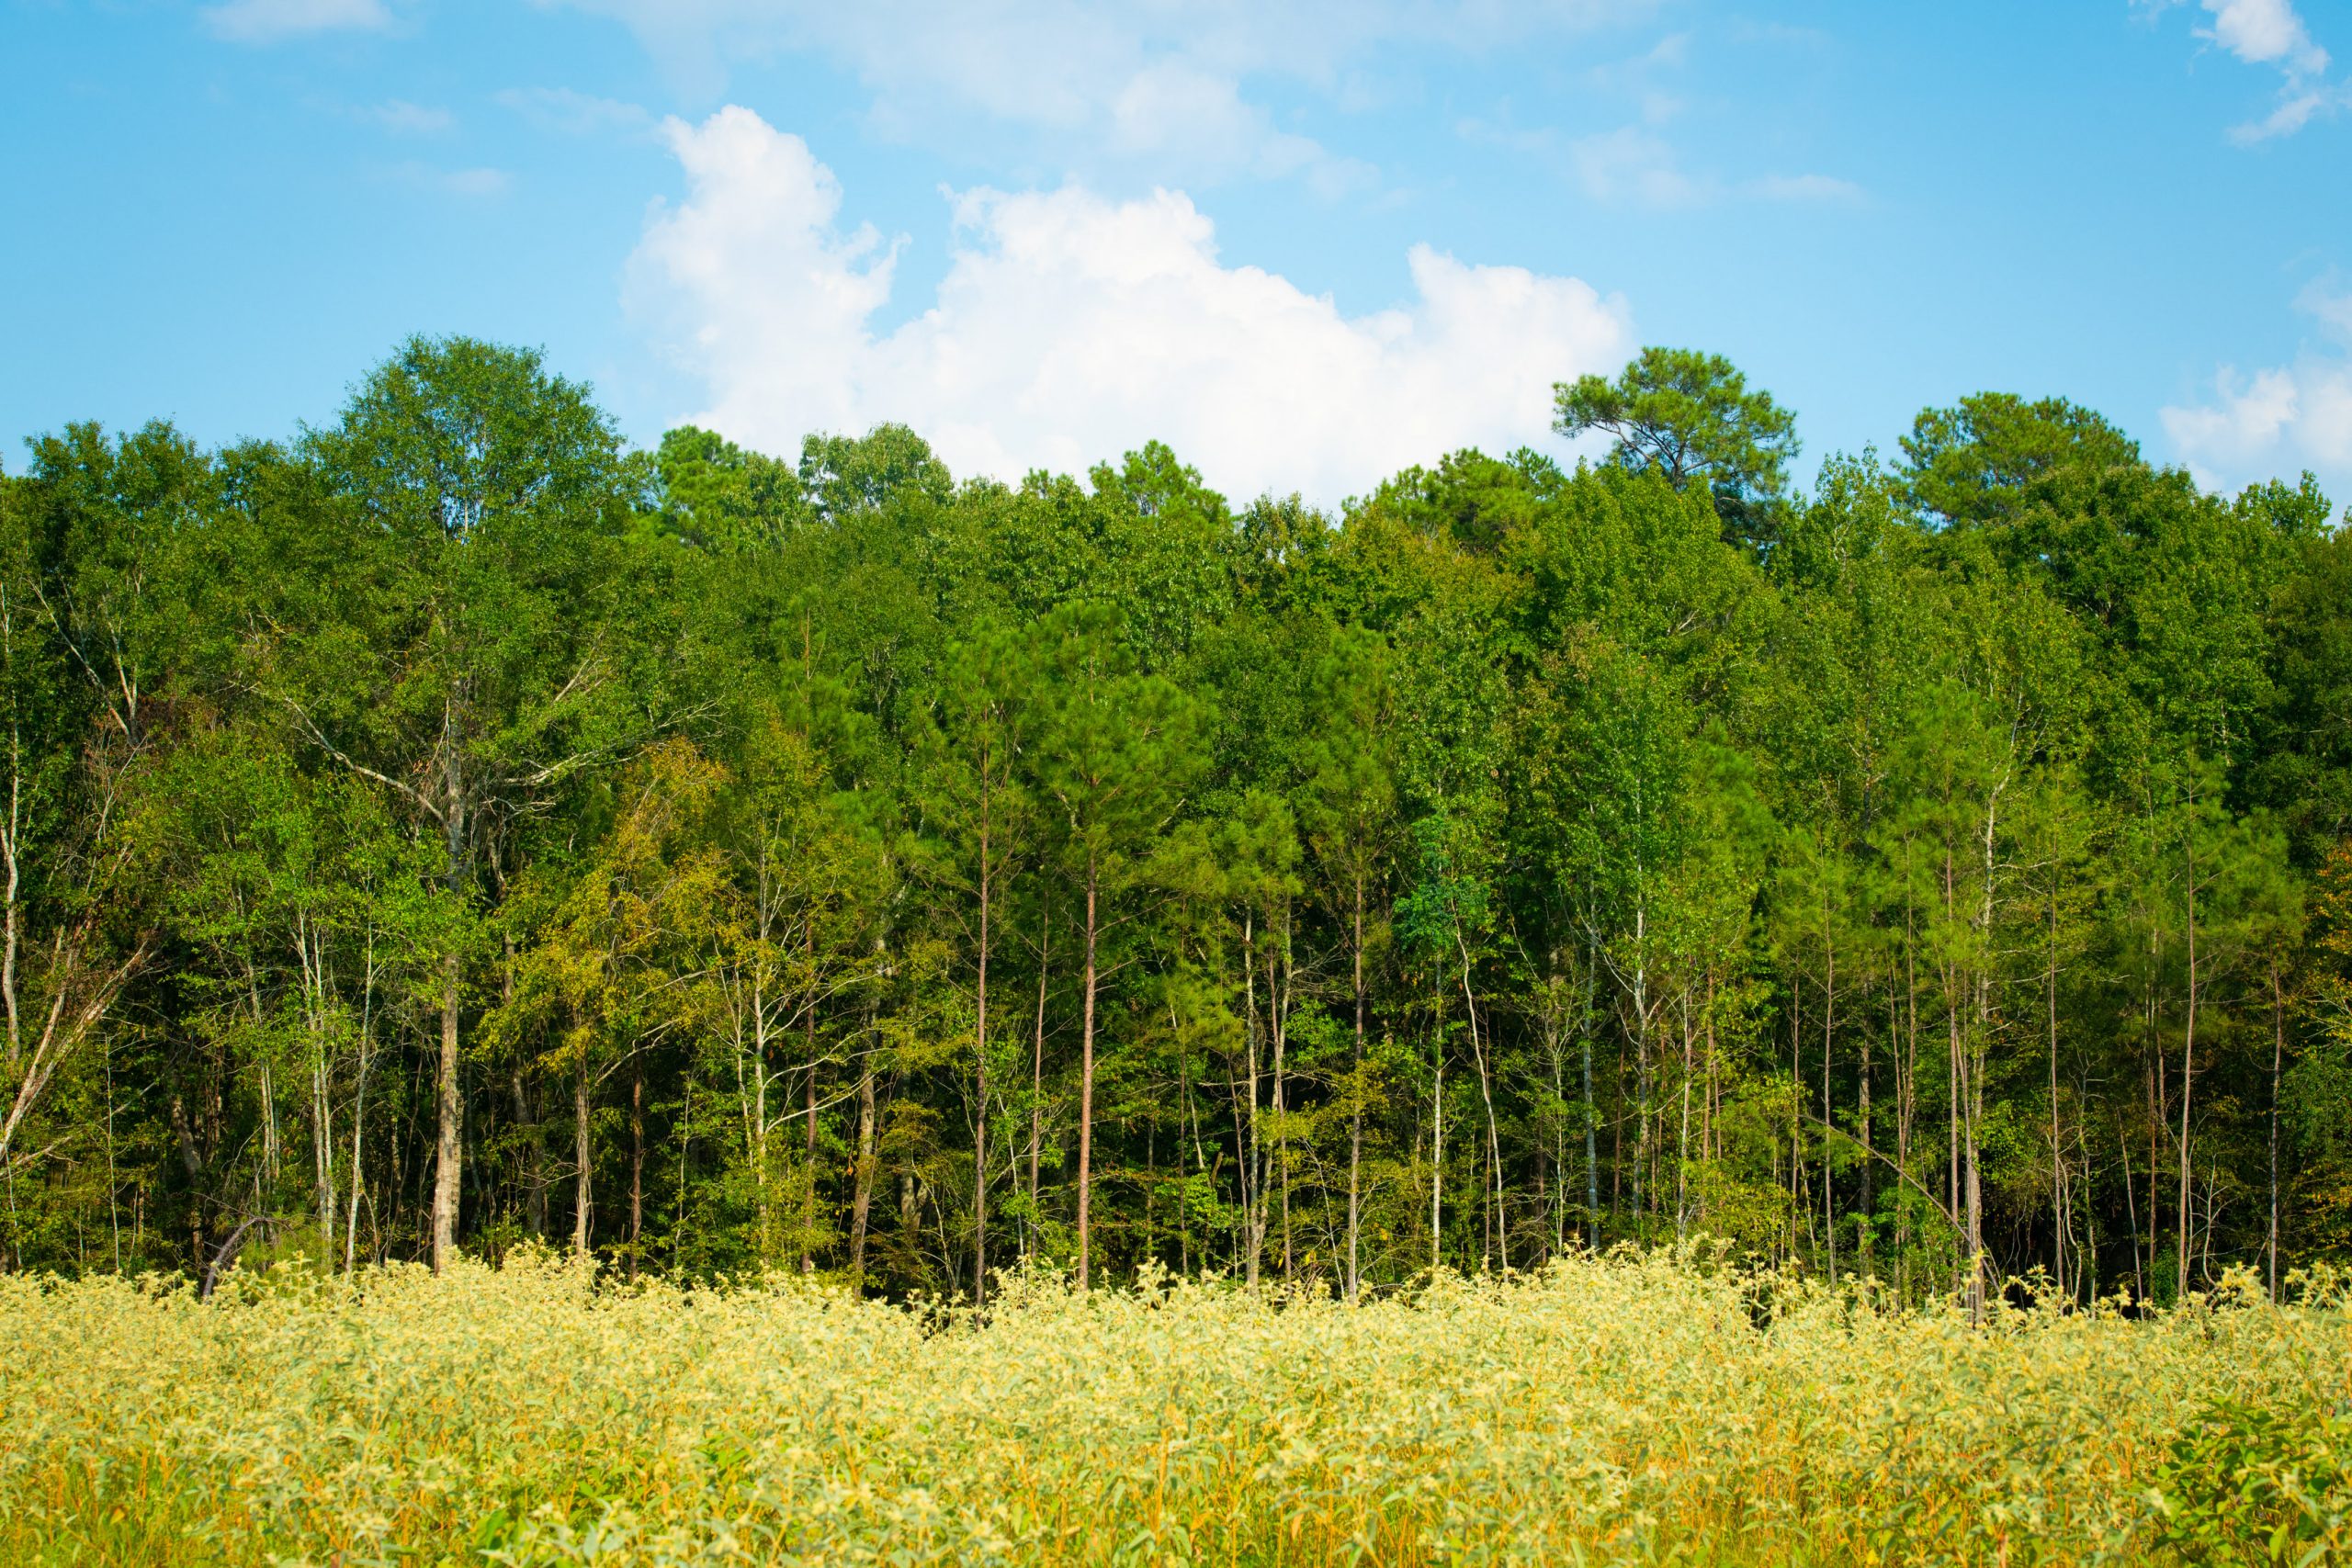
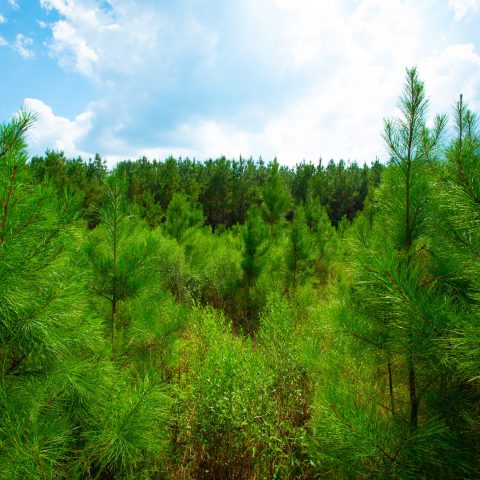
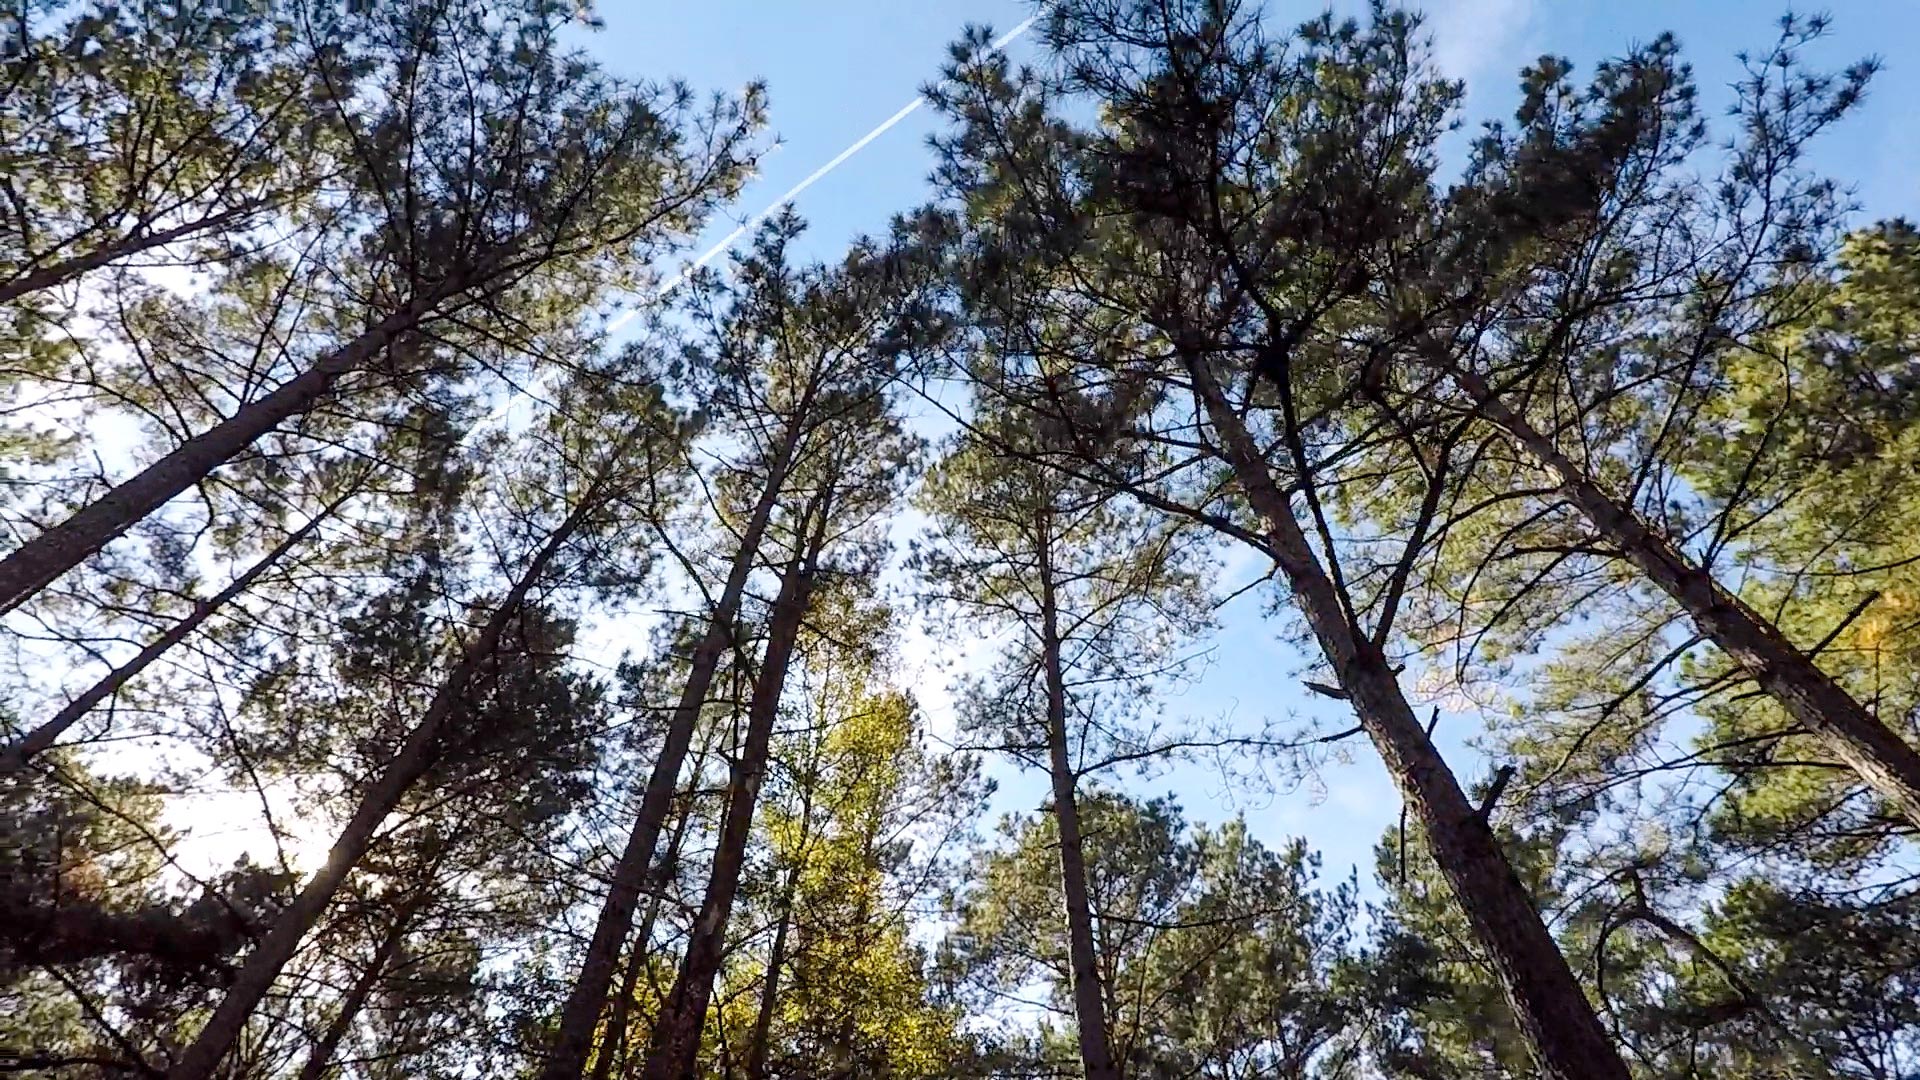
Pine trees in Mississippi working forest

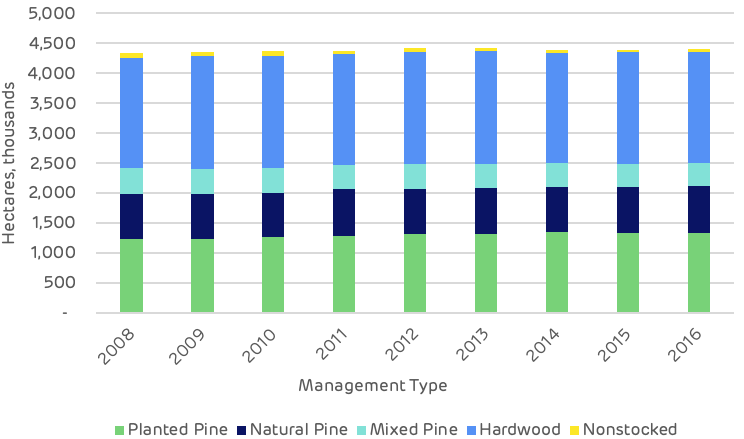
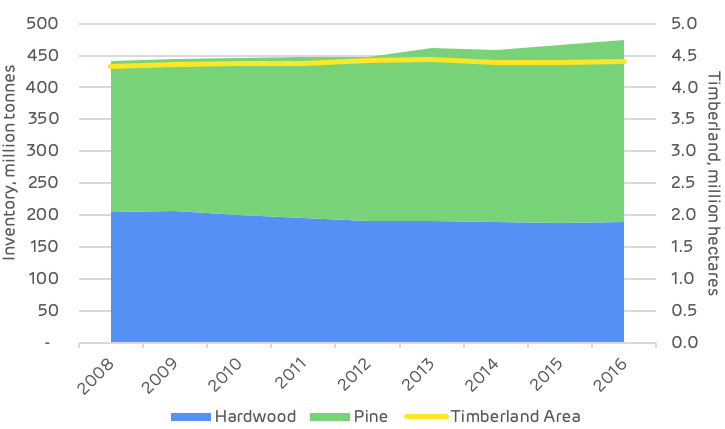
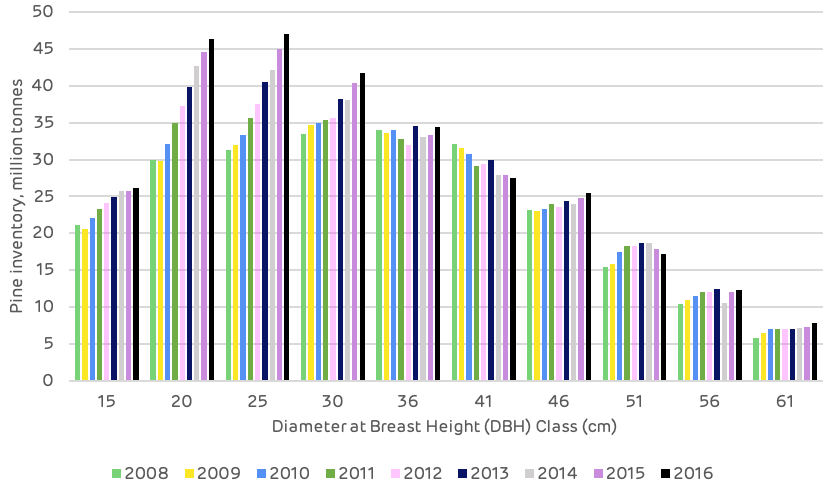
This is the location of Drax’s Amite pellet mill. The charts below show an interesting comparison of forest ownership in Mississippi where limited or no harvesting takes place and where active management for timber production occurs. In the short term the total volume of timber stored per hectare is higher where no harvesting occurs. This makes sense since the forest will keep growing until it reaches its climax point and succumbs to fire, pest or disease.

Average standing volume per unit area in the private sector, where active management occurs, is the lowest as timber is periodically removed for use in solid wood products. Remember that the Oliver et al. analysis (which does not include re-growth), showed that despite a short-term reduction in forest carbon, the total displacement of high-carbon materials with wood for structural timber and energy leads to a far higher emissions saving. It is better to have a lower stock of carbon in a working forest and to be continually sequestering new carbon for storage in solid wood products.

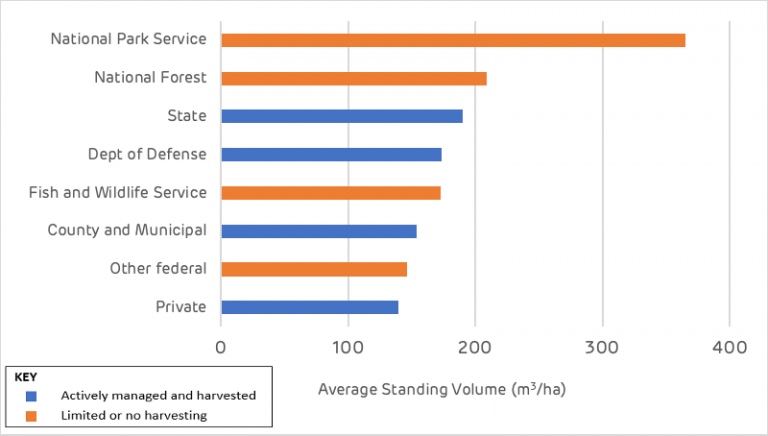
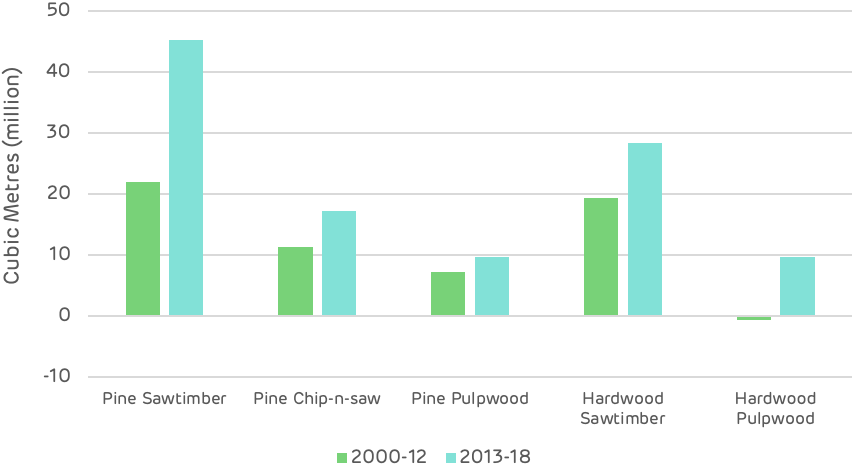
Average standing volume per acre by ownership class, Mississippi[2]

Comparing the average annual growth rates across all forest types in Mississippi, annual growth in the private sector is almost double that in the unharvested public forest. This differential is increased even further if only commercial species like pine are considered and a comparison is made between planted, well managed forests and those that are left to naturally regenerate.

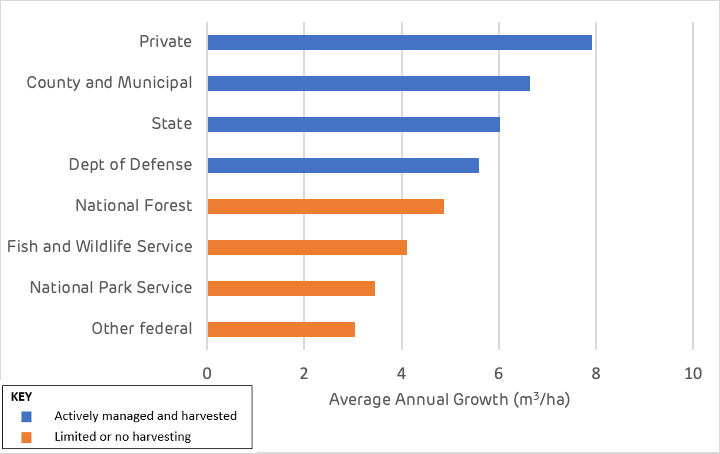
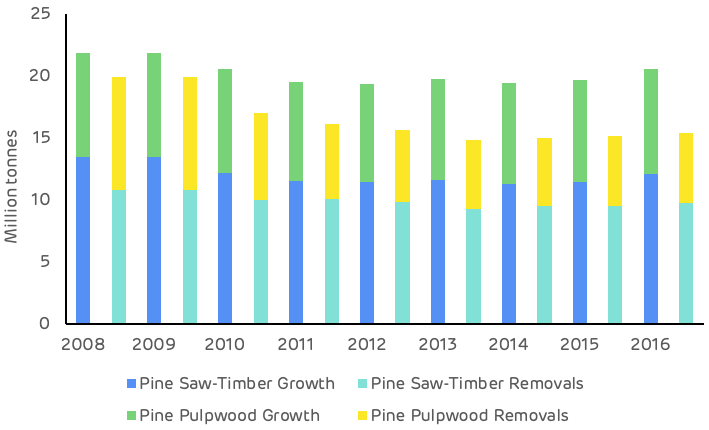
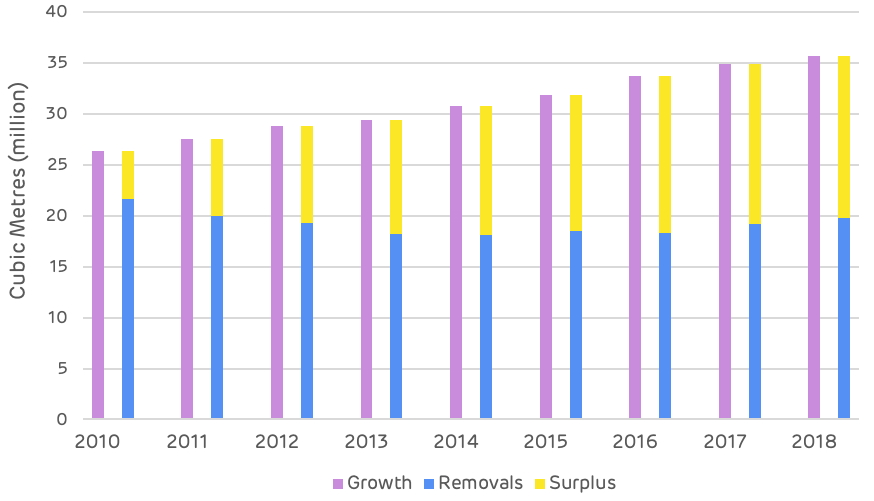
Average growth rates per acre by ownership class, Mississippi[3]

The managed forest area is continually growing and storing more carbon at a materially higher rate than less actively managed forest. As harvesting removes some forest carbon, these products displace high carbon materials in construction and energy and new young forests are replacing the old ones.

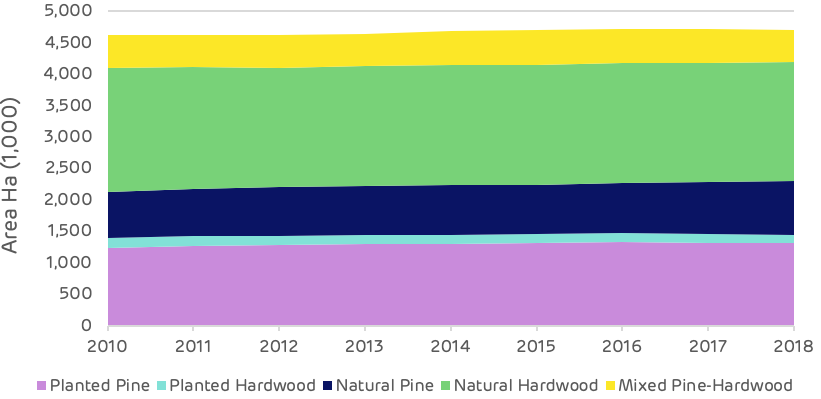
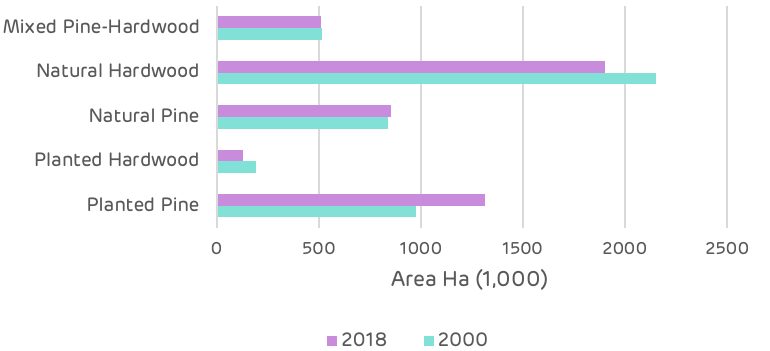
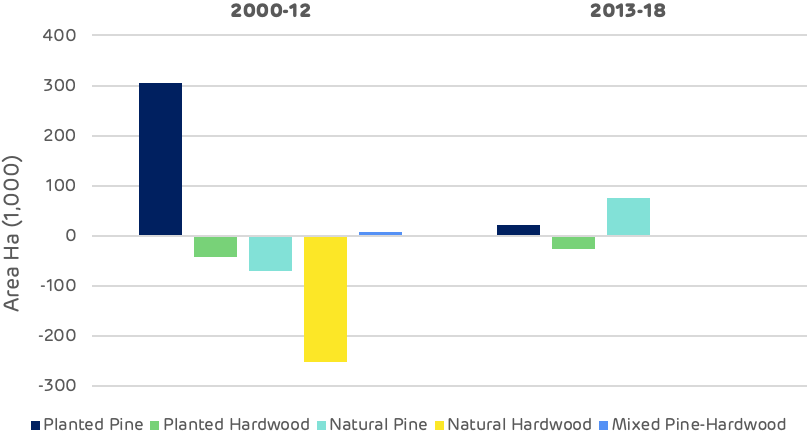
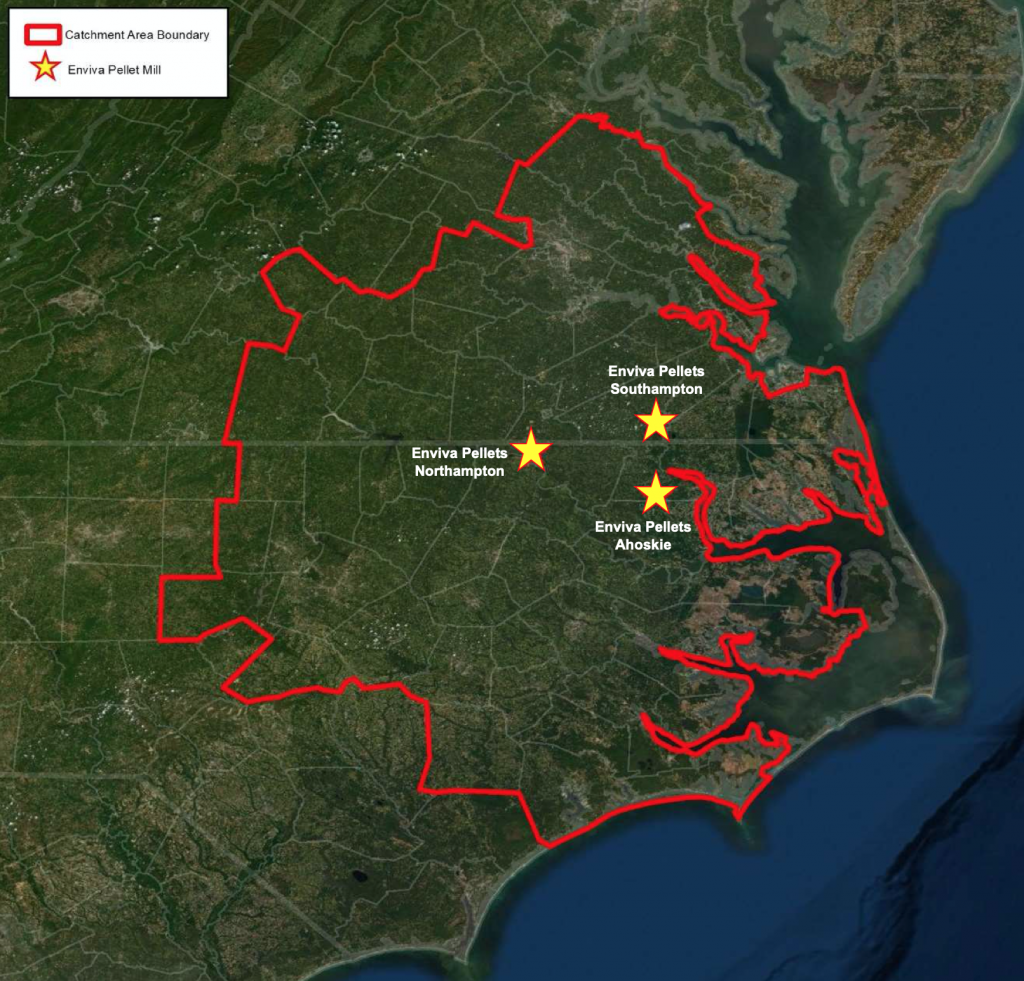
We know that forests are not being ‘lost’ and that the overall storage of carbon is increasing. For example, the Drax catchment area analysis for the Amite biomass wood pellet plant showed an increase in forest area of 5,200 ha and an increase in volume of 11 million m3 – just in the area around the pellet mill. But what happens to protected forest area, the forest reserve with limited or no harvesting?

Over the last 20 years the average annual loss of forest to wildfire in the US has been 2.78 million ha per year (the same as the UK’s total area of productive forest). According to the USFS FIA database the average standing volume of forests in the US is 145 m3 per ha (although in the National Park land this is 365 m3 per ha). Therefore, wildfires are responsible for the average annual combustion of 403 million m3 of wood p.a. (equal to the total annual wood harvest of the US) or 2.5 billion m3 if entirely in National Parks.

One cubic metre equates to a similar quantity of CO2 released into the atmosphere each year, therefore wildfires are responsible for between 407 million and 2.5 billion tonnes of CO2 emissions in the US each year[4].
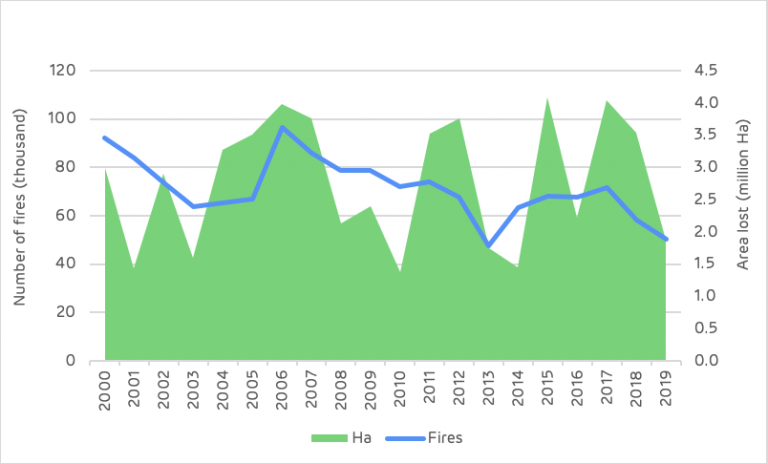
Wildfires in the US

Starrs et al. (2018)[5] demonstrated that the risk of wildfire was significantly higher in federally owned reserved forest (where harvesting and management were restricted), compared to privately owned forests with active management.

In California, the risk of wildfire in federal forest (2000-15) was almost double the risk in private forests where both had State firefighting resources. The risk of fires in federal lands had increased by 93% since 1950-66, compared to only 33% in non-federal forests, due to the change in forest management practice in the 1970s.

Forest fire in California

Closing the gate means that the carbon stock is maintained and grows in the short term, but there is no opportunity for carbon to be stored in solid wood products, no high-carbon materials are displaced (concrete, steel and fossil fuels) and the rate of sequestration declines as the forest ages. Eventually the forest will reach its natural climax and die, releasing all of that carbon back into the atmosphere. The managed forest, by contrast, will have a lower standing volume at a certain point in time, but will be in a continual cycle of sequestration, storage and regrowth – with a much lower risk of fire and disease. If managed correctly, the rate of growth and standing volume will also increase over time.

How should we manage the forest

Forests are extremely variable, there are a vast variety of tree species, soil, geological features, water regimes, temperature, climate and many other factors that combine to make unique ecosystems and forest landscapes. Some of these are rare and valuable for the exceptional assemblages they contain, some are commonplace and widespread. Some are natural, some man-made or influenced by human activity.

Forests have many important roles to play and careful management is required. In some cases that management may be protection, preservation and monitoring. In other cases, it may be active harvesting and planting to optimise growth and carbon storage.

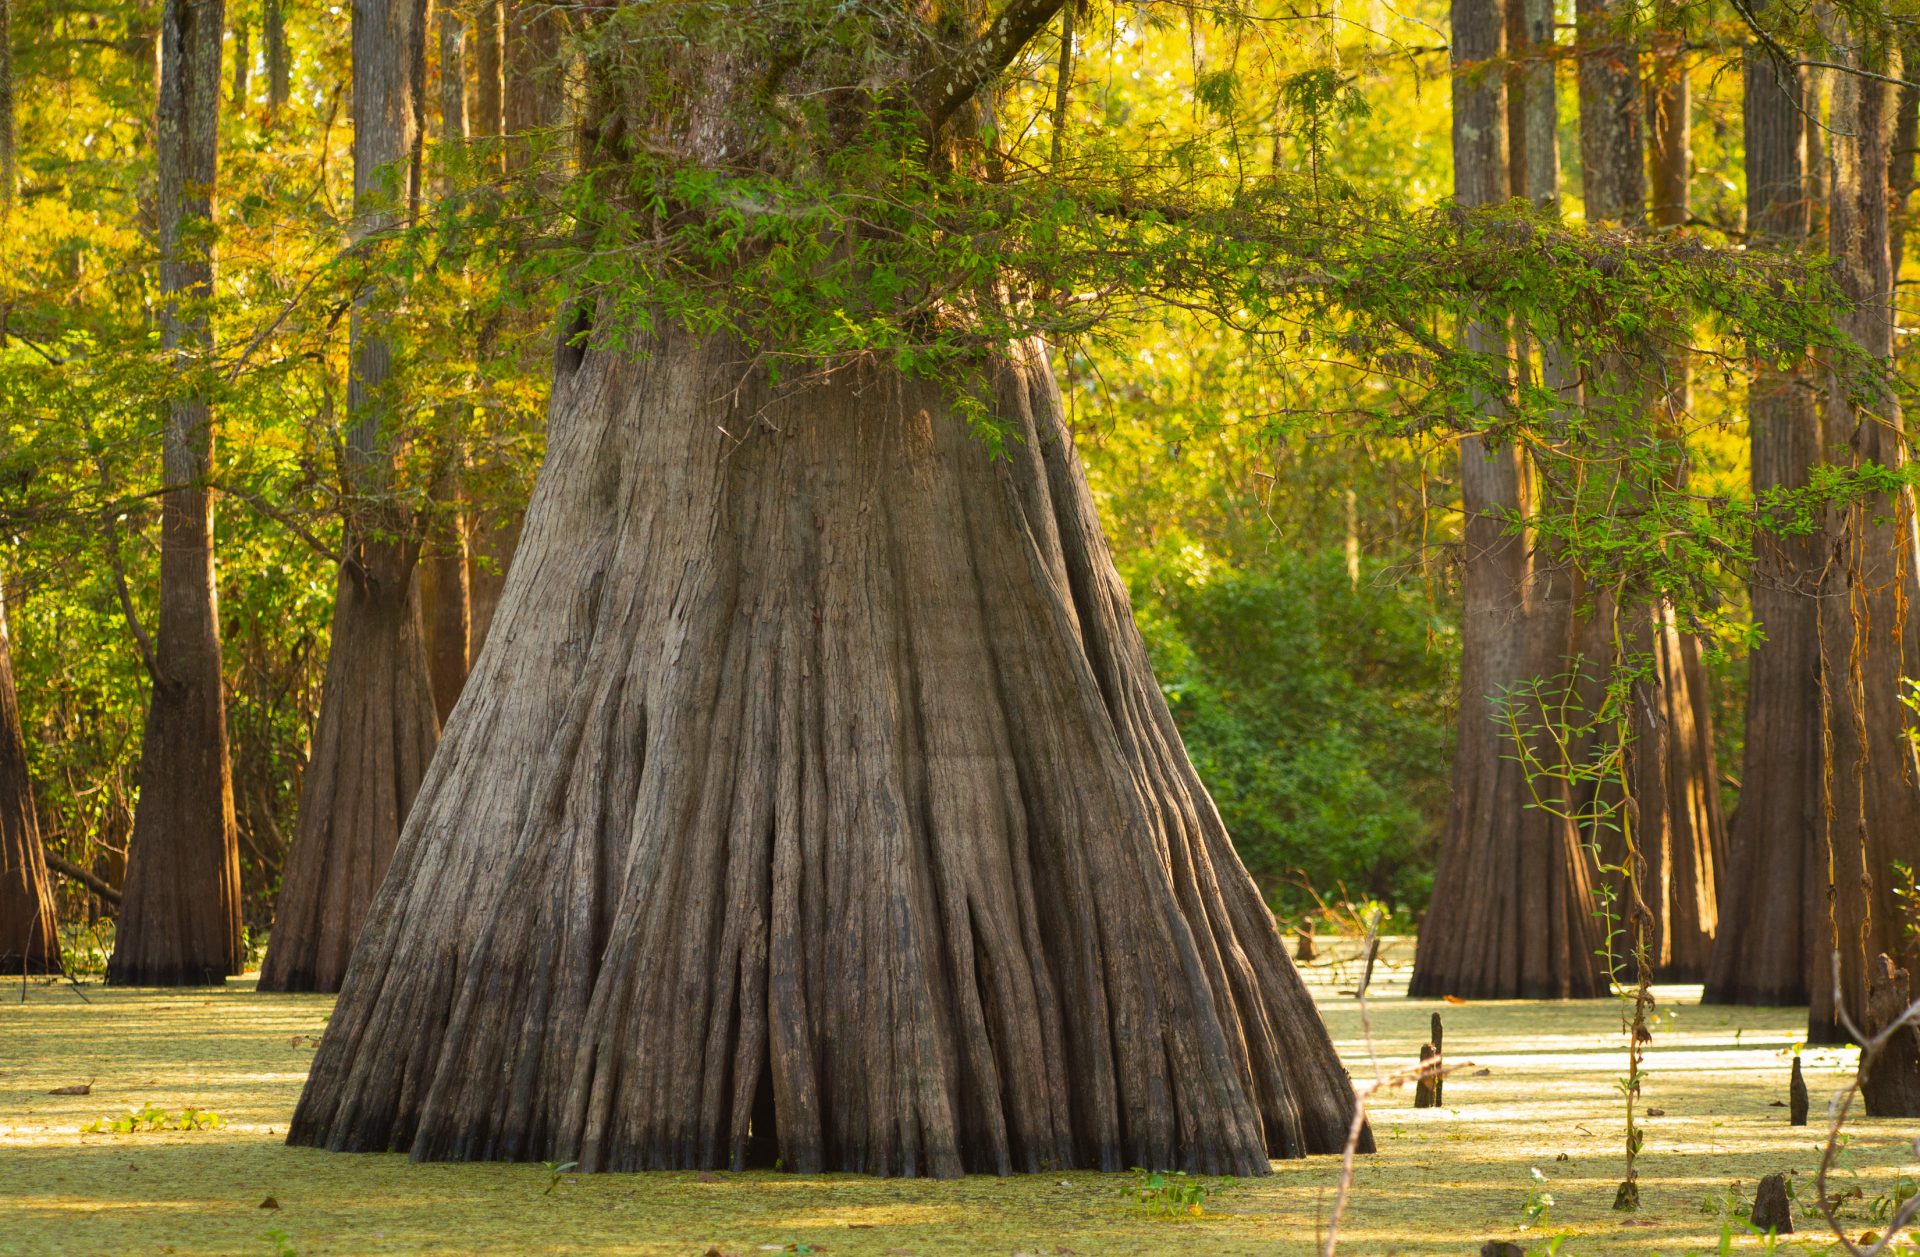
Cypress forests in the Atchafalaya Basin in Louisiana are an example of a forest landscape where the suitable management practice is protection, preservation and monitoring

For each forest type and area, we need to recognise the highest or best purpose(s) for that land in the objectives set and carefully plan the management to optimise and sustain that value. The primary value could be in species and habitat diversity or rarity; provision of recreation and aesthetic value; production of timber, forest products and revenue generation; carbon sequestration and storage; water management and other ecosystem benefits.

Most likely it will be a combination of several of these benefits. Therefore, best management practice usually involves optimising each piece of forest land to provide the most effective combination of values. Forests can deliver many benefits if we are sensible about how we manage them.

In a recent study Favero et al. (2020)[6] concluded that: Increased bioenergy demand increases forest carbon stocks thanks to afforestation activities and more intensive management relative to a no-bioenergy case. Some natural forests, however, are converted to more intensive management, with potential biodiversity losses…the expanded use of wood for bioenergy will result in net carbon benefits, but an efficient policy also needs to regulate forest carbon sequestration.

[1] CHADWICK DEARING OLIVER, NEDAL T. NASSAR, BRUCE R. LIPPKE, and JAMES B. McCARTER, 2014. Carbon, Fossil Fuel, and Biodiversity Mitigation with Wood and Forests.
[2] US Forest Service, FIA Database, 2020.
[3] US Forest Service, FIA Database, 2020.
[4] Assumes an average basic density of 570kg/m3 and 50:25:25 ratio of cellulose, lignin and hemicellulose.
[5] Carlin Frances Starrs, Van Butsic, Connor Stephens and William Stewart, 2018. The impact of land ownership, firefighting, and reserve status on fire probability in California.
[6] Alice Favero, Adam Daigneault, Brent Sohngen, 2020. Forests: Carbon sequestration, biomass energy, or both?

4 of the longest running electrical objects

How long do your electrical devices last? We’re not talking about battery life, but the overall lifetime of the items we use every day that are powered by electricity.

It’s accepted that today’s electrical devices have short life spans, in part a symptom of rapidly evolving technology fuelling the need for constant consumer updates and in part a result of planned obsolescence (devices being manufactured to fail within a set number of years to encourage repeat purchases). Electrical devices aren’t purchased with the belief they will last a lifetime.

But it hasn’t always been this way. Before rapid technological development and the rise of fast consumerism, devices were built to last.

Over the relatively short history of electrical appliances, there are tools and equipment that have operated for decades. Some of these remain in operation today with hardly any alterations, but for a few tweaks here and there to upgrade or preserve.

Built to last, here are a few of the longest running electrical inventions.

The Oxford Electric Bell located in the Clarendon Laboratory, University of Oxford.

1840 – The Oxford Electric Bell

The Oxford Electric Bell is not your typical bell – not just in how it looks, but in the fact it has been in constant operation since the mid 19th Century. It consists of two primitive batteries called ‘dry piles’ with bells fitted at each end and a metal ball that vibrates between them to very quietly, continuously ring.

Its original purpose is unidentified, but what is known is that the bell is the result of an experiment put on by the London instrument-manufacturing firm Watkins and Hill in 1840. Acquired by Robert Walker, a physics professor at the University of Oxford in the mid 1800s, it’s displayed at Oxford’s Clarendon Laboratory which explains why it’s also known as the Clarendon Pile.

The exact make-up of the dry piles is unknown, as no one wants to tamper with them to investigate their composition out for fear of ending the bell’s 179-year-long streak. As a result, confusion remains as to why The Oxford Electric Bell has remained in operation for so long.

Souter Lighthouse, Tyneside, England.

1871 – Souter Lighthouse in South Shields, UK

The lamp in the Souter lighthouse, situated between the rivers Tyne and Wear, was the most advanced of its day when it was first constructed. Designed to use an alternating electric current, it was the first purpose-built, electrically powered lighthouse in the world. Although no longer in operation today, it ran unchanged for nearly 50 years.

The light was generated using carbon arc lamps, and it originally produced a beam of red light that would come on once every five seconds.

Souter’s original lamp operated unchanged from 1871 to 1914, when it was replaced by more conventional oil lamps. It was altered again to run on mains electric power in 1952 and was finally deactivated in 1988.

1896 – The Isle of Man’s Manx Electric Railway

Tourism hit the Isle of Man in the 1880s and with it came the construction of hotels and boarding houses. Two businessmen saw this as an opportunity to purchase a large estate on the island and develop it into housing and a pleasure development. The Manx Parliament approved the sale in 1892 on one condition: that a road and a tramway be built to give people access.

Snaefell mountain railway station, Isle of Man.

It was decided that the tram would be electric, and work began in the spring of 1893, with the tram system up and running by September of that year. Although the track and its cars have been extended and updated over time, the first three cars remain the longest running electric tramcars in the world.

Photograph by Dick Jones (centennialbulb.org)

1902 – The Centennial Bulb

The unassuming Centennial Bulb has been working in the Livermore, California Fire Department for 117 years. The bulb was first installed in 1902 in the department’s hose cart house, but was later moved to Livermore’s Fire Station 6, where it has been illuminated for more than a million hours.

Throughout its life the Centennial Bulb has seen just two interruptions: for a week in 1937 when the Firehouse was refurbished, and in May 2013 when it was off for nine and a half hours due to a failed power supply. Made by the Shelby Electric Company, the hand-blown bulb previously shone at 60 watts but has since been dimmed to 4 watts.

While this means it isn’t able to actually illuminate much, it is a reminder that despite the disposable nature of many modern electrical devices, it’s possible to build electrical items that last.

5 exciting energy innovations that you should know about in 2020

As we head into the 2020s, it’s an exciting time for energy. A deeper level of climate consciousness has led to crucial changes in populations’ attitudes and thinking around how we power our lives – adapting to a new set of energy standards has become essential.

It’s also driving innovation in energy technology, leading to the rise of a number of emerging technologies designed to support the global energy transition in new ways. From domestic solar and wind generation, to leaps forward in recycling and aeroplane fuel, here are five new energy ideas in the 2020s pipeline.

Miniature turbines for your garden

Think of a wind farm and you might think of giant structures located in remote, windswept areas, but that’s quickly changing.

IceWind is developing residential wind turbines that use the same generator-principal as large-scale wind farms, just on a much smaller scale. A set of three outer and three inner vertical blades rotate when the wind passes through them, providing spinning mechanical energy that passes through the generator and is converted to electricity.

Constructed from durable stainless steel, carbon fibre and aluminium, the CW1000 model can handle wind speeds of up to 134 miles per hour. To ensure they’re fit for domestic use, the units are adapted to have a maximum height of just over 3 metres and make less than 40 decibels of noise – roughly equivalent to quiet conversation.

The Icelandic company says it aims to decentralise and democratise energy generation by making wind power accessible to people anywhere in the world.

Expanding solar to cover more surfaces

As solar technology becomes more widespread and easier to implement, more communities are turning to a prosumer approach and generating their own power.

Roof panels to date have been the most common way to domestically capture and convert rays, but Solecco is taking it a step further, offering solar roof tiles. These work in the same way as roof panels, using photovoltaic cells made of silicon to convert sunlight into electricity. But by covering more surface area, entire roofs can be used to generate solar energy, rather than single panels.

Environmental Street Furniture takes it a step further by bringing small scale solar generation into many aspects of the urban environment such as smart benches, rubbish bins, and solar lighting in green spaces. This opens up opportunities for powering cities, including incorporating charging stations and network connectivity, which in turn enables social power sharing.

Re-purposing plastic 

Global recycling rates currently sit at approximately 18%, indicating there are still further steps to take in ensuring single-use products are eliminated.

Plastic is a major target in the war on disposal, and for good reason. By 2015, the world had produced over seven billion tonnes of plastic. Greenology is tackling this by harnessing a process called pyrolysis to turn plastic into power. By heating waste at a very high temperature without oxygen, the plastic is breaks down without combusting.

This process produces bio-oils, which can be used to create biofuels. The benefits of this innovative approach to waste are twofold: not only can plastic be repurposed, which minimises the lasting impact single-use plastic has on the planet, but the creation of biofuel offers a power source for everything from transport to generating electricity.

Storing heat for the home

Decarbonising heating is one of the global challenges yet to have a clear answer. Pumped Heat Ltd (PHL) is developing a potential solution with its heat battery technology. The company has found a solution that enables its devices to charge up and store electricity during ‘off-peak’ hours (when electricity is at its cheapest) and then use this energy to generate heating and hot water for homes as it is required. As the grid continues to decarbonise, and as renewable power becomes cheaper and more accessible, the electricity used to charge these units will approach zero carbon content.

The heat battery technology utilises vacuum insulation, losing 10 times less heat than a conventional night storage heater. In contrast, air sourced heat pumps (a more commonly used type of heat pump), operate in real time when a home needs heating. They take water at its delivery temperature (which can be very cold, during the winter months) and heat it using electricity available at that time. Pumped Heat’s storage system instead ensures there is always heat available, maintaining a consistent temperature for hot water or central heating, rather than just when there is an excess of electricity.

The company claims the benefit of using a heat battery system is that it is cheaper than an oil or LPG boiler, in a world where renewable electricity production, both domestic and on a national level, is only set to increase.

Waste-powered planes

As some of the most fossil fuel-reliant industries in the world, travel and transport are actively seeking alternative and more sustainable ways to keep them powered in long run.

Velocys aims to do this using waste. The company is developing sustainable fuels for aviation and heavy goods transport, using the Fischer-Tropsch method of gasifying waste. This involves turning waste materials – such as domestic refuse and woody waste – into clean jet fuel using a catalytic chemical reaction, where synthesis gases (carbon monoxide and hydrogen) are converted into liquid hydrocarbons that can then be used for fuel.

Not only does this make use of waste products that could have ended up in landfill, but it produces much cleaner fuels, that emit less particle matter and harmful pollutants into the atmosphere.

As we enter a new decade of invention, the world is focusing on more sustainable alternatives to power our lives, and these innovative solutions to current environmental issues will continue to inspire creativity.

Changing forest structure in Virginia and North Carolina

Photos: Roanoke Rapids area near the North Carolina, Virginia border, courtesy of Enviva.

Forest owners have responded to the recovery in pine saw-timber markets, since the global financial crisis of 2008, by planting more forest and investing more in the management of their land. The same period has witnessed increased demand from the biomass sector which has replaced declining need for wood from pulp and paper markets.

The area of timberland (actively managed productive forest) has increase by around 89,000 hectares (ha) since 2010. This change is due to three important factors: new planting on agricultural land; the planting of low-grade self-seeded areas with more productive improved pine; and the re-classification by the US Forest Service (USFS) of some areas of naturally regenerated pine from woodland to timberland.

The 2018 data shows that pine forest makes up 46% of the timberland area, of which 61% is planted and the remainder naturally regenerated. Hardwoods cover 43% of the timberland area, with 93% of this naturally regenerated. The remaining area is mixed stands.

Composition of timberland area

Since 2000 there have been some significant changes in the composition of the timberland area with a transition from hardwood to softwood. Pine has increased from 39% of the total area in 2000 to 46% in 2018 and hardwood has decreased from 50% to 43% over the same period.

All pine areas have increased since 2000 with naturally regenerated pine increasing by 13,000 ha and planted pine by 340,000 ha since 2000. Mixed stands have declined by 6,500 ha as some of these sites have been replanted with improved pine to increase growth and saw-timber production.

The biggest change has been in the hardwood areas where there has been a decline of around 314,000 ha, despite the total area of timberland increasing by 31,000 ha.

Change in forest type

This change has been driven by private forest owners (representing 91% of the total timberland area), seeking to gain a better return on investment from their forest land.

Hardwood markets have declined since the 2008 recession and demand for hardwood saw-timber has not recovered. Demand for pine saw-timber has rebounded and is now as strong as pre-crisis.

Pine also offers much faster growth rates and higher total volumes in a much shorter time frame (typically 25-35 years compared to 75-80 years for hardwoods).

The decision to change species is similar to a farmer changing their agricultural crops based on market demand and prices for each product. Where forests are managed for revenue generation then it is reasonable to optimise the land and crop for this objective. This can be a significant positive, from a carbon perspective more carbon is sequestered in a shorter time frame and more carbon is stored in long term wood products, if the quantity if saw-timber is increased.

Increased revenue generation also helps to maintain the forest area (rather than conversion to urban development, agriculture or other uses).

A potential negative is the change in habitat from a pure hardwood stand to a pure pine stand, each providing a different ecosystem and supporting a different range of flora and fauna. There is no conclusive evidence that one forest type is better or worse than the other; there is a great deal of variety of each type.

Some hardwood forests are rich in species and biodiversity, others can be unremarkable. The key is not to endanger or risk losing any species or sensitive habitat and to ensure that any conversion only occurs where there is no loss of biodiversity and no negative impact to the ecosystem.

It is not clear whether all of the lost hardwood stands have been directly converted to pine forests, some hardwood stands may have been lost to other land uses (urban and other land has increased by 400,000 ha). Some may have been directly converted to pine by forest owners encouraged by the increase in pine saw-timber demand and prices.

Whatever the primary driver of this change it is clearly not being driven by the biomass sector.

Change in forest type – timing

The chart above demonstrates that the biggest change, loss of hardwood and increase in planted pine, occurred between 2000 and 2012, prior to the operation of the pellet mills. Since 2012, there has been no significant loss of natural hardwood and only a small decline in planted hardwood.

Read the full report: Catchment Area Analysis of Forest Management and Market Trends: Enviva Pellets Ahoskie, Enviva Pellets Northampton, Enviva Pellets Southampton (UK metric version). Explore Enviva’s supply chain via Track & Trace. This is part of a series of catchment area analyses around the forest biomass pellet plants supplying Drax Power Station with renewable fuel. The series includes: Estonia, Morehouse Bioenergy, Amite Bioenergy, and the Drax forestry team’s review of the Chesapeake report on Enviva’s area of operations.

Chesapeake catchment area analysis

Photos: Roanoke Rapids area near the North Carolina, Virginia border, courtesy of Enviva.

Increased timberland, increased carbon stored in the forest, robust prices and new markets benefiting forest owners and forest workers, are among the findings of a report by Hood Consulting.

This fourth in a series of catchment area analyses for Drax looks at the area surrounding three pellet plants operated by Enviva: Ahoskie, Northampton and Southampton.

Enviva catchment area in Virginia and North Carolina

Forests and woodlands represent 68% of the total area at just over 5.4 million hectares (ha) with 87% of this area classified as timberland. The area of timberland (actively managed productive forest) has increased by around 89,000 ha since 2010 and there have been some significant changes in forest type.

The overall area of forest has increased and there is no evidence of deforestation occurring.

Land use by area

Since 2000, the total volume of standing timber in the catchment area has increased by 170 million cubic metres (m3). Sixty five percent of this increase has occurred since 2012, indicating a growing/maturing forest resource and an expanding forest area. Most of the increase in volume has been in the saw-timber categories for both pine and hardwood, although the hardwood pulpwood size class has also increased by nearly 10 million m3 since 2012 following a small decline between 2000 and 2012.

Timber inventory by product category

The increased demand from the three Enviva pellet mills, beginning operation in 2012 in the Chesapeake region, appears to have had no negative impact of the accumulation of forest carbon in the growing stock of the region. Since this time, all categories of timber product have increased.

Timber inventory by product category – pre and post-Enviva

This increase in inventory is also reflected in the comparison of average annual growth to removals. The surplus of un-cut growth has increased substantially since 2010 from 4.7 million m3 per year  to 15.9 million m3 p.a. Over this period annual growth has increased by 35.5% whereas removals have decreased by 8.6%.

Annual growth vs. removals and surplus volume

Demand for timber products has fluctuated since 2000. The global financial crisis in 2008-09 impacted all product categories, but particularly pine and hardwood saw-timber where there was a combined drop of over five million tonnes in 2010 compared to 2000. This was a loss of over 20% of total annual demand in the catchment area. Pine saw-timber has now recovered to pre-crisis levels, but hardwood demand has remained low. Hardwood pulpwood demand also declined around this time, with the closure and decline of existing pulp mills in the catchment area. Demand had fallen by one million tonnes p.a. by 2011 prior to the Enviva pellet mills opening. From 2012 the new biomass demand enabled the hardwood pulpwood market to recover to pre-crisis levels with demand in 2018 at almost exactly the same level as in 2000.

Annual demand by product category

This fluctuation in demand is reflected in the average annual stumpage price data shown on the chart below, this is the value that the forest owner gets for each product. The trends are generally as expected, with the exception of the hardwood saw-timber price, which has increased substantially despite a decrease in demand. This is due to supply chain issues, reduced capacity of loggers and access to land.

Average annual stumpage prices

Detailed below is an edited version of the consultant’s review and analysis of key issues in the catchment area.

The full version can be found in the main report.

Is there any evidence that bioenergy demand has caused the following?

Deforestation

No. US Forest Service (USFS) data shows the opposite. The total area of timberland in the Enviva Chesapeake catchment area has increased an estimated 82,818 hectares (+1.8%) since Enviva Pellets Ahoskie commenced full production in 2012.

A change in management practices (rotation lengths, thinnings, conversion from hardwood to pine)?

No / Inconclusive. Changes in management practices have occurred in the catchment area since 2012, but there is little evidence to suggest that bioenergy demand has caused these changes. Conversion of hardwood and mixed pine-hardwood timberland to planted pine timberland has occurred in the catchment area.

Diversion from other markets

No / Inconclusive. Since 2012, pulpwood demand not attributed to bioenergy has decreased 19%; however, this decrease is largely attributed to decreased demand from the pulp/paper sector. Also, demand for softwood and hardwood sawlogs have increased an estimated 14% and 7%, respectively, since 2012.

An unexpected increase in wood prices

No / Inconclusive. The increase in hardwood biomass demand coincided with price increases of 10-24% for delivered hardwood pulpwood. These price increases were likely linked to a combination of both supply chain issues (shortage of local loggers following pulp/paper mill closures in the region) and elevated prices offered by Enviva to ensure guaranteed wood supply for the first several years of operation, as prices for delivered hardwood pulpwood and hardwood chips proceeded to decline 16% and 9%, respectively, from 2014 to2017 once the market stabilised.

Since 2014, prices for pine products have held flat even though softwood raw material purchases (demand) by Enviva have more than doubled. In this catchment area, changes in pine pulpwood and pine chip prices are largely driven by demand attributed to the pulp/paper sector.

A reduction in growing stock timber

No. Total growing stock inventory in the catchment area increased 19% from 2012 through 2018. Over this period, inventories increased as follows for each of the five major timber products: +33% for pine sawtimber, +23% for pine chip-n-saw, +14% for pine pulpwood, +12% for hardwood sawtimber, and +14% for hardwood pulpwood.

The increase in timber inventory can be linked to a combination of increased forest area (additional hectares = additional inventory) and annual harvest levels below the sustainable yield capacity of the catchment area forest (i.e. annual growth has continued to exceed annual removals, resulting in increased inventory levels).

A reduction in the sequestration rate of carbon

No. US Forest Service data shows the average annual growth rate of growing stock timber has increased slightly since 2012. Increased timber growth rates/carbon sequestration rates can be linked to a combination of changes in species composition and silvicultural practices.

Softwood (pine) grows at a much quicker rate compared to hardwood species, and in the Enviva Chesapeake catchment area, pine timberland area increased from 43.6% of total timberland area in 2011 to 46.0% in 2018. Also, improvements in silviculture have continued to enhance growth and overall productivity. Together, these factors help explain how average per hectare volume growth increased from 5.9 m3 in 2011 to 7.7 m3 in 2018.

An increase in harvesting above the sustainable yield capacity of the forest area

No. In 2018, the latest available, growth-to-removals ratio for pine and hardwood pulpwood, the timber products utilised by bioenergy, equalled 2.49 and 2.76, respectively (a value greater than 1.0 indicates sustainable harvest levels). Even with the increased harvesting required to satisfy bioenergy demand, harvest levels remain well below the sustainable yield capacity of the catchment forest area.

What has been the impact of bioenergy demand on?

Timber growing stock inventory

Neutral. Total wood demand increased an estimated 14% from 2012-2018, and much of that increase can be attributed to increased demand from bioenergy. In this catchment area, inventories are so substantial that increases in demand from bioenergy, as well as from other sources, have not been great enough to offset annual timber growth. Total growing stock inventory has continued to increase – an average of 2.9% per year since Enviva first entered this market in 2012.

Timber growth rates

Neutral. Timber growth rates have increased for pine sawtimber, pine chip-n-saw, pine pulpwood, and hardwood pulpwood since 2012; hardwood sawtimber growth rates have declined slightly. Evidence suggests these overall increases in growth rates are linked to changes in age class distribution (i.e. a younger forest), not due to changes in bioenergy demand

Forest area

Positive / Neutral. Total forest (timberland) area in the catchment area increased nearly 83,000 hectares (+1.8%) from 2012 through 2018, the latest available. Our analysis of biomass demand and forest area found a strong positive correlation between these two variables but also a moderately strong correlation between softwood sawlog demand and forest area.

Wood prices

Neutral / Negative. The additional wood demand placed on this market by Enviva from 2012-2014 coincided with a 19% increase in delivered pine pulpwood price and a 24% increase in delivered hardwood pulpwood price. Pine and hardwood chip prices also increased 10-11% over this period. Analysis found evidence that increases in hardwood pulpwood and hardwood chip prices can be linked to increases in total hardwood pulpwood demand. However, given that hardwood bioenergy demand has accounted for over 75% of total hardwood pulpwood demand in the catchment area since 2014, it is reasonable to conclude that hardwood pulpwood demand attributed to bioenergy has had some level of impact on delivered hardwood pulpwood and hardwood chip prices.

Markets for solid wood products

Positive. In the Enviva Chesapeake catchment area, demand for softwood and hardwood sawlogs used to produce lumber and other solid wood products increased 15% and 9%, respectively, from 2012-2018. A by-product of the sawmilling process are sawmill residuals – a material utilied by Enviva’s three mills to produce wood pellets. With the increased production of both softwood and hardwood lumber, so too has come an increase in sawmill residuals, some of which has been purchased/consumed by Enviva.

Not only has Enviva benefited from the greater availability of this by-product, but lumber producers have also benefited, as Enviva’s three mills have provided an additional outlet for these producers and their by-products.

Forest landowners

Positive. Increased demand attributed to bioenergy has been a positive for forest landowners in the Chesapeake catchment area. Not only has bioenergy provided an additional outlet for pulpwood (particularly hardwood pulpwood), but the increase in pulpwood prices as a result of an overall increase in both softwood and hardwood pulpwood demand has transferred through to landowners (improved compensation).

Specifically, since 2013 (the first year all three Enviva pellet mills were operating), hardwood pulpwood stumpage price – the price paid to landowners – has averaged roughly $5.60 per ton in the Chesapeake catchment area. This represents a 47% increase over the approximately $3.80 per ton averaged by hardwood pulpwood stumpage in the catchment area over the 10 years prior (2003-2012). Similarly, pine pulpwood stumpage price has averaged $12.95 per ton in the catchment area since 2013, up 67% from the 2003-2012 average of $7.75 per ton.

Read the full report: Catchment Area Analysis of Forest Management and Market Trends: Enviva Pellets Ahoskie, Enviva Pellets Northampton, Enviva Pellets Southampton (UK metric version). Read the Drax forestry team’s blog ‘Changing forest structure in Virginia and North Carolina. Explore Enviva’s supply chain via Track & Trace. This is part of a series of catchment area analyses around the forest biomass pellet plants supplying Drax Power Station with renewable fuel. Others in the series include: Georgia Mill, Estonia, Latvia, Morehouse Bioenergy and Amite Bioenergy.

14 moments that electrified history

Electricity is such a universal and accepted part of our lives it’s become something we take for granted. Rarely do we stop to consider the path it took to become ubiquitous, and yet through the course of its history there have been several eureka moments and breakthrough inventions that have shaped our modern lives. Here are some of the defining moments in the development of electricity and power.

2750 BC – Electricity first recorded in the form of electric fish

Ancient Egyptians referred to electric catfish as the ‘thunderers of the Nile’, and were fascinated by these creatures. It led to a near millennia of wonder and intrigue, including conducting and documenting crude experiments, such as touching the fish with an iron rod to cause electric shocks.

500 BC – The discovery of static electricity

Around 500 BC Thales of Miletus discovered that static electricity could be made by rubbing lightweight objects such as fur or feathers on amber. This static effect remained unknown for almost 2,000 years until around 1600 AD, when William Gilbert discovered static electricity in earnest.

1600 AD – The origins of the word ‘electricity’

The Latin word ‘electricus’, which translates to ‘of amber’ was used by the English physician, William Gilbert to describe the force exerted when items are rubbed together. A few years later, English scientist Thomas Browne translated this into ‘electricity’ in his written investigations in the field.

1751 – Benjamin Franklin’s ‘Experiments and Observations on Electricity’

This book of Benjamin Franklin’s discoveries made about the behaviour of electricity was published in 1751. The publication and translation of American founding father, scientist and inventor’s letters would provide the basis for all further electricity experimentation. It also introduced a host of new terms to the field including positive, negative, charge, battery and electric shock.

1765 – James Watt transforms the Industrial Revolution

Watt studies Newcomen’s engine

James Watt transformed the Industrial Revolution with the invention of a modified Newcome engine, now known as the Watt steam engine. Machines no longer had to rely on the sometimes-temperamental wind, water or manpower – instead steam from boiling water could drive the pistons back and forth. Although Watt’s engine didn’t generate electricity, it created a foundation that would eventually lead to the steam turbine – still the basis of much of the globe’s electricity generation today.

James Watt’s steam engine

Alessandro Volta

1800 – Volta’s first true battery

Documented records of battery-like objects date back to 250 BC, but the first true battery was invented by Italian scientist Alessandro Volta in 1800. Volta realised that a current was created when zinc and silver were immersed in an electrolyte – the principal on which chemical batteries are still based today.

1800s – The first electrical cars

Breakthroughs in electric motors and batteries in the early 1800s led to experimentation with electrically powered vehicles. The British inventor Robert Anderson is often credited with developing the first crude electric carriage at the beginning of the 19th century, but it would not be until 1890 that American chemist William Morrison would invent the first practical electric car (though it closer resembled a motorised wagon), boasting a top speed of 14 miles per hour.

Michael Faraday

1831 – Michael Faraday’s electric dynamo

Faraday’s invention of the electric dynamo power generator set the precedent for electricity generation for centuries to come. His invention converted motive (or mechanical) power – such as steam, gas, water and wind turbines – into electromagnetic power at a low voltage. Although rudimentary, it was a breakthrough in generating consistent, continuous electricity, and opened the door for the likes of Thomas Edison and Joseph Swan, whose subsequent discoveries would make large-scale electricity generation feasible.

1879 – Lighting becomes practical and inexpensive

Thomas Edison patented the first practical and accessible incandescent light bulb, using a carbonised bamboo filament which could burn for more than 1,200 hours. Edison made the first public demonstration of his incandescent lightbulb on 31st December 1879 where he stated that, “electricity would be so cheap that only the rich would burn candles.” Although he was not the only inventor to experiment with incandescent light, his was the most enduring and practical. He would soon go on to develop not only the bulb, but an entire electrical lighting system.

Holborn Viaduct power station via Wikimedia

1882 – The world’s first public power station opens

Holborn Viaduct power station, also known as the Edison Electric Light Station, burnt coal to drive a steam turbine and generate electricity. The power was used for Holborn’s newly electrified streetlighting, an idea which would quickly spread around London.

1880s – Tesla and Edison’s current war

Nikola Tesla and Thomas Edison waged what came to be known as the current war in 1880s America. Tesla was determined to prove that alternating current (AC) – as is generated at power stations – was safe for domestic use, going against the Edison Group’s opinion that a direct current (DC) – as delivered from a battery – was safer and more reliable.

Inside an Edison power station in New York

The conflict led to years of risky demonstrations and experiments, including one where Tesla electrocuted himself in front of an audience to prove he would not be harmed. The war continued as they fought over the future of electric power generation until eventually AC won.

Nikola Tesla

1901 – Great Britain’s first industrial power station opens

Before Charles Mertz and William McLellan of Merz & McLellan built the Neptune Bank Power Station in Tyneside in 1901, individual factories were powered by private generators. By contrast, the Neptune Bank Power Station could supply reliable, cheap power to multiple factories that were connected through high-voltage transmission lines. This was the beginning of Britain’s national grid system.

1990s – The first mass market electrical vehicle (EV)

Concepts for electric cars had been around for a century, however, the General Motors EV1 was the first model to be mass produced by a major car brand – made possible with the breakthrough invention of the rechargeable battery. However, this EV1 model could not be purchased, only directly leased on a monthly contract. Because of this, its expensive build, and relatively small customer following, the model only lasted six years before General Motors crushed the majority of their cars.

2018 – Renewable generation accounts for a third of global power capacity

The International Renewable Energy Agency’s (IRENA) 2018 annual statistics revealed that renewable energy accounted for a third of global power capacity in 2018. Globally, total renewable electricity generation capacity reached 2,351 GW at the end of 2018, with hydropower accounting for almost half of that total, while wind and solar energy accounted for most of the remainder.

The UK needs negative emissions from BECCS to reach net zero – here’s why

Early morning sunrise at Drax Power Station

Reaching the UK’s target of net zero greenhouse gas emissions by 2050 means every aspect of the economy, from shops to super computers, must reduce its carbon footprint – all the way down their supply chains – as close to zero as possible.

But as the country transforms, one thing is certain: demand for electricity will remain. In fact, with increased electrification of heating and transport, there will be a greater demand for power from renewable, carbon dioxide (CO2)-free sources. Bioenergy is one way of providing this power without reliance on the weather and can offer essential grid-stability services, as provided by Drax Power Station in North Yorkshire.

Close up of electricity pylon tower

Close up of electricity pylon tower

Beyond just power generation, more and more reports highlight the important role the next evolution of bioenergy has to play in a net zero UK. And that is bioenergy with carbon capture and storage or BECCS.

A carbon negative source of power, abating emissions from other industries

The Committee on Climate Change (CCC) says negative emissions are essential for the UK to offset difficult-to-decarbonise sectors of the economy and meet its net zero target. This may include direct air capture (DAC) and other negative emissions technologies, as well as BECCS.

BECCS power generation uses biomass grown in sustainably managed forests as fuel to generate electricity. As these forests absorb CO2 from the atmosphere while growing, they offset the amount of COreleased by the fuel when used, making the whole power production process carbon neutral. Adding carbon capture and storage to this process results in removing more CO2 from the atmosphere than is emitted, making it carbon negative.

Pine trees grown for planting in the forests of the US South where more carbon is stored and more wood inventory is grown each year than fibre is extracted for wood products such as biomass pellets

Pine trees grown for planting in the forests of the US South where more carbon is stored and more wood inventory is grown each year than fibre is extracted for wood products such as biomass pellets

This means BECCS can be used to abate, or offset, emissions from other parts of the economy that might remain even as it decarbonises. A report by The Energy Systems Catapult, modelling different approaches for the UK to reach net zero by or before 2050, suggests carbon-intensive industries such as aviation and agriculture will always produce residual emissions.

The need to counteract the remaining emissions of industries such as these make negative emissions an essential part of reaching net zero. While the report suggests that direct air carbon capture and storage (DACCS) will also play an important role in bringing CO2 levels down, it will take time for the technology to be developed and deployed at the scale needed.

Meanwhile, carbon capture use and storage (CCUS) technology is already deployed at scale in Norway, the US, Australia and Canada. These processes for capturing and storing carbon are applicable to biomass power generation, such as at Drax Power Station, which means BECCS is ready to deploy at scale from a technology perspective today.

As well as counteracting remaining emissions, however, BECCS can also help to decarbonise other industries by enabling the growth of a different low carbon fuel: hydrogen.

Enabling a hydrogen economy

The CCC’s ‘Hydrogen in a low-carbon economy report’ highlights the needs for carbon zero alternatives to fossil fuels – in particular, hydrogen or H2.

Hydrogen produced in a test tube

Hydrogen produced in a test tube

When combusted, hydrogen only produces heat and water vapour, while the ability to store it for long periods makes it a cleaner replacement to the natural gas used in heating today. Hydrogen can also be stored as a liquid, which, coupled with its high energy density makes it a carbon zero alternative to petrol and diesel in heavy transport.

There are various ways BECCS can assist the creation of a hydrogen economy. Most promising is the use of biomass to produce hydrogen through a method known as gasification. In this process solid organic material is heated to more than 700°C but prevented from combusting. This causes the material to break down into gases: hydrogen and carbon monoxide (CO). The CO then reacts with water to form CO2 and more H2.

While CO2 is also produced as part of the process, biomass material absorbs CO2 while it grows, making the overall process carbon neutral. However, by deploying carbon capture here, the hydrogen production can also be made carbon negative.

BECCS can more indirectly become an enabler of hydrogen production. The Zero Carbon Humber partnership envisages Drax Power Station as the anchor project for CCUS infrastructure in the region, allowing for the production of ‘blue’ hydrogen. Blue hydrogen is produced using natural gas, a fossil fuel. However, the resulting carbon emissions could be captured. The CO2 would then be transported and stored using the same system of pipelines and a natural aquifer under the North Sea as used by BECCS facilities at Drax.

This way of clustering BECCS power and hydrogen production would also allow other industries such as manufactures, steel mills and refineries, to decarbonise.

Lowering the cost of flexible electricity

One of the challenges in transforming the energy system and wider economy to net zero is accounting for the cost of the transition.

The Energy Systems Catapult’s analysis found that it could be kept as low as 1-2% of GDP, while a report by the National Infrastructure Commission (NIC) projects that deploying BECCS would have little impact on the total cost of the power system if deployed for its negative emissions potential.

The NIC’s modelling found, when taking into consideration the costs and generation capacity of different sources, BECCS would likely be run as a baseload source of power in a net zero future. This would maximise its negative emissions potential.

This means BECCS units would run frequently and for long periods, uninterrupted by changes in the weather, rather than jumping into action to account for peaks in demand. This, coupled with its ability to abate emissions, means BECCS – alongside intermittent renewables such as wind and solar – could provide the UK with zero carbon electricity at a significantly lower cost than that of constructing a new fleet of nuclear power stations.

The report also goes on to say that a fleet of hydrogen-fuelled power stations could also be used to generate flexible back-up electricity, which therefore could be substantially cheaper than relying on a fleet of new baseload nuclear plants.

However, for this to work effectively, decisions need to be made sooner rather than later as to what approach the UK takes to shape the energy system before 2050.

The time to act is now

What is consistent across many different reports is that BECCS will be essential for any version of the future where the UK reaches net zero by 2050. But, it will not happen organically.

Sunset and evening clouds over the River Humber near Sunk Island, East Riding of Yorkshire

Sunset and evening clouds over the River Humber near Sunk Island, East Riding of Yorkshire

A joint Royal Society and Royal Academy of Engineering Greenhouse Gas Removal report, includes research into BECCS, DACCS and other forms of negative emissions in its list of key actions for the UK to reach net zero. It also calls for the UK to capitalise on its access to natural aquifers and former oil and gas wells for CO2 storage in locations such as the North Sea, as well as its engineering expertise, to establish the infrastructure needed for CO2 transport and storage.

However, this will require policies and funding structures that make it economical. A report by Vivid Economics for the Department for Business, Energy and Industrial Strategy (BEIS) highlights that – just as incentives have made wind and solar viable and integral parts of the UK’s energy mix – BECCS and other technologies, need the same clear, long-term strategy to enable companies to make secure investments and innovate.

However, for policies to make the impact needed to ramp BECCS up to the levels necessary to bring the UK to net zero, action is needed now. The report outlines policies that could be implemented immediately, such as contracts for difference, or negative emissions obligations for residual emitters. For BECCS deployment to expand significantly in the 2030s, a suitable policy framework will need to be put in place in the 2020s.

Beyond just decarbonising the UK, a report by the Intergovernmental Panel on Climate Change (IPCC) highlights that BECCS could be of even more importance globally. Differing scales of BECCS deployment are illustrated in its scenarios where global warming is kept to within 1.5oC levels of pre-industrial levels, as per the Paris Climate agreement.

BECCS has the potential to play a vital role in power generation, creating a hydrogen economy and offsetting other emissions. As it continues to progress, it is becoming increasingly effective and cost efficient, offering a key component of a net zero UK.

Learn more about carbon capture, usage and storage in our series: