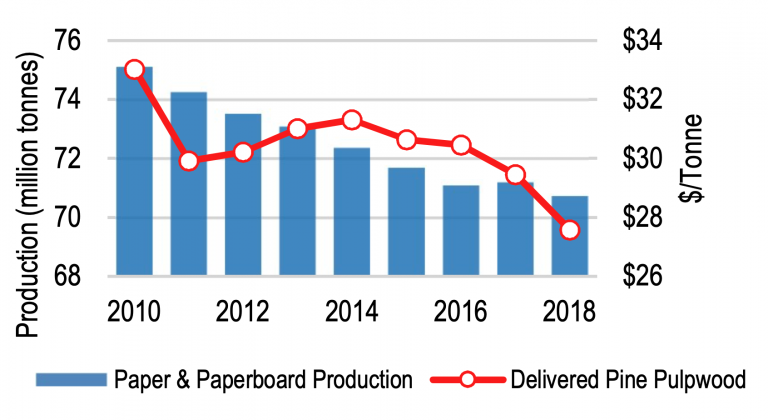


The Tate Modern and Battersea Power Station along the banks of the Thames are architectural icons of the London skyline. But before they were landmarks, they were oil- and coal-burning power stations, right in the heart of the city they powered.
As the city developed, the technology used to generate power advanced, and the need for cleaner fuel sources grew, the requirement for large, city-based fossil fuel power stations like these fell. The closure of Battersea and the Bankside power stations became inevitable.
Rather than knocking them down, however, it was clear their scale, heritage and location could be repurposed to meet an entirely new set of needs for the city. Now, as an art gallery and modern, mixed-use neighbourhood space, they remain in service to the city while retaining part of their heritage.
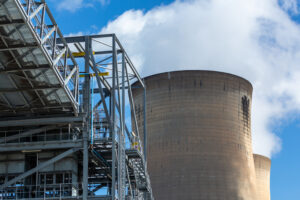
Eindhoven’s Innovation Powerhouse, Netherlands. Photo: Tycho Merijn.
The reimagining of disused power stations is not just a London phenomenon. It is one seen around the world, where industrial buildings like these are being transformed for a range of purposes.
Eindhoven’s Innovation Powerhouse
Eindhoven’s Innovation Powerhouse in the Netherlands remains distinguishable as a power station due to its enormous coal chimneys, but today it serves a different purpose. The original skeleton of the building has been repurposed as a creative office space for innovative tech companies. The open plan structure encourages collaboration and creativity and its location right in the city centre makes it easily accessible to employees. In a nod to its previous use, however, a biogas plant remains situated next door, burning wood waste to produce renewable electricity and heat for the building.
Beloit’s cultural ‘Powerhouse’
Like Innovation Powerhouse, the exterior of Blackhawk Generating Station in Beloit, Wisconsin remains clearly identifiable as a power station. A century ago the once gas-fired plant supplied peak-time electricity to surrounding cities, but since being bought by Beloit University, it’s being transformed into ‘The Powerhouse’– a leisure and cultural centre for both students and the general public. Designs include an auditorium, a health and wellness hub, a swimming pool, lecture halls and more. It sits along the Rock River, between the university and the city – a prime location for bringing communities together, and is due to open in January 2020.
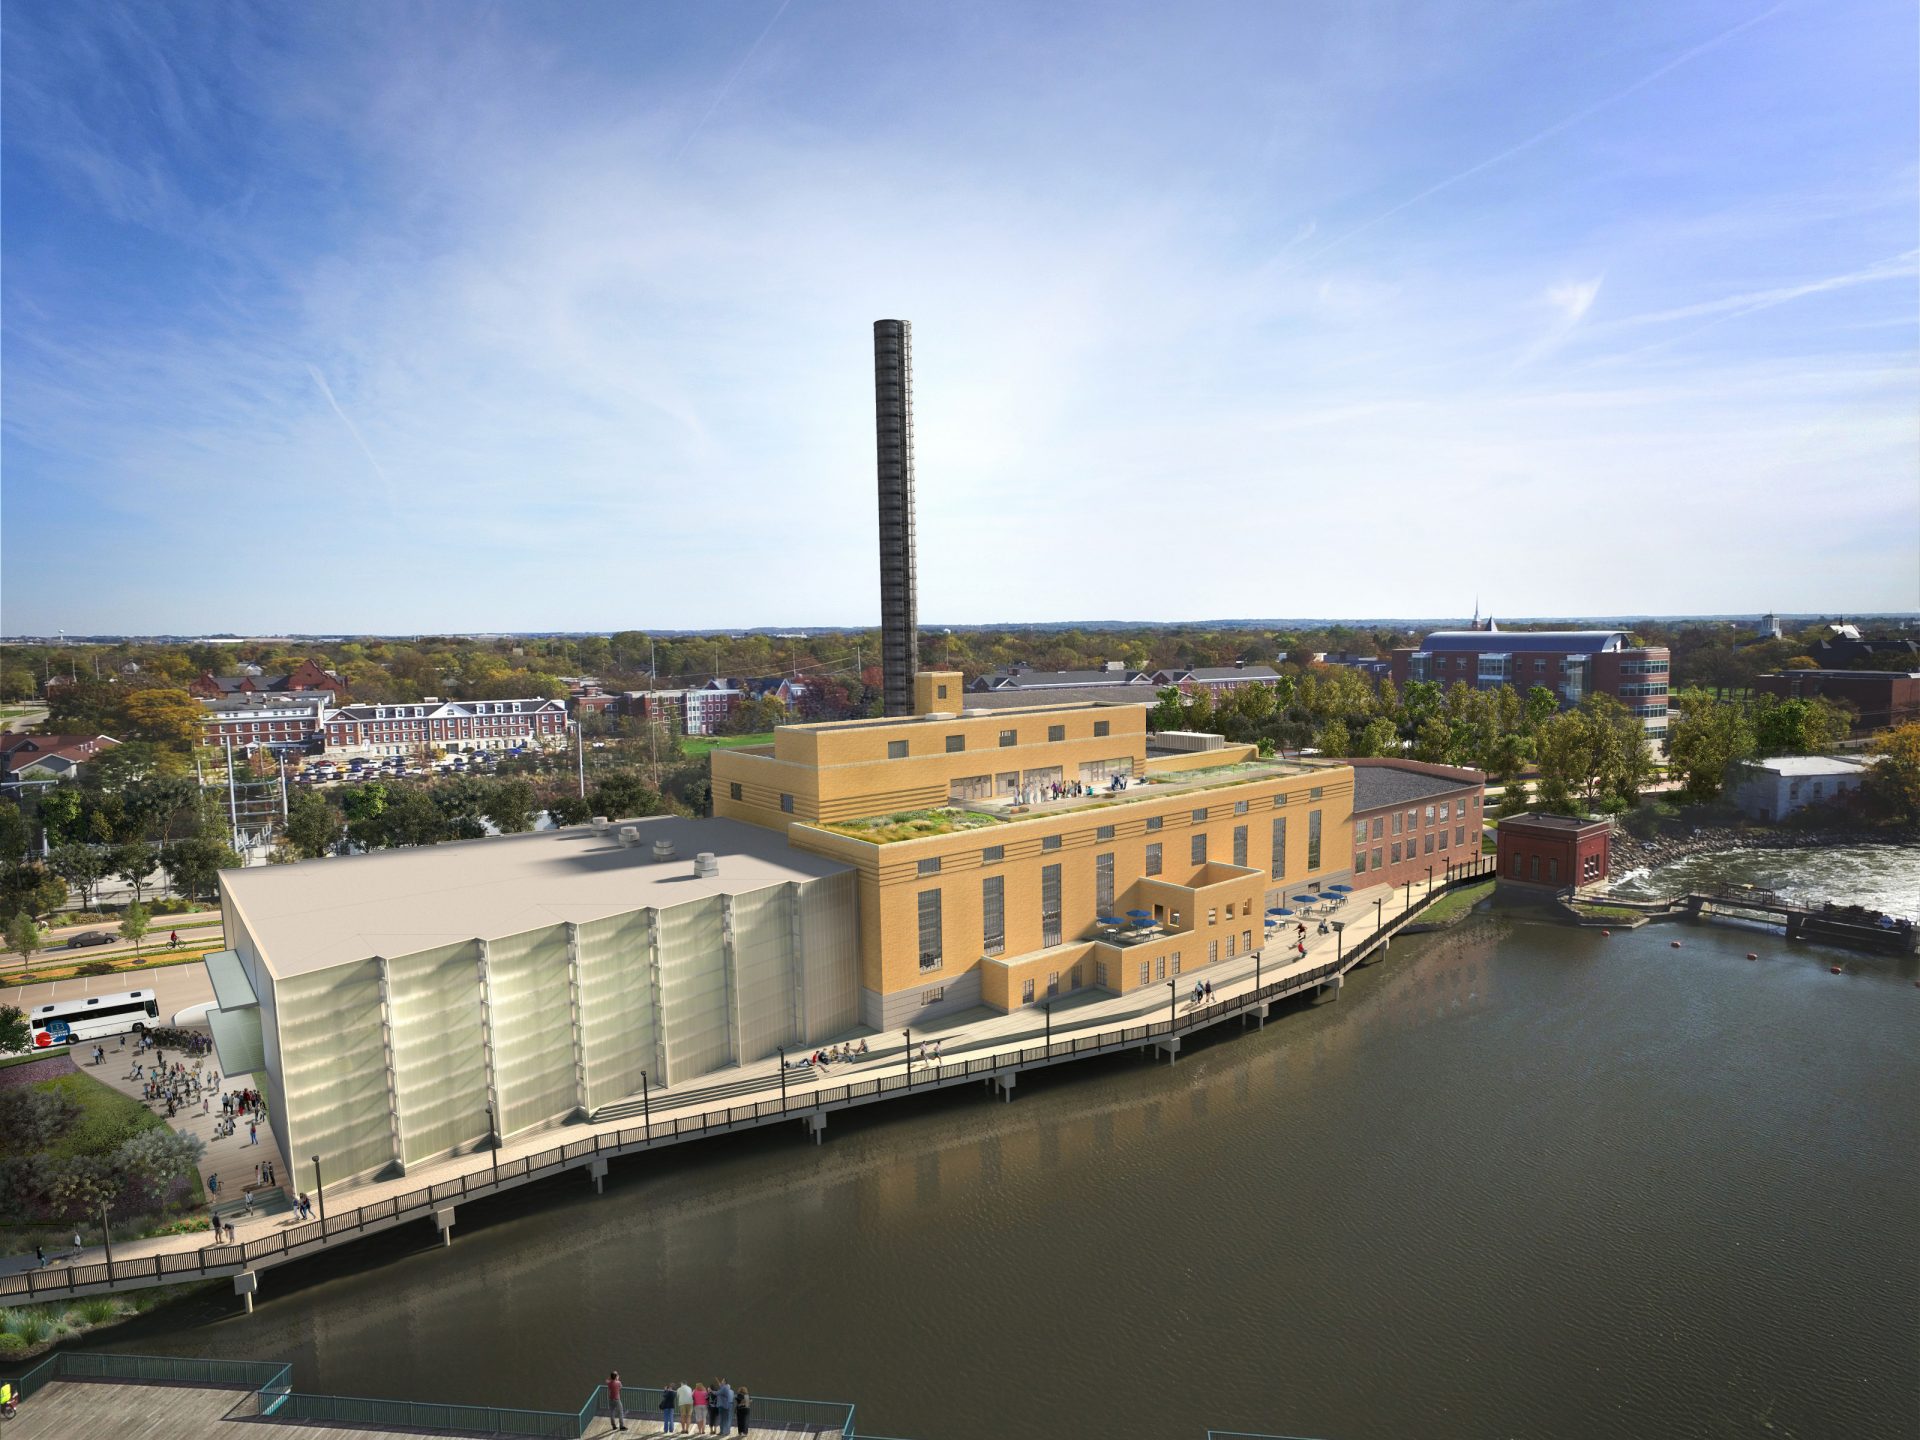
An artist’s impression of The Powerhouse, Beloit College Wisconsin. Photo: Studio Gang Architects.
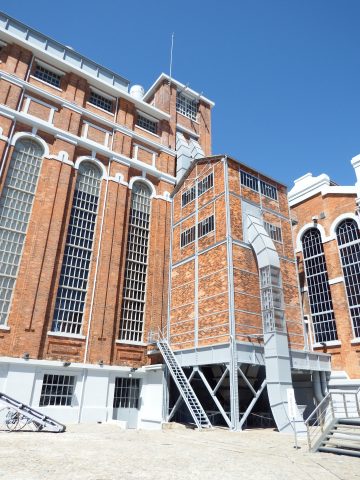
The Tejo Power Station Electricity Museum, Lisbon, Portugal.
Lisbon’s electricity museum
The Tejo Power Station once supplied electricity to the whole of Lisbon. Today it’s a museum and art gallery, but remains a testament to Portugal’s technological, historical and industrial heritage. It pays homage to the evolution of electricity through a permanent collection that includes original machinery from its construction in 1908, and charts its evolution from baseload electricity generator to standby power station used only to complement the country’s prominent supply of hydro plants. It’s a space that celebrates the heritage of the building, an attitude reflected throughout Portugal – there is even an energy museums roadmap created for people to tour a trail of decommissioned power stations.
Rome’s renaissance power station
Centrale Montemartini Thermoelectric plant was Rome’s first public power station, operating between 1912-1963. Decommissioned in the 1960s, it was adapted to temporarily house an exhibition of renaissance sculptures and archaeological finds from Rome’s Capitoline Museums that were at the time undergoing renovation. The clash of the classical artworks and the power station’s original equipment was such a success that it has been open ever since.
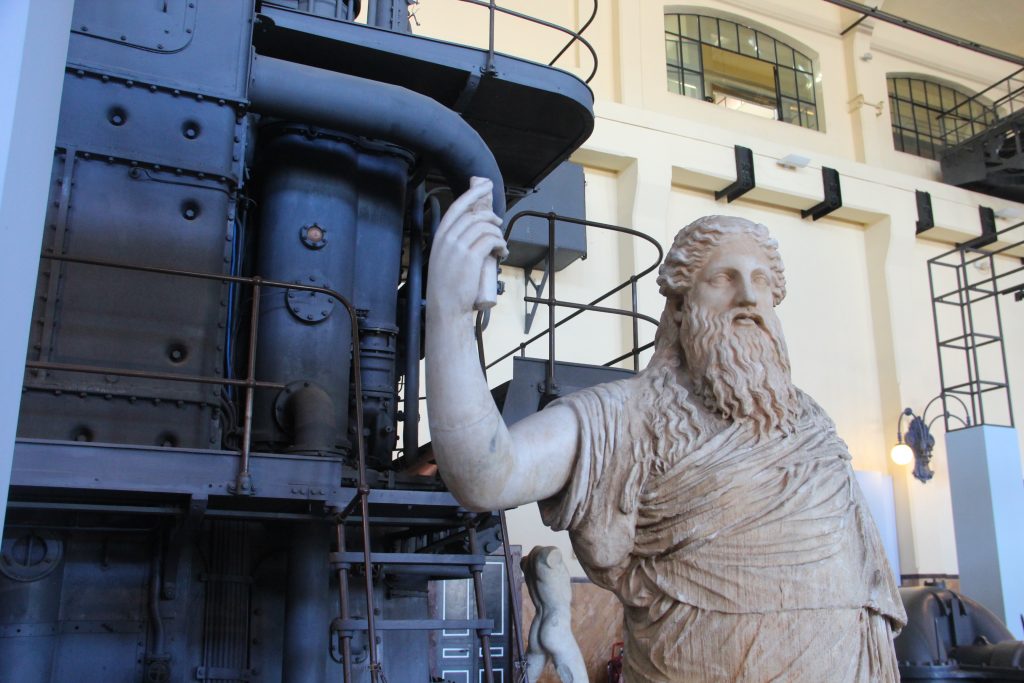
Centrale Montemartini, Rome, Italy.
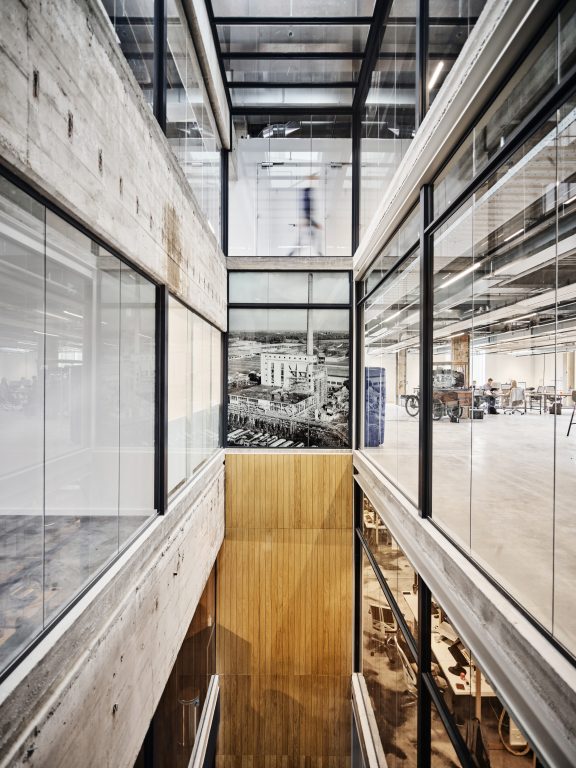
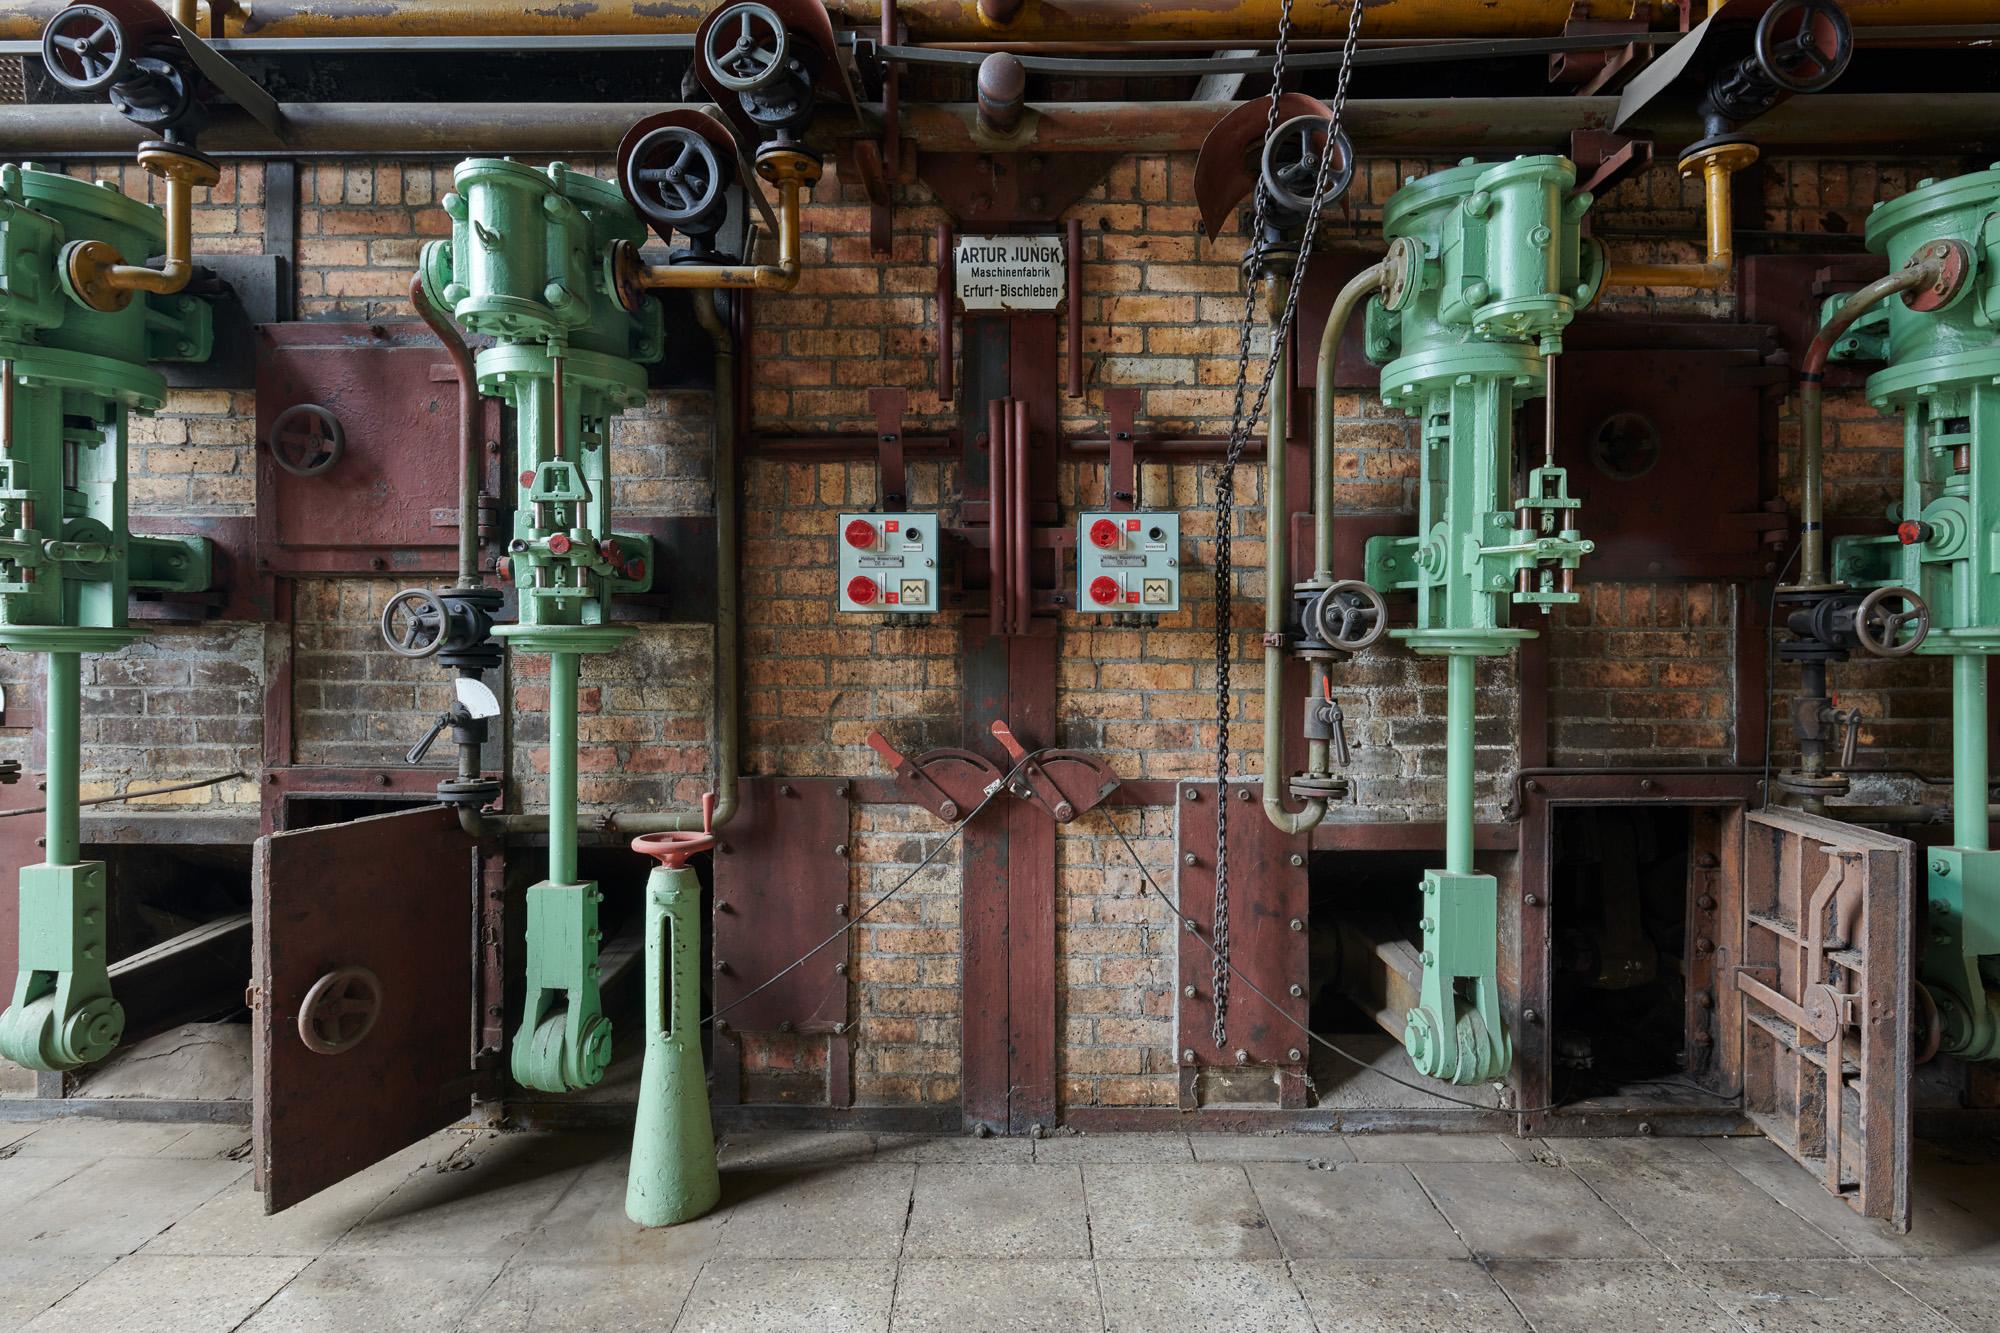
Berlin’s E-WERK Luckenwalde
Why replace a power station with an art gallery if it could in fact be both? Berlin’s E-WERK Luckenwalde is a hybrid – what was once a coal power plant before the collapse of communism in 1989, is now both a renewable power plant and an art gallery. It uses waste woodchips from neighbouring companies to generate and sell power to the grid to fund the cost of a contemporary art centre housed inside it. It still generates electricity, only this time it’s renewable and powers the art gallery, which in turn energises the artistic community of Berlin.
-
- Turbine Hall, E-WERK Luckenwalde. Photos: Ben Westoby. Click to view/download.

Copenhagen’s futuristic Amager Bakke Waste-to-Energy-Plant
Copenhagen’s Amager Bakke Waste-to-Energy-Plant is one of the cleanest incineration plants in the world. Opened in 2017 to replace a nearby 45-year-old incineration plant, it burns municipal waste to create heat and power for the surrounding area. What really sets it apart, however, is its artificial ski slope cascading down one side of the building, which has been open to the public all year-round since October 2019. This purposefully bold design sets out to change people’s perceptions of what power stations can do.
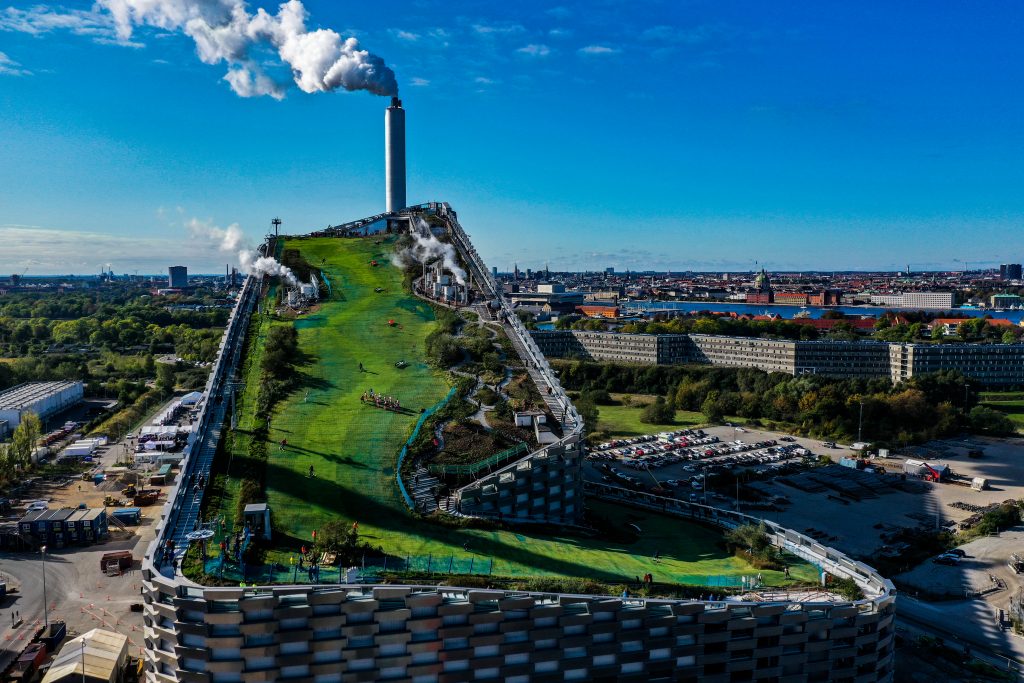
CopenHill ski slope, Amager Bakke, Copenhagen, Denmark. Photos: Max Mestour.
The decommissioning of power stations has resulted in cities’ acquiring buildings in prime central locations for the public to enjoy. These examples demonstrate the world’s transition to renewable power, the advances of technology, and populations’ increasing awareness of the environmental impact of their energy usage.
Top image: Entrance of E-WERK Luckenwalde, 2019. Photo: Ben Westoby. Click here to view/download.