International Paper’s pulp and paper mill, located in the Morehouse parish of Louisiana, had been in operation since 1927 and was once the largest employer in the area. However, as a result of the global recession of 2008, the company was forced to lay off over 550 employees and shut the facility. Other mills in the area have also reduced production including Georgia Pacific which let go around 530 people at its Crossett, Arkansas plant 18 miles to the north of Morehouse in 2019.
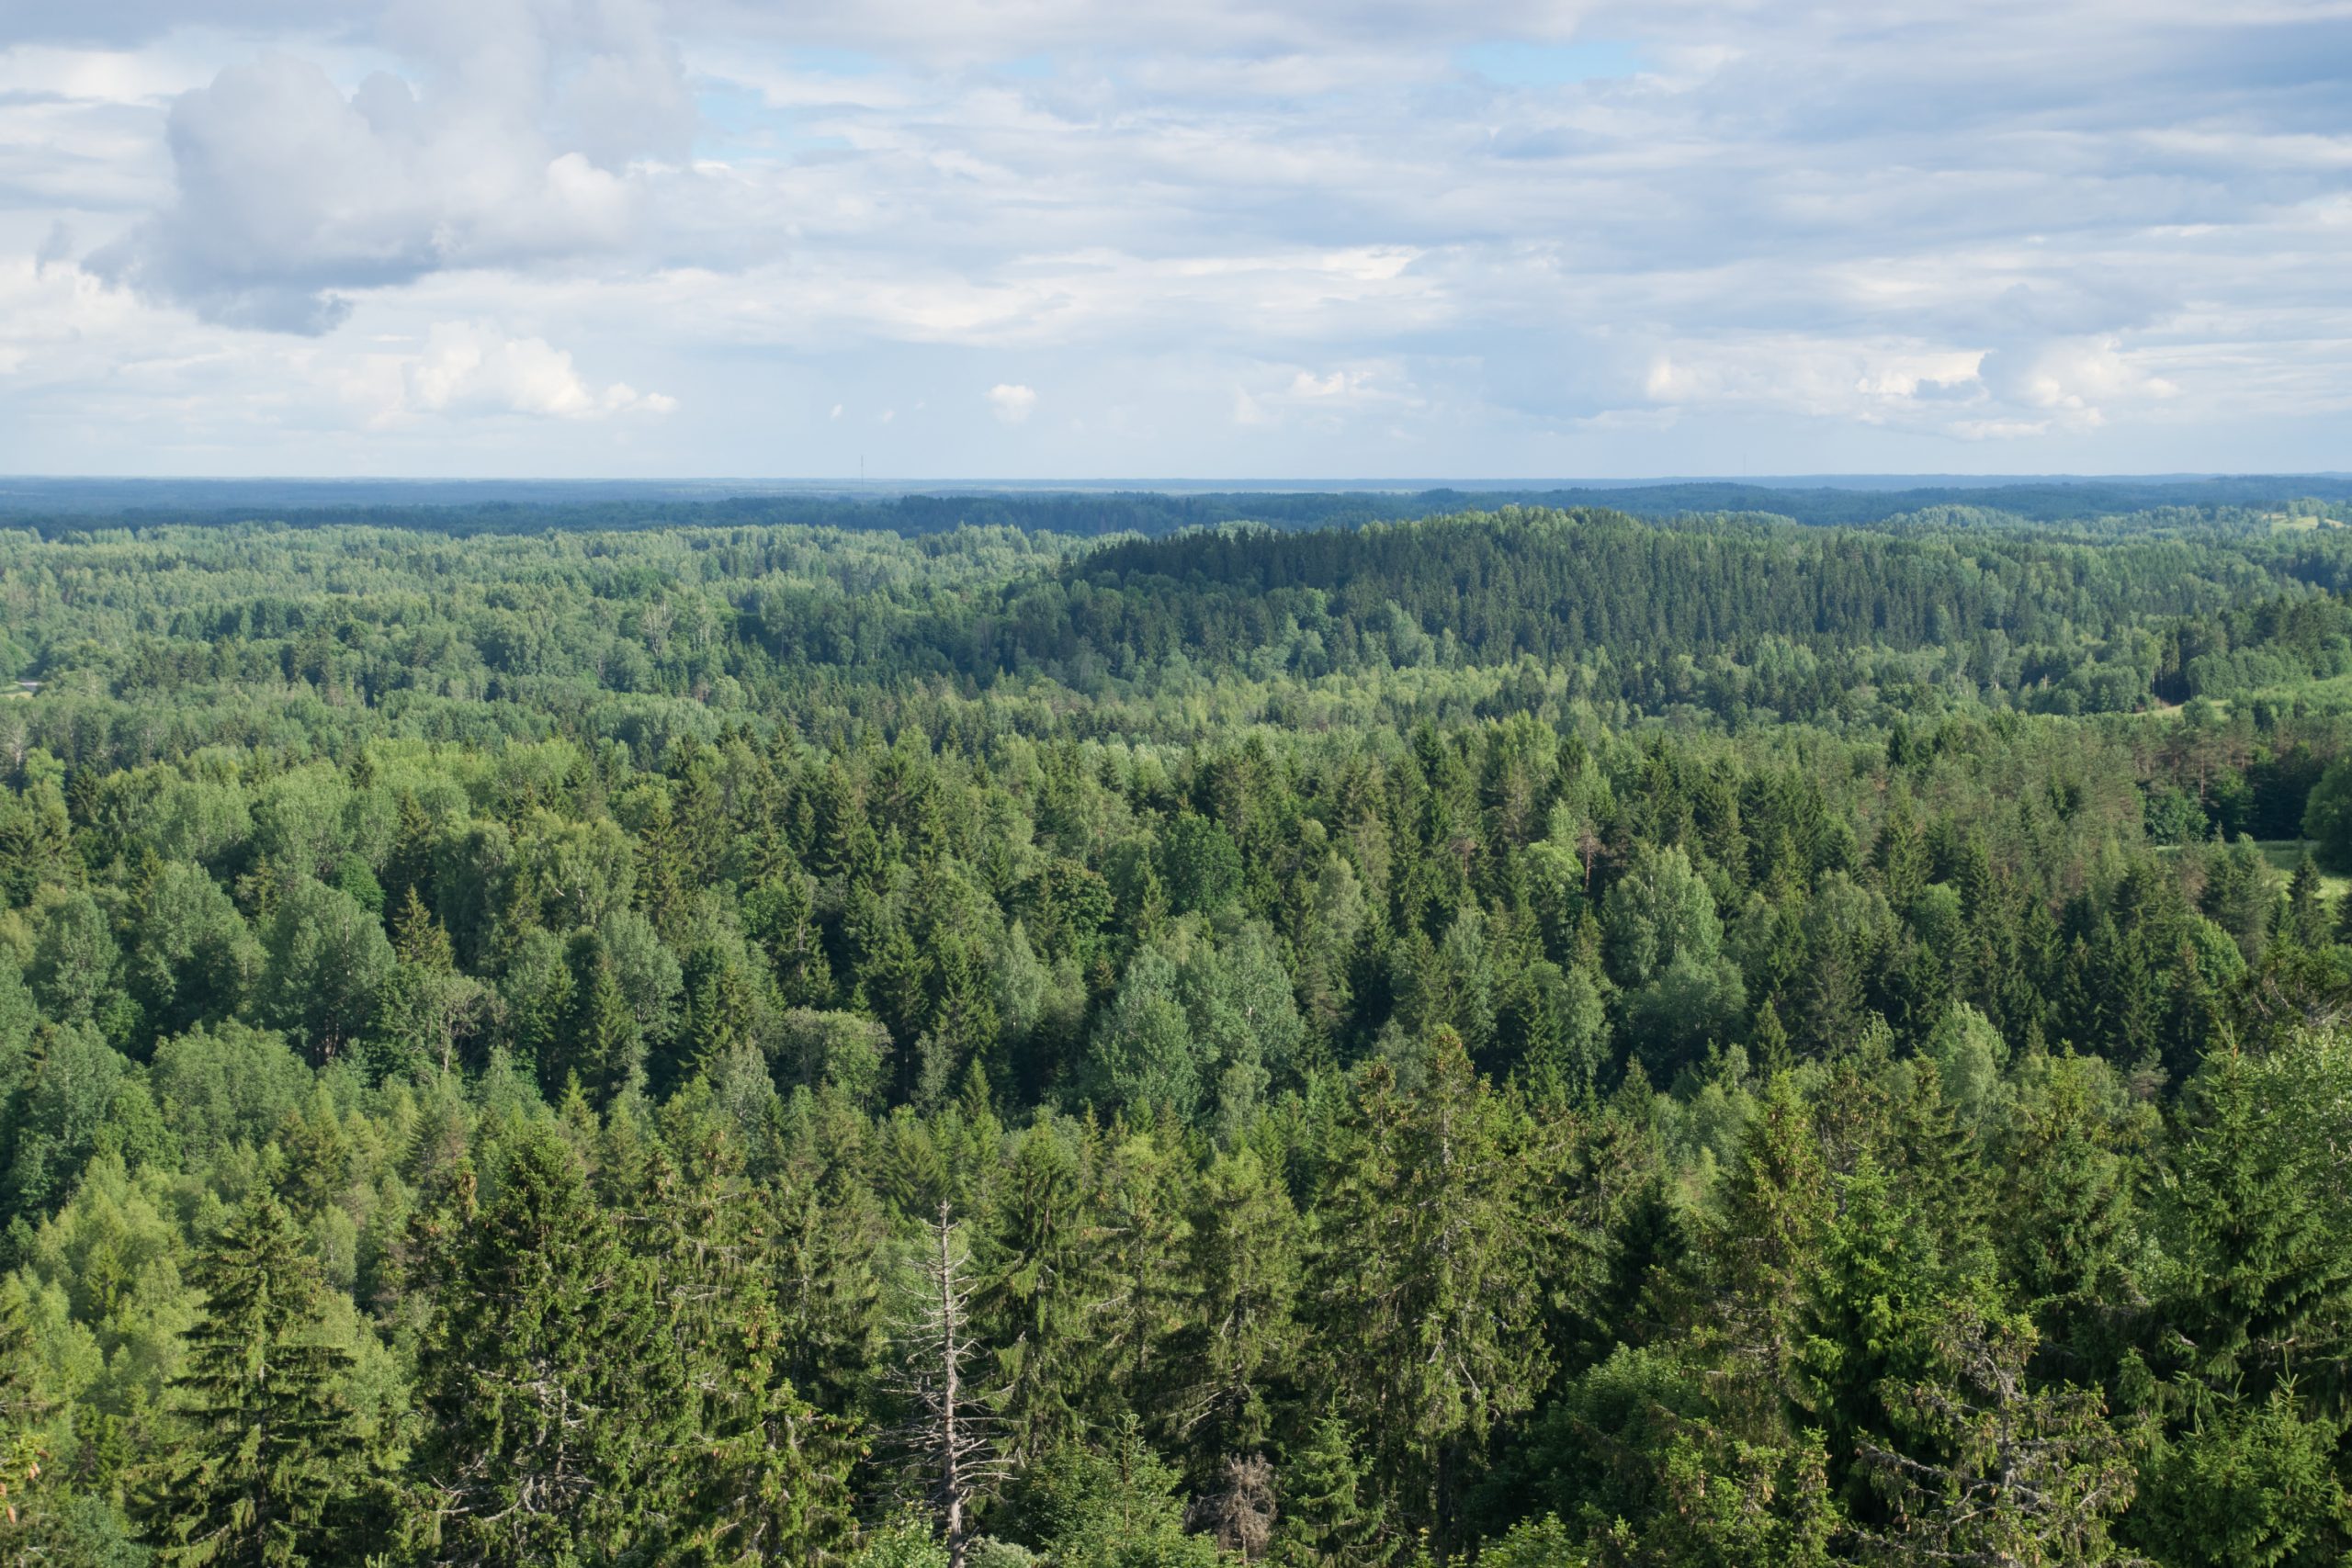
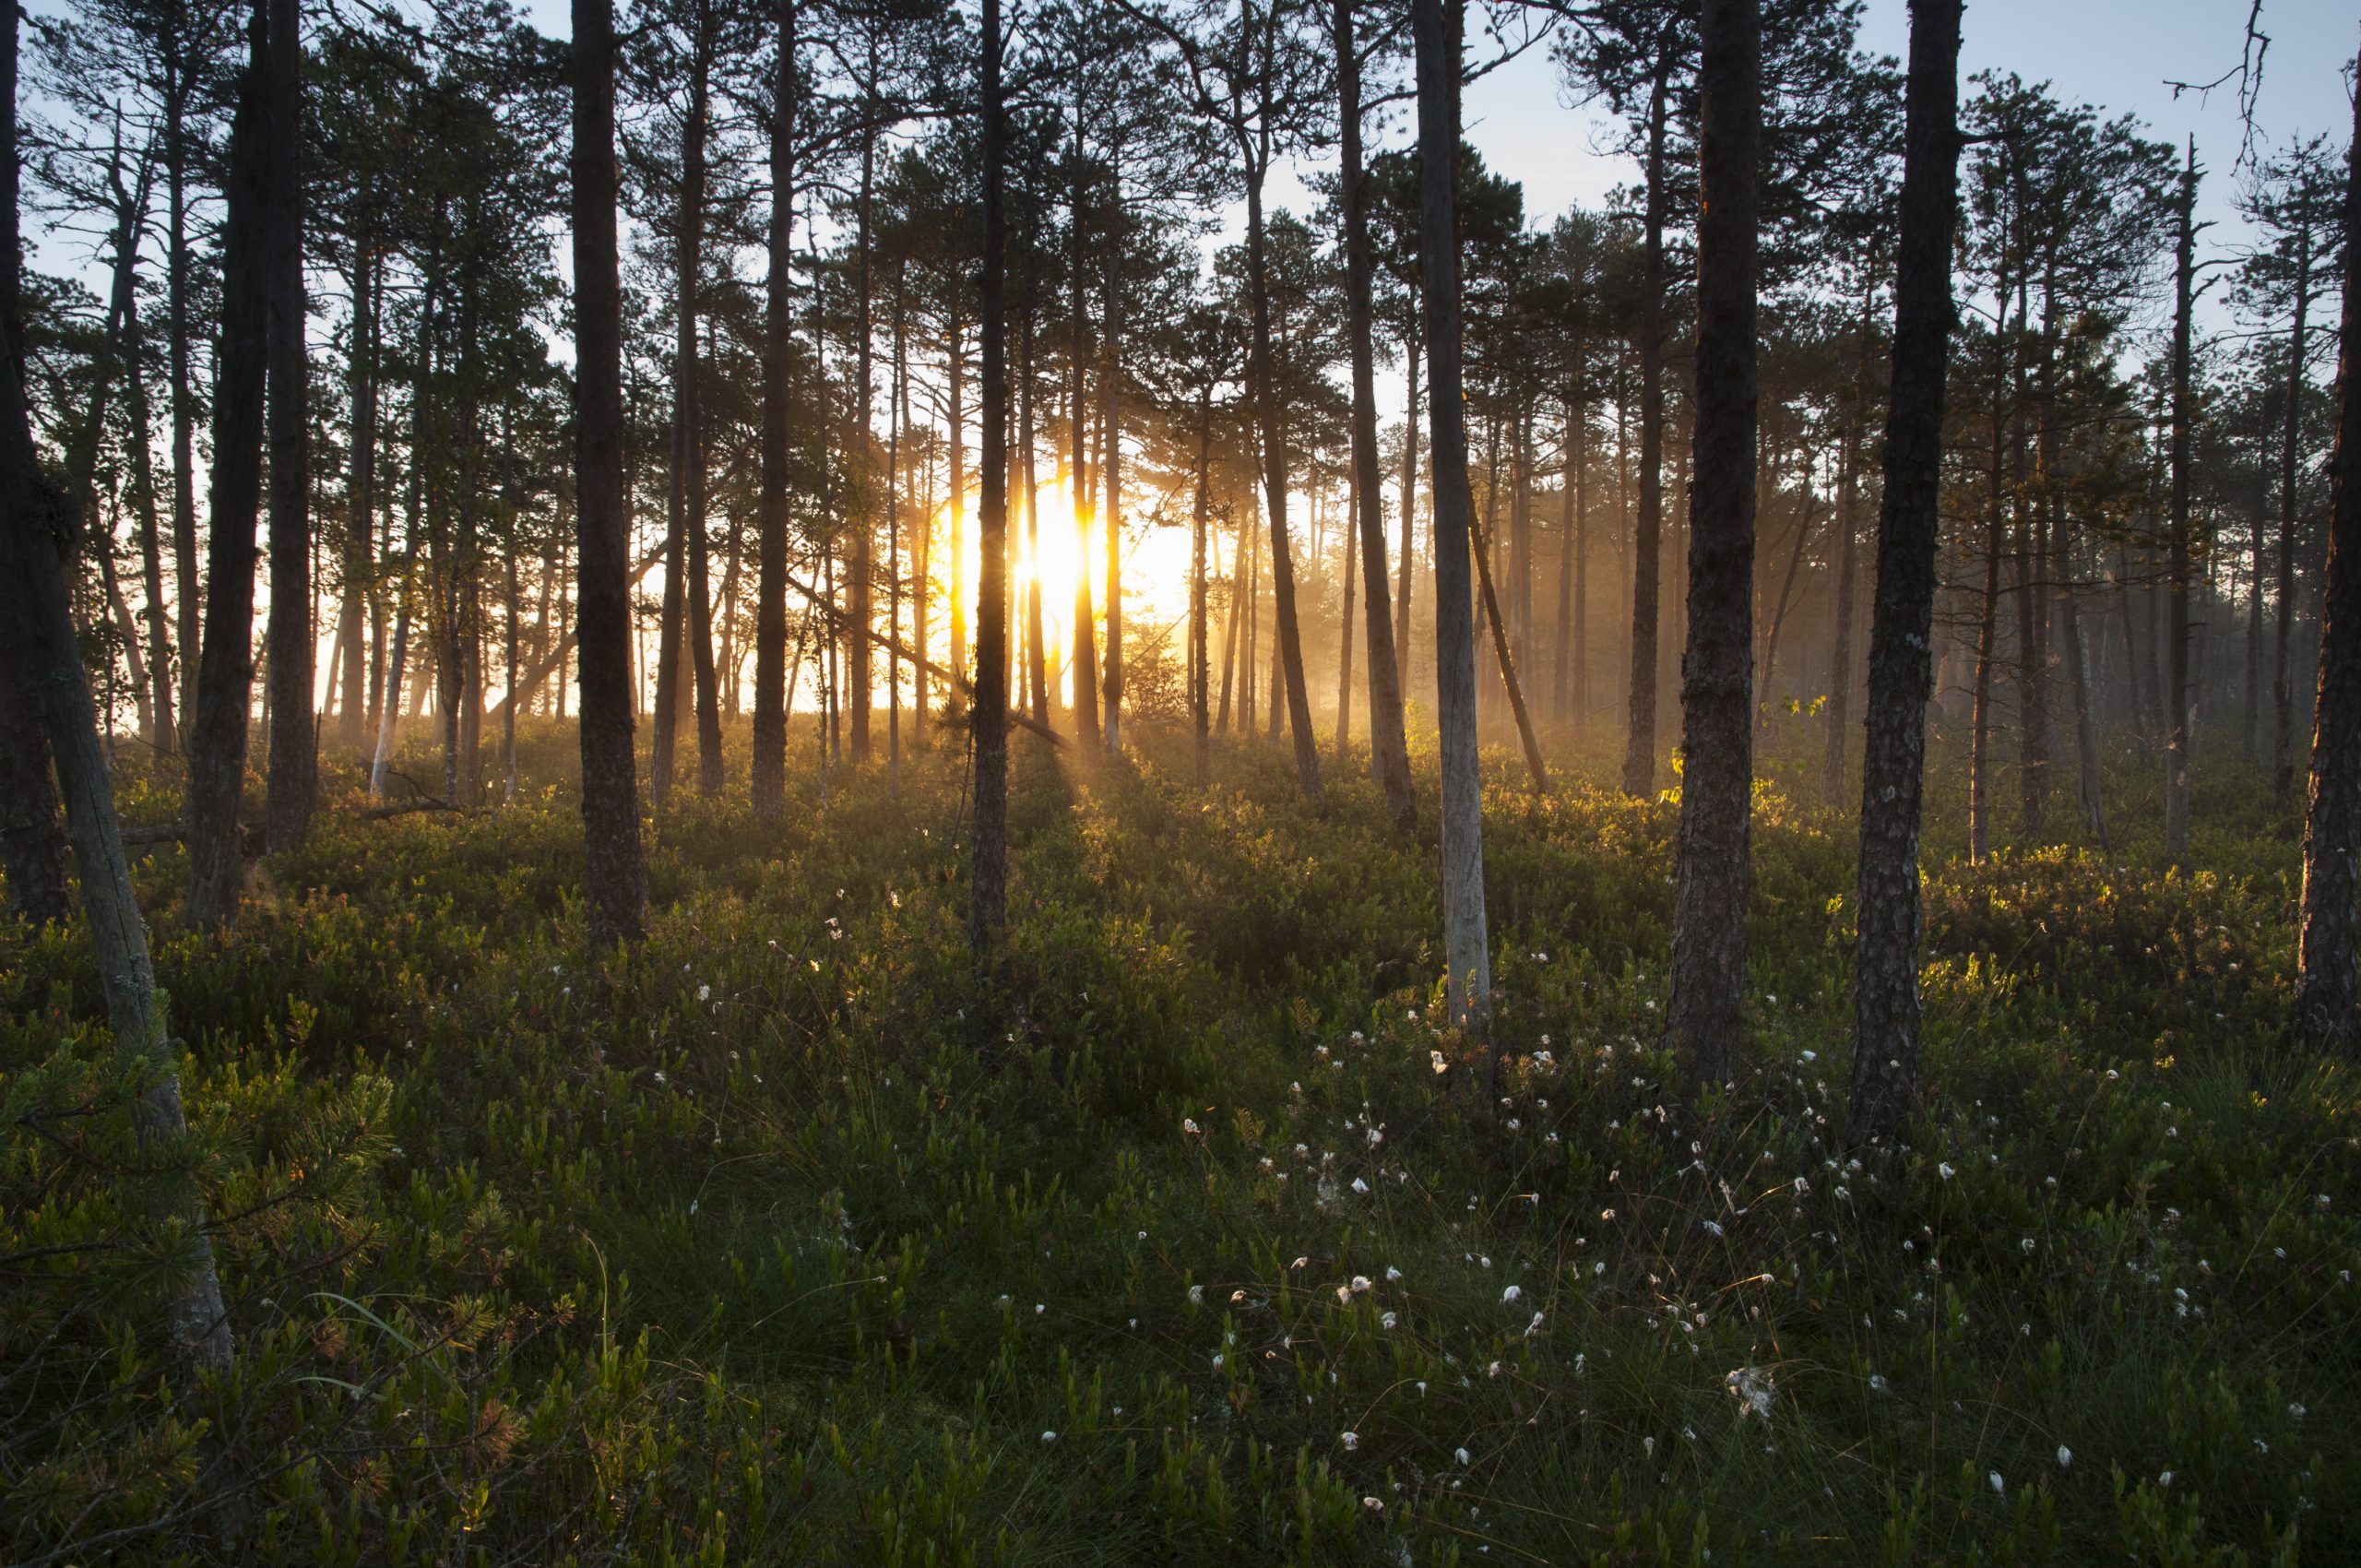
For an area dominated by forests, such as Northern Louisiana and Southern Arkansas, this decline in traditional markets came as a serious blow. It’s a region where a healthy market for wood products is vital for the local economy and, in turn, the health of the region’s forests. Luckily other wood product manufacturers and industries have since began to fill the gap.
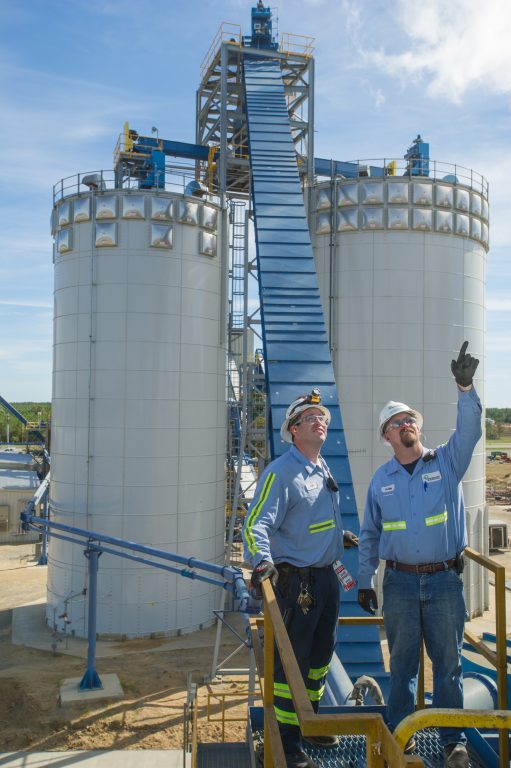
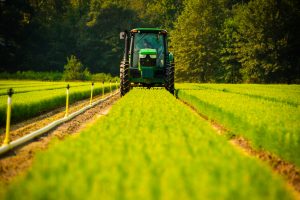
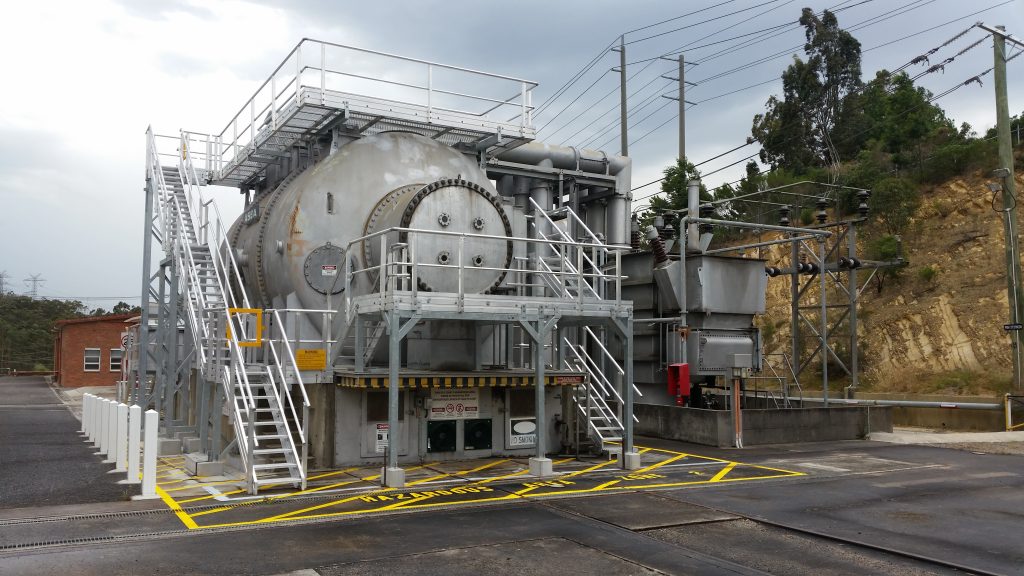
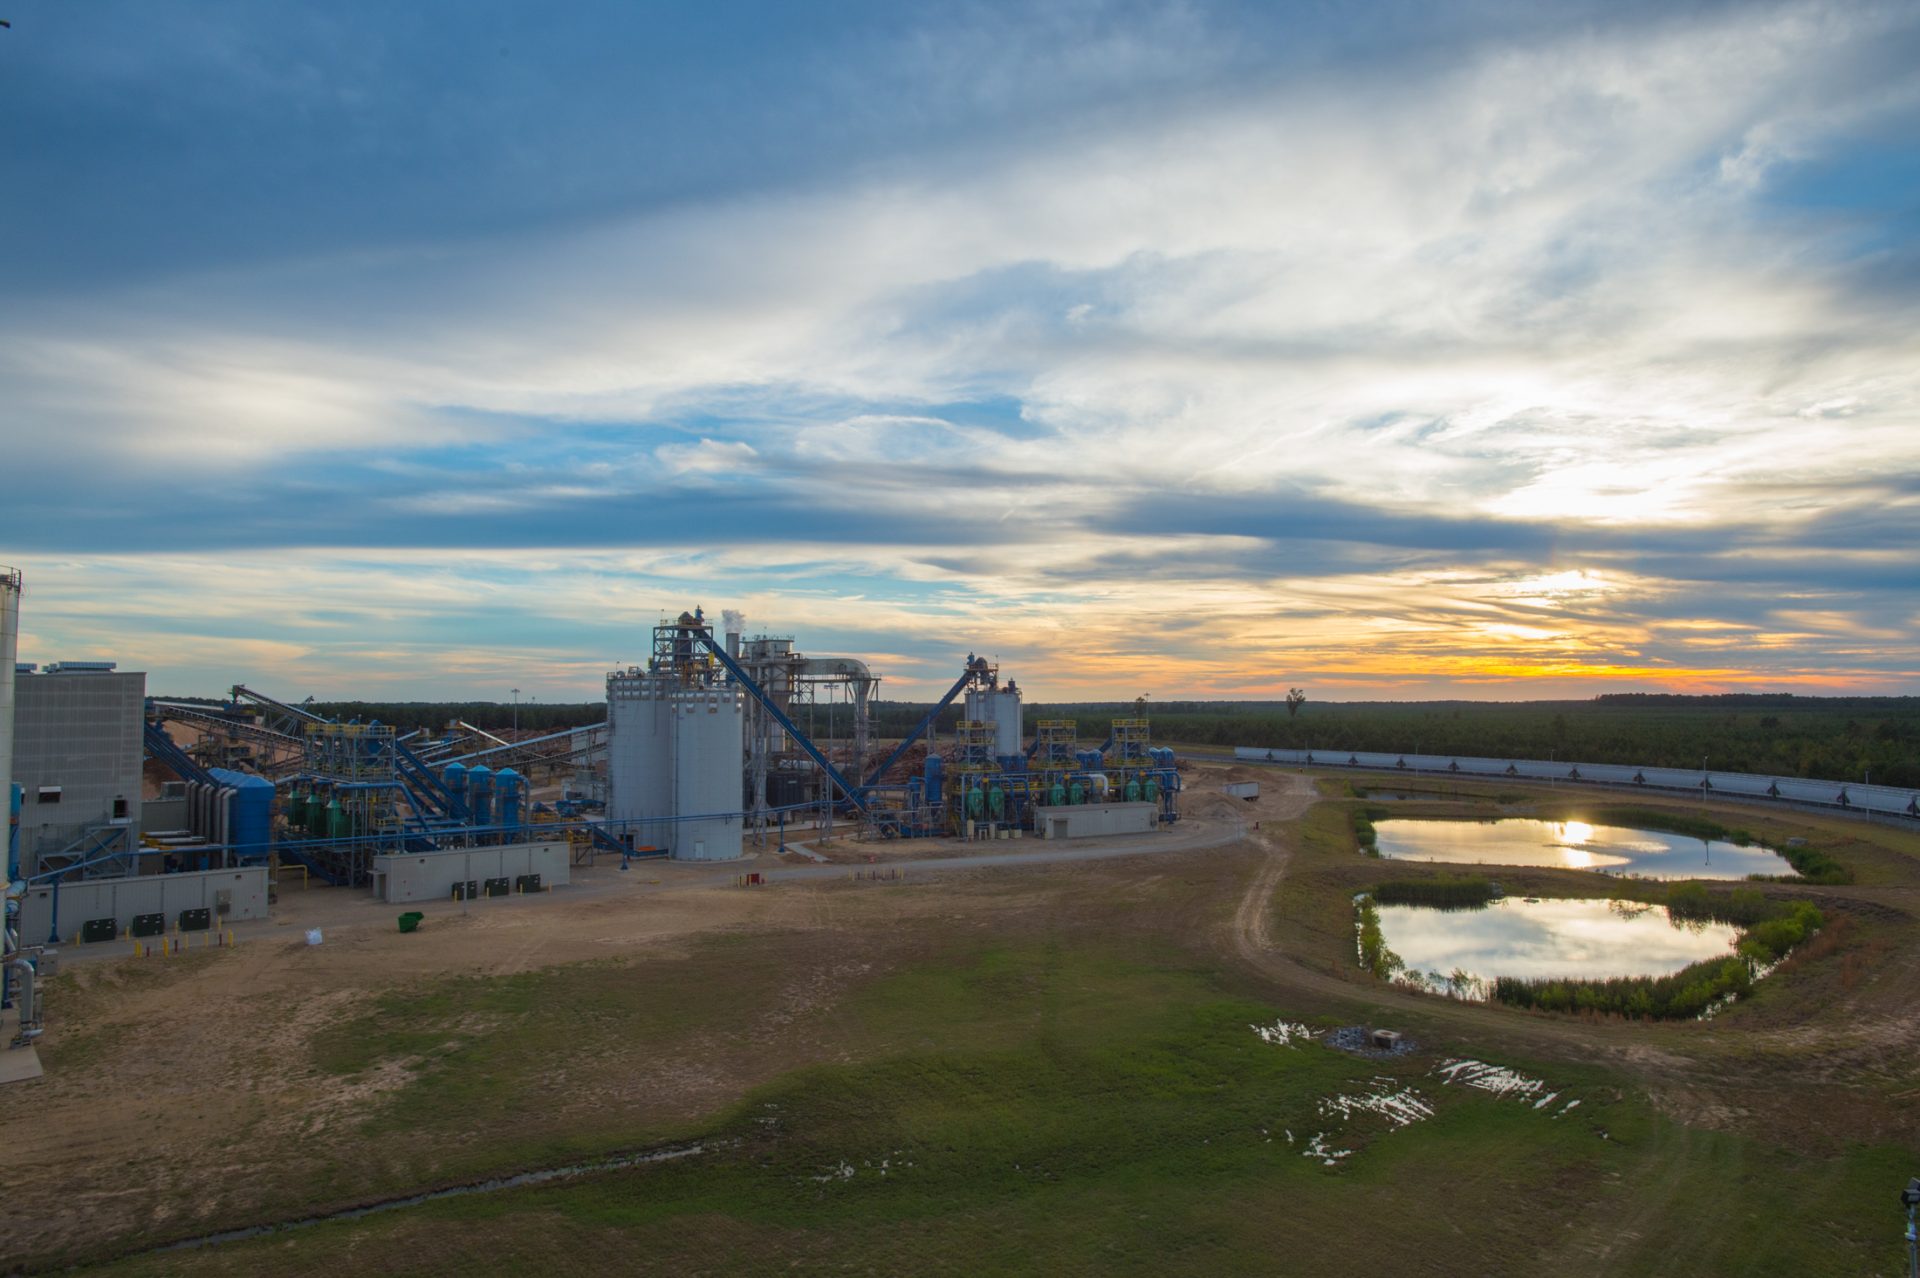
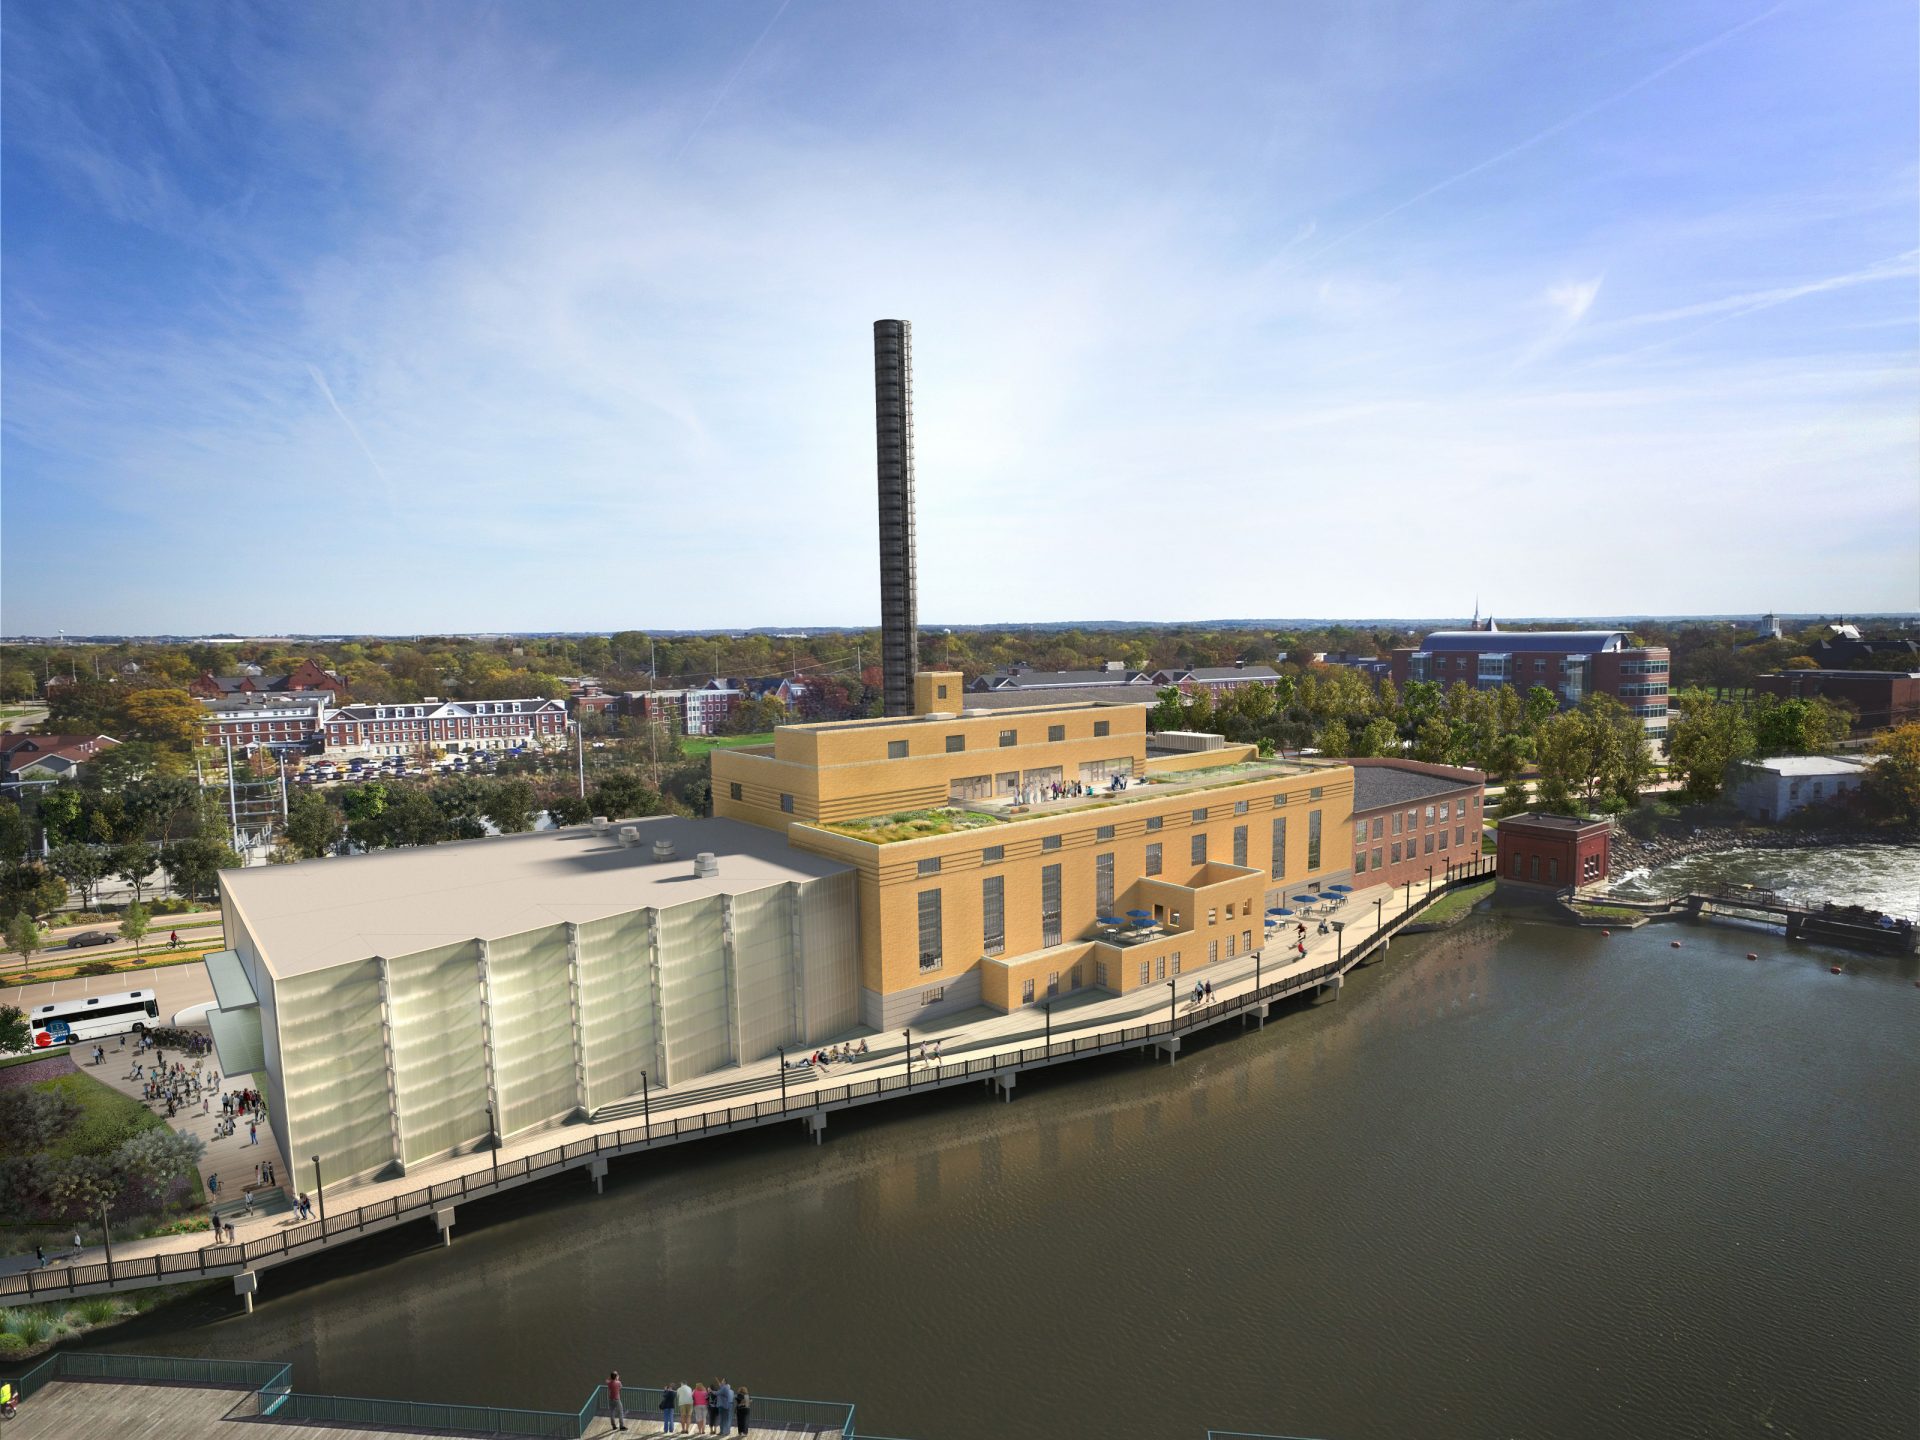
Engineers in front of wood pellet storage silos at Drax’s Morehouse BioEnergy biomass manufacturing facility in northern Louisiana
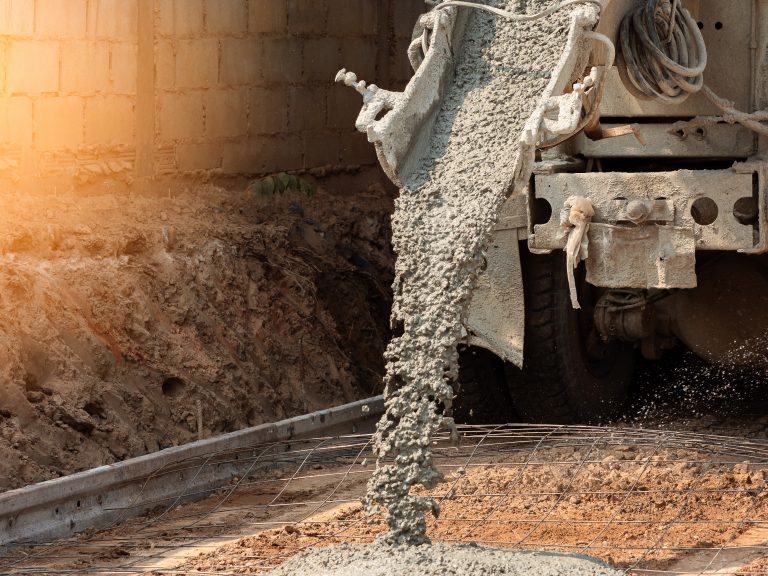
Drax Biomass has opened a mill in Morehouse parish that uses some of the the low-grade wood previously used to supply the paper industry to produce compressed wood pellets, which are used to generate renewable electricity in the UK.
Commissioned in 2015, the plant employs 74 people and can produce as much as 525,000 metric tonnes of biomass pellets a year. This makes it an important facility for local employment and the wood market in the region. However, to ensure it is positively contributing to the area and its environment, the demand for wood must be sustainably managed.
Morehouse BioEnergy sources low-grade wood from a catchment area that covers a 60-mile radius and includes 18 counties in Arkansas and four in Louisiana.
As Drax Biomass doesn’t own any of the forests it sources wood products from, it regularly examines the environmental impact of its pellet mills on the forests and markets in which it operates. The aim is to ensure the biomass used by Drax to generate 12% of Great Britain’s renewable electricity is sustainably sourced and does not contribute to deforestation or other negative climate and environment impacts.
A new report by forestry research and consulting firm Forisk evaluates the impact of biomass pellet demand from Morehouse BioEnergy on the forests and wood markets within the mill’s catchment area.
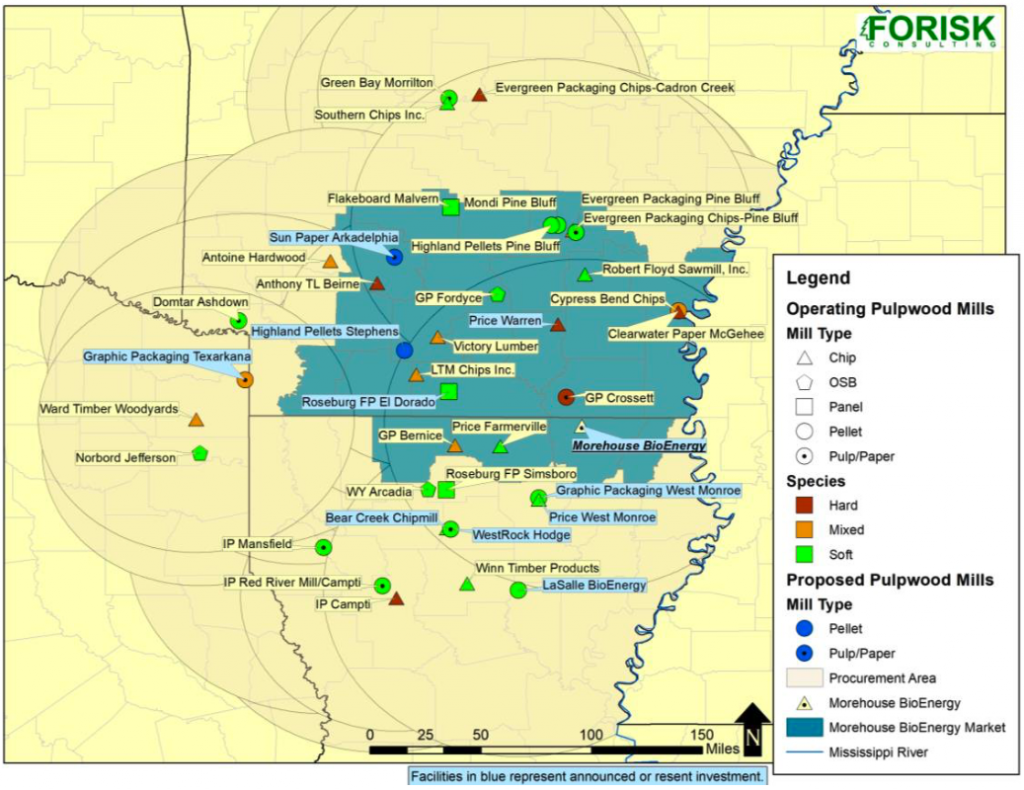
Map of pulpwood-using mills near Morehouse timber market
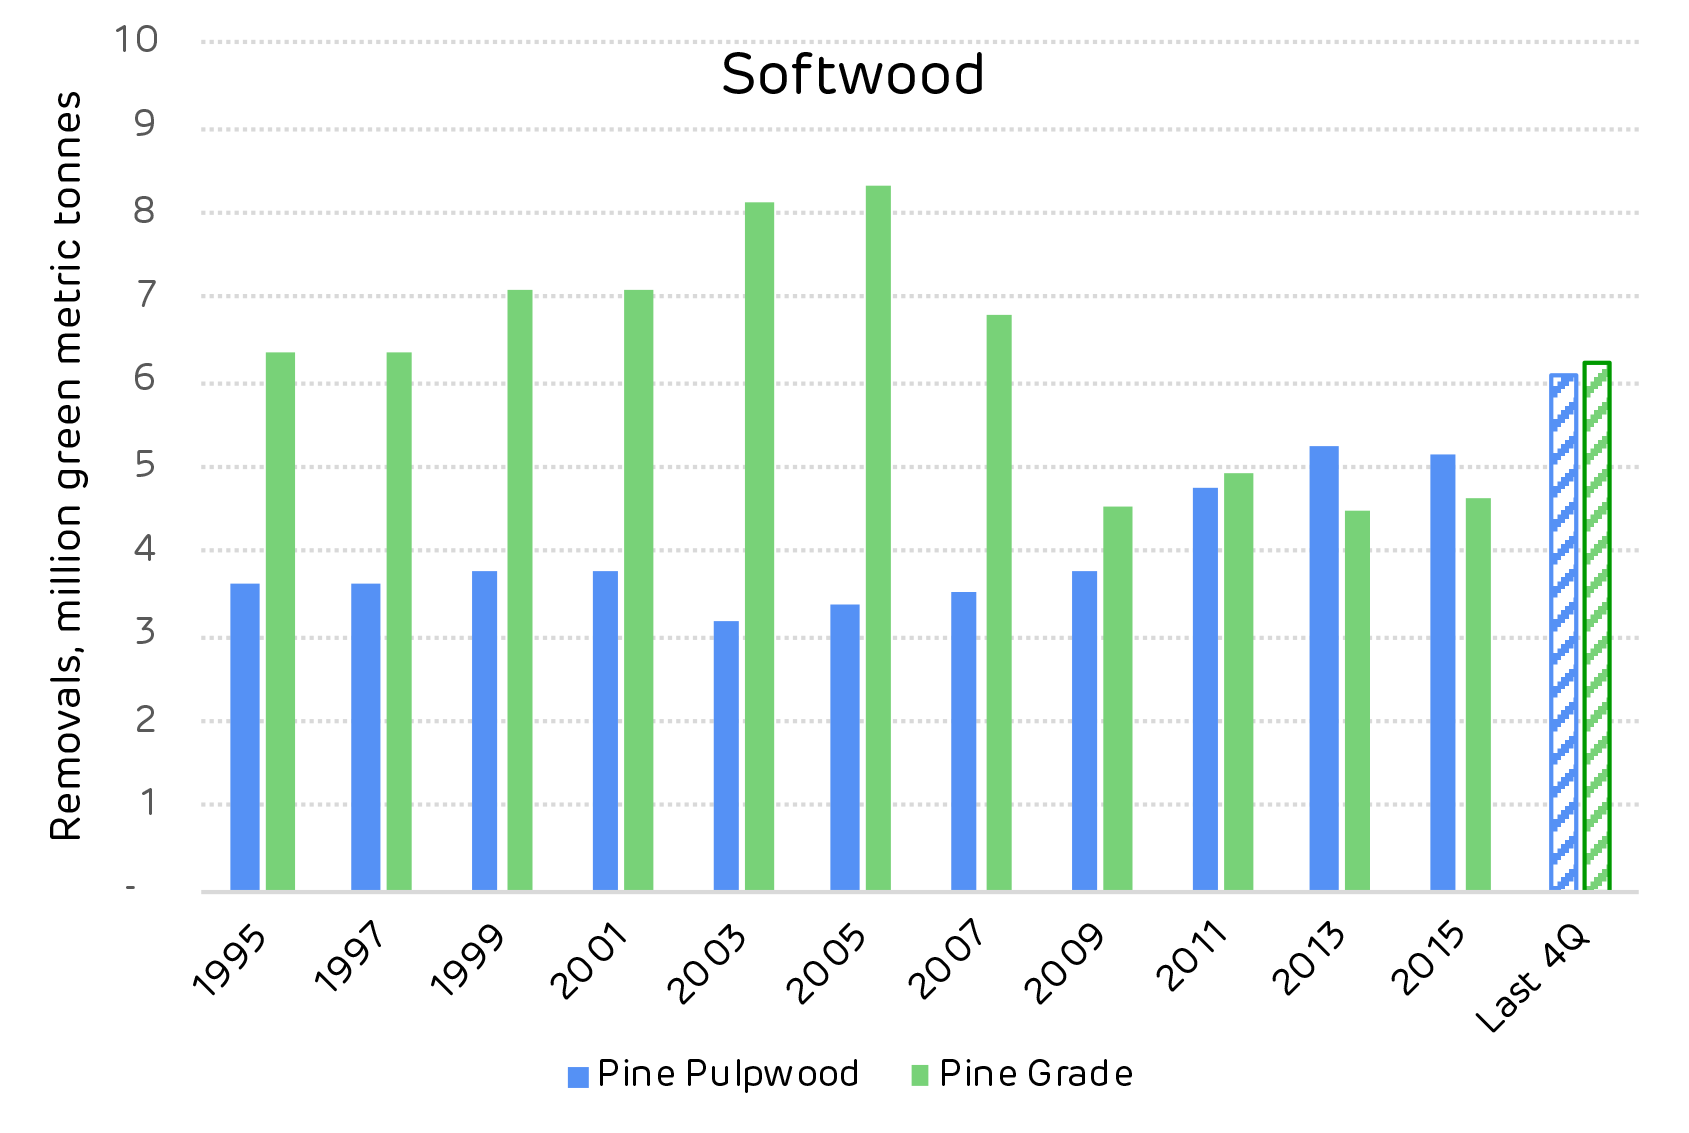
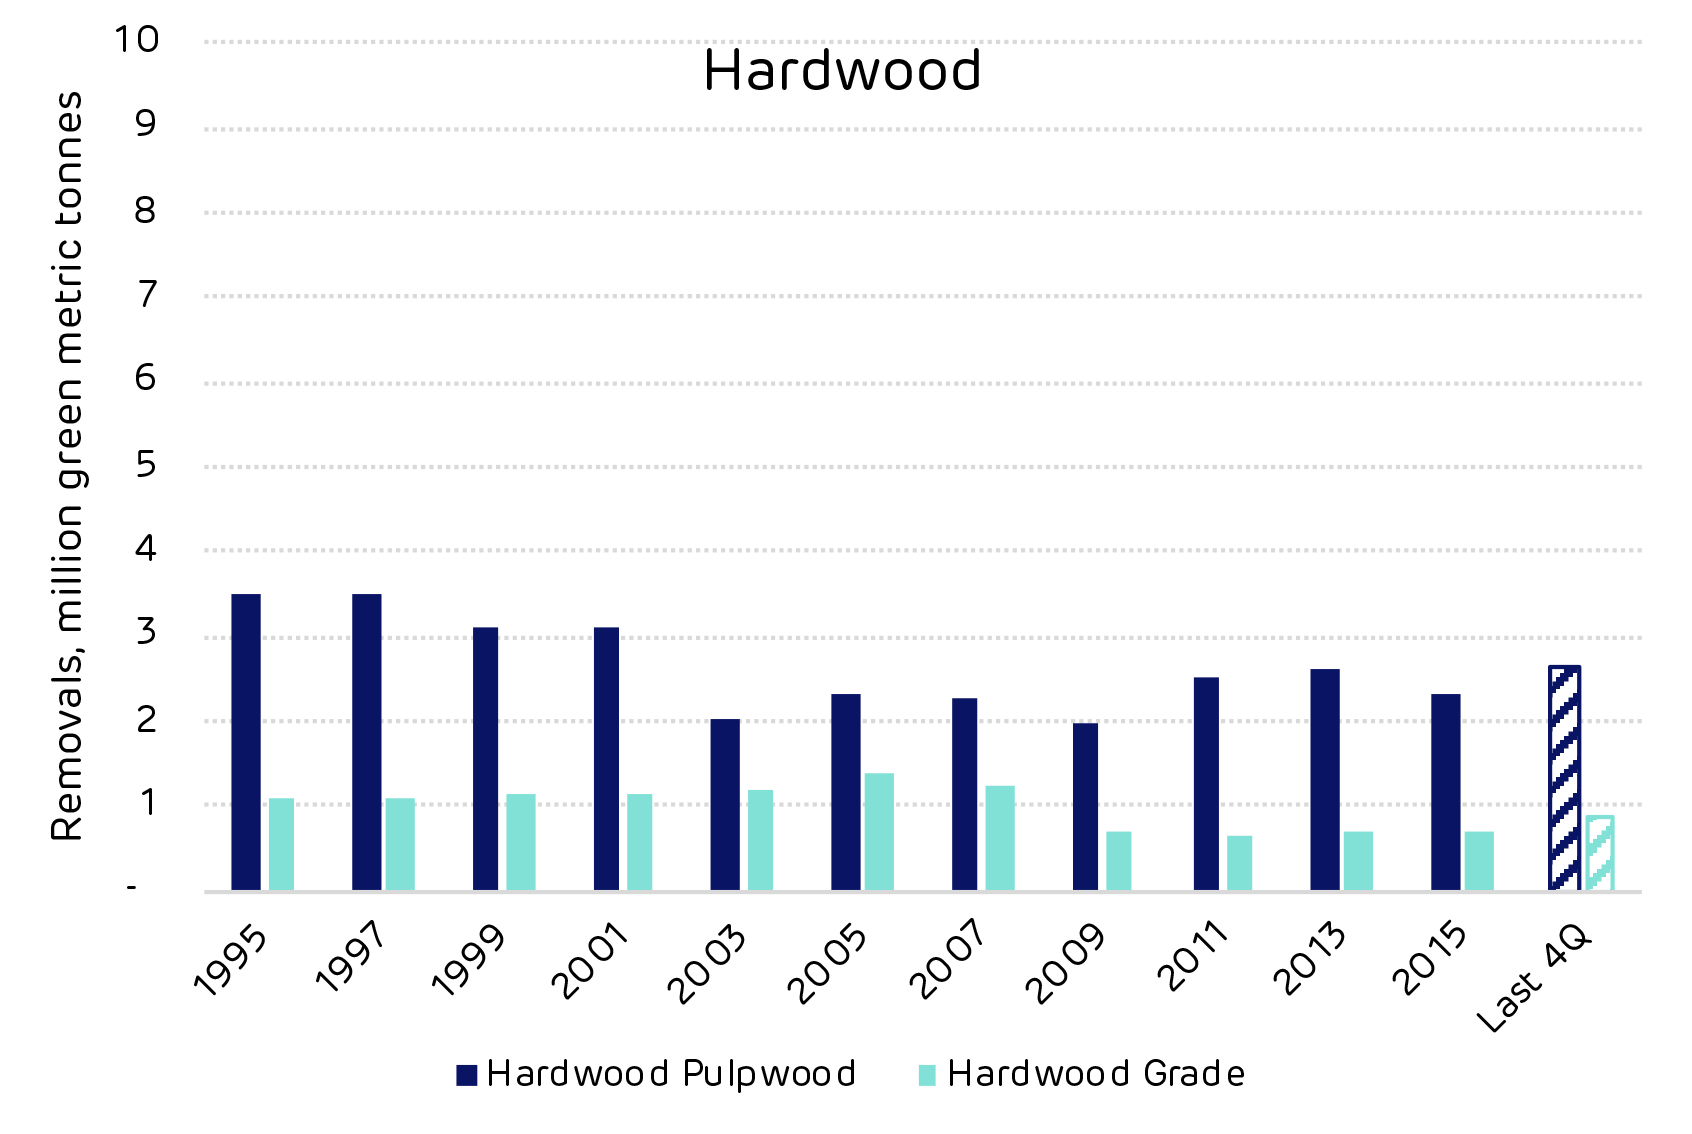
It found that biomass demand in the region does not contribute to deforestation, nor increase forest harvesting above a sustainable level. Overall, growth of the region’s pine timberland, which supplies Morehouse BioEnergy, continues to exceed removals, pointing to expanding forest carbon and wood inventory.
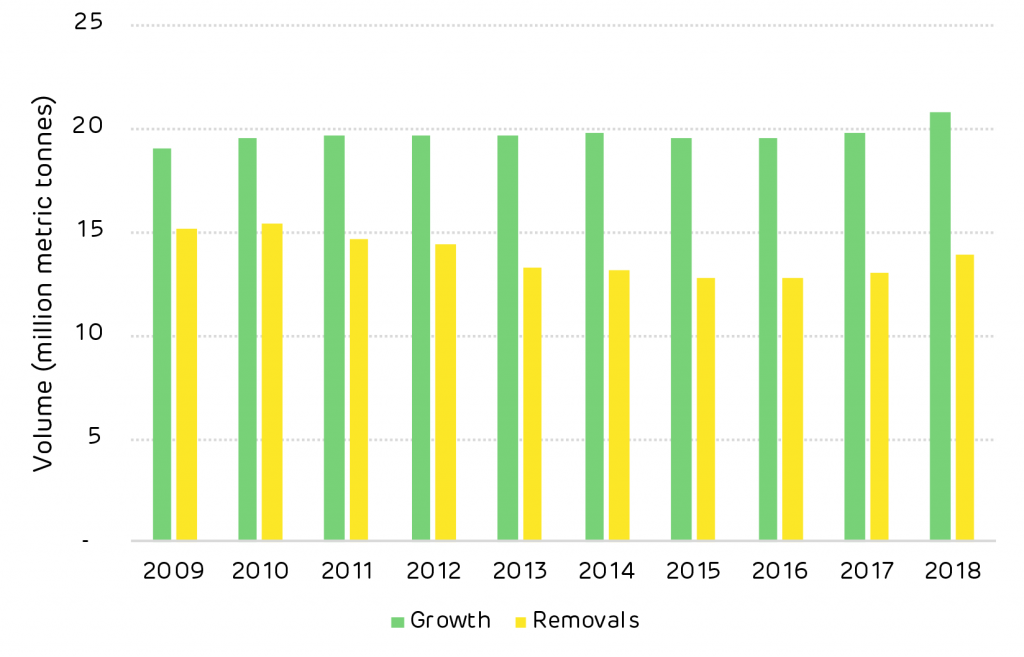
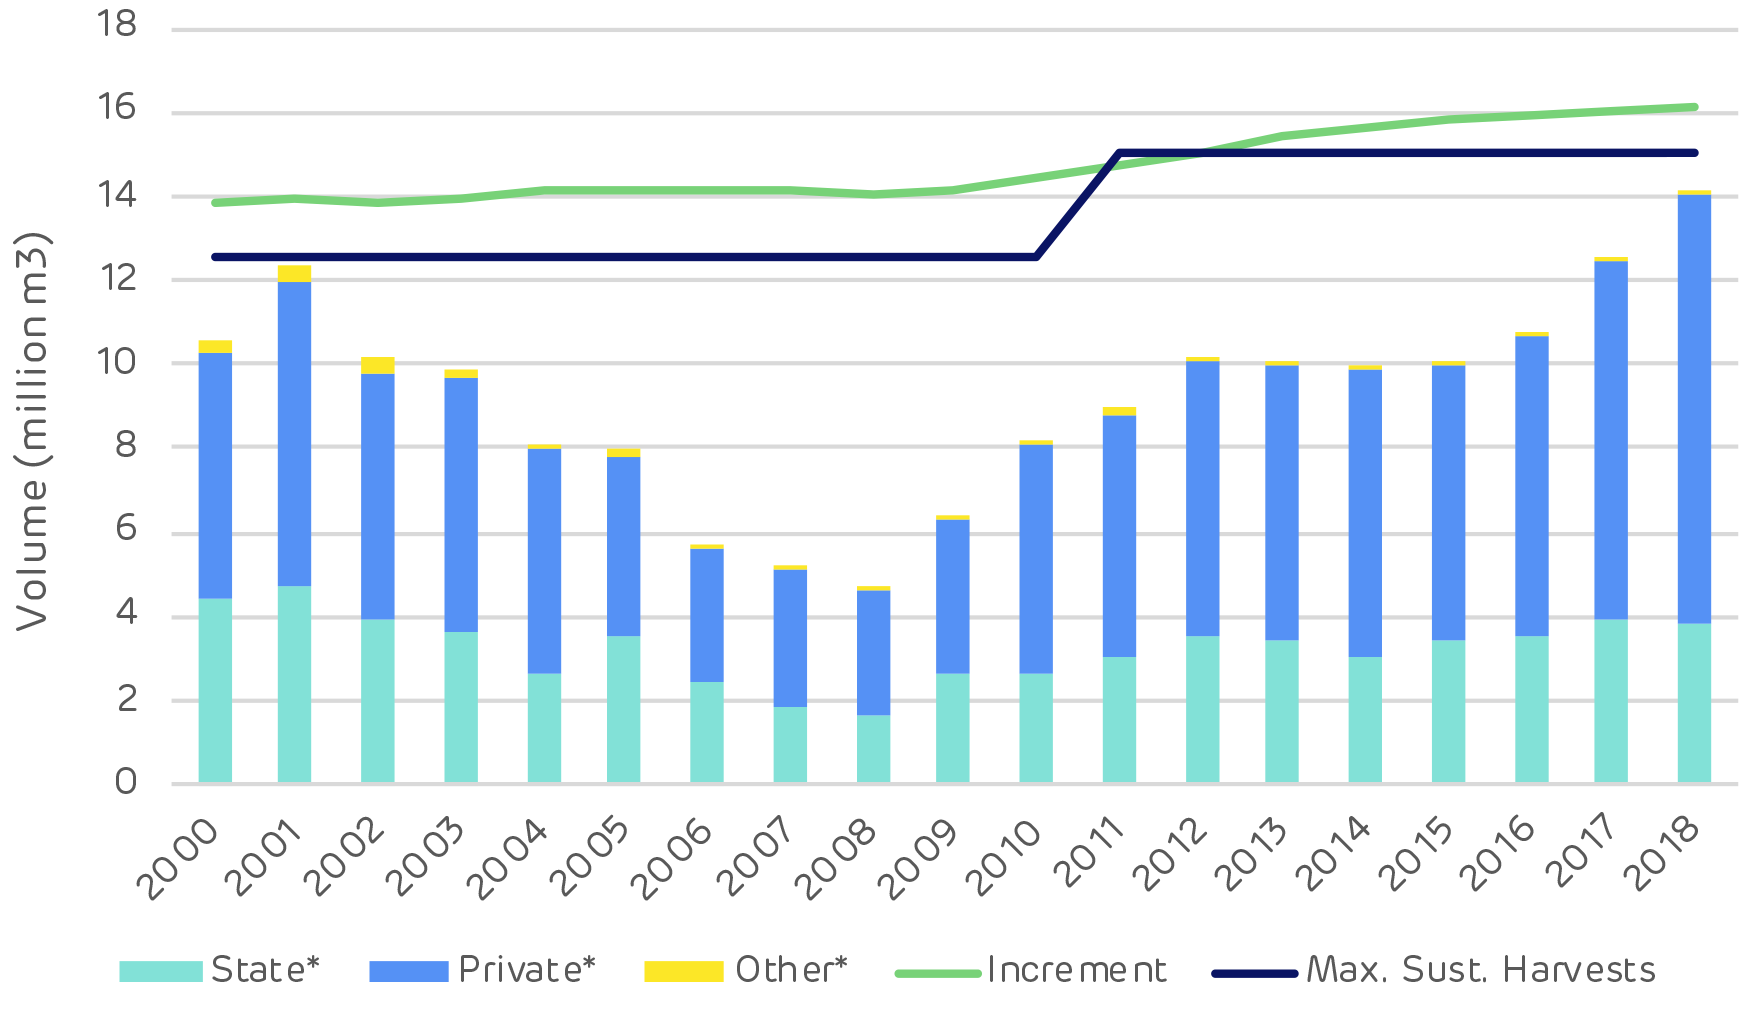
Annual growth compared to harvesting removals
Growing forests and increasing timber stocks
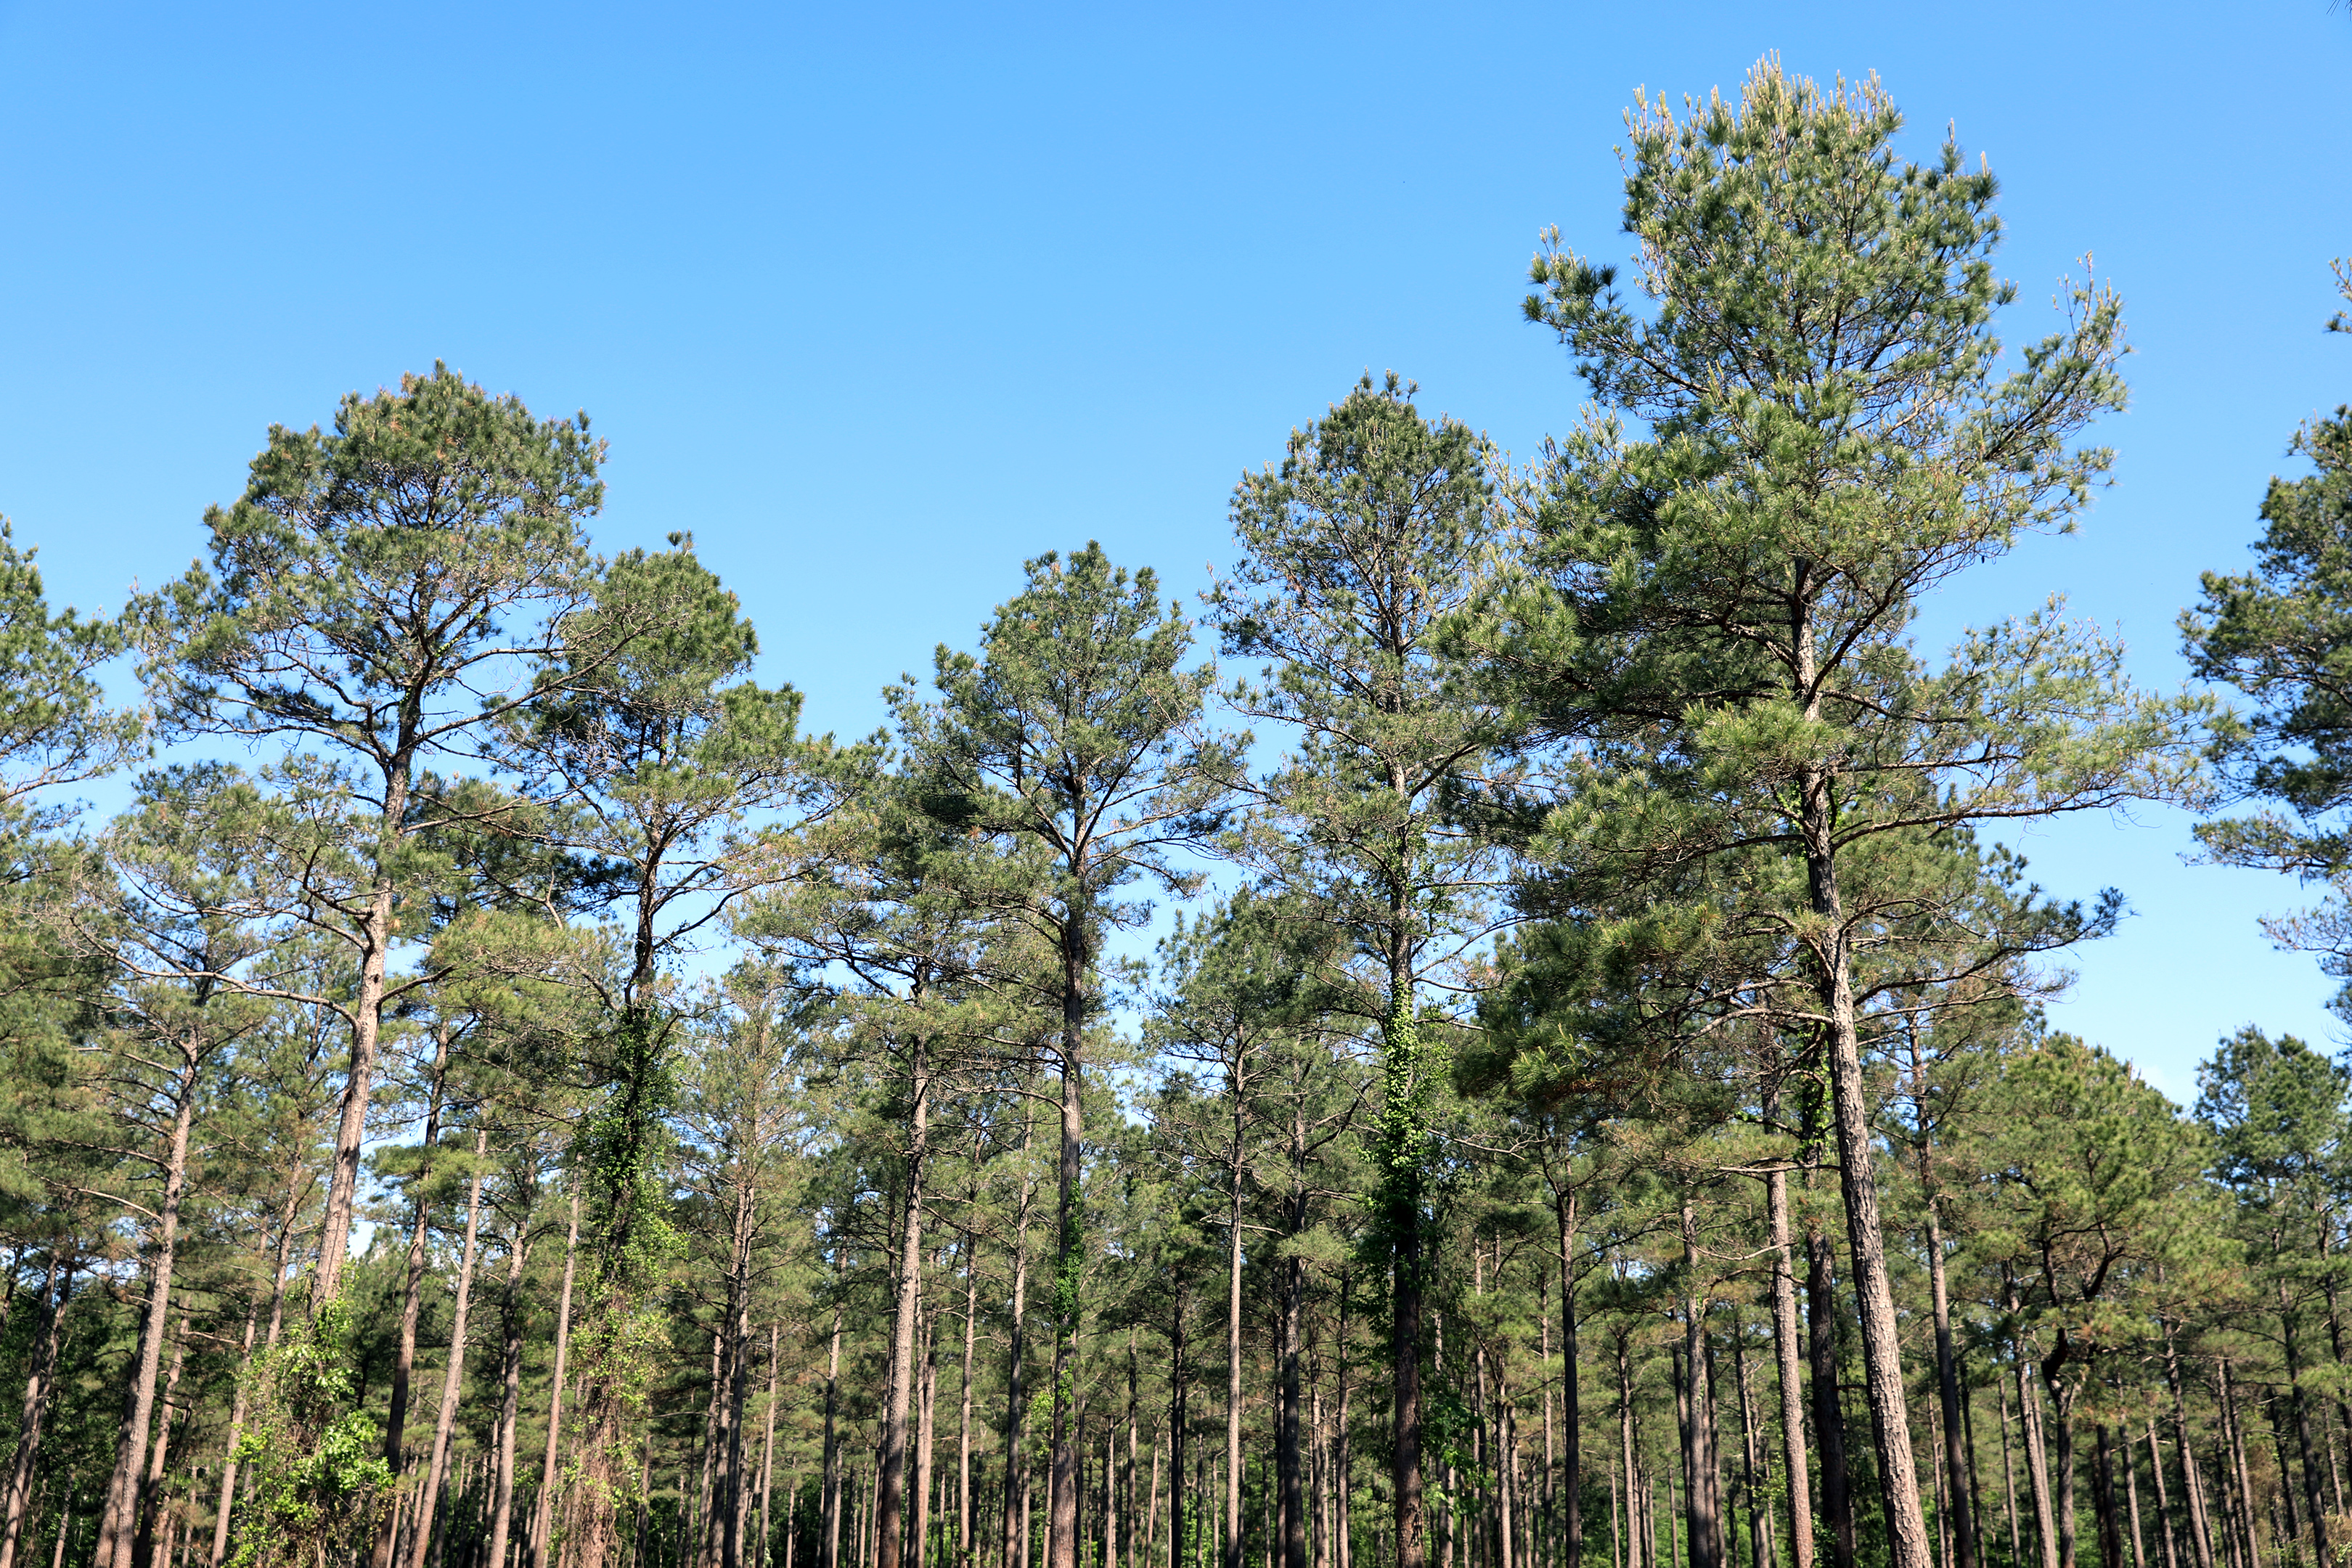
The study focuses on timberland – working forests – in the plant’s sourcing area, which the US Forestry Service categorises as productive land capable of providing timber on an industrial scale.
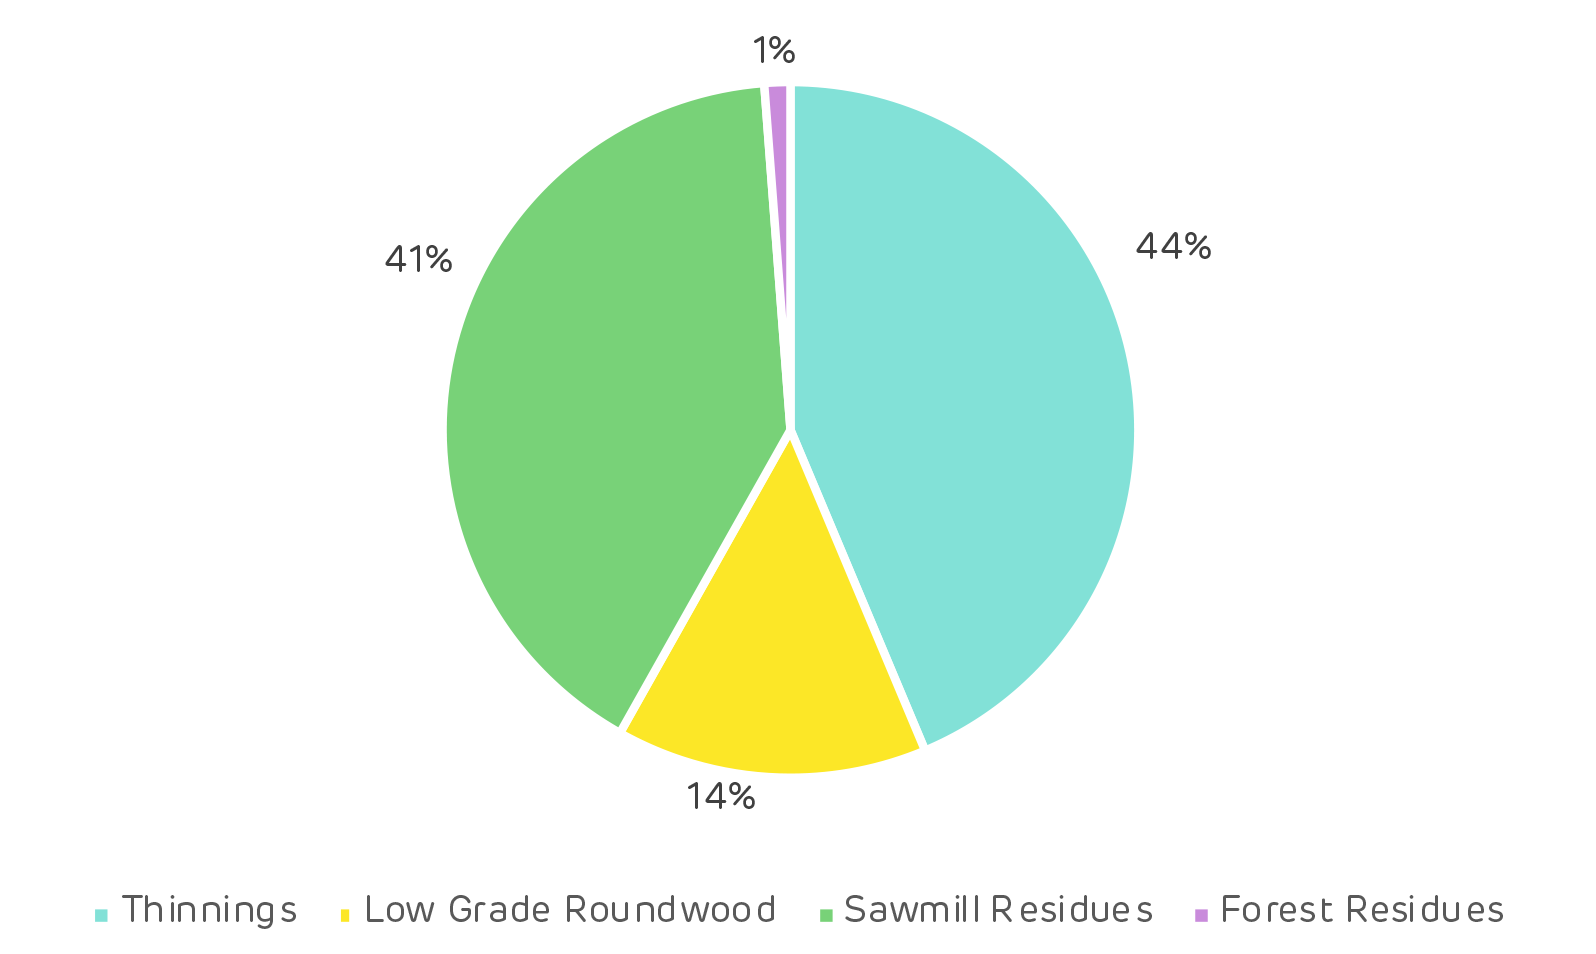
The timberland here is made up of 63% softwood trees, which includes pines, and 37% hardwoods such as oak. Pellet manufacturing as a whole (including other pellet producers in the area), accounts for only 6% of the demand for wood products in the region. Of that, Morehouse BioEnergy contributes to 4% of total pellet demand.
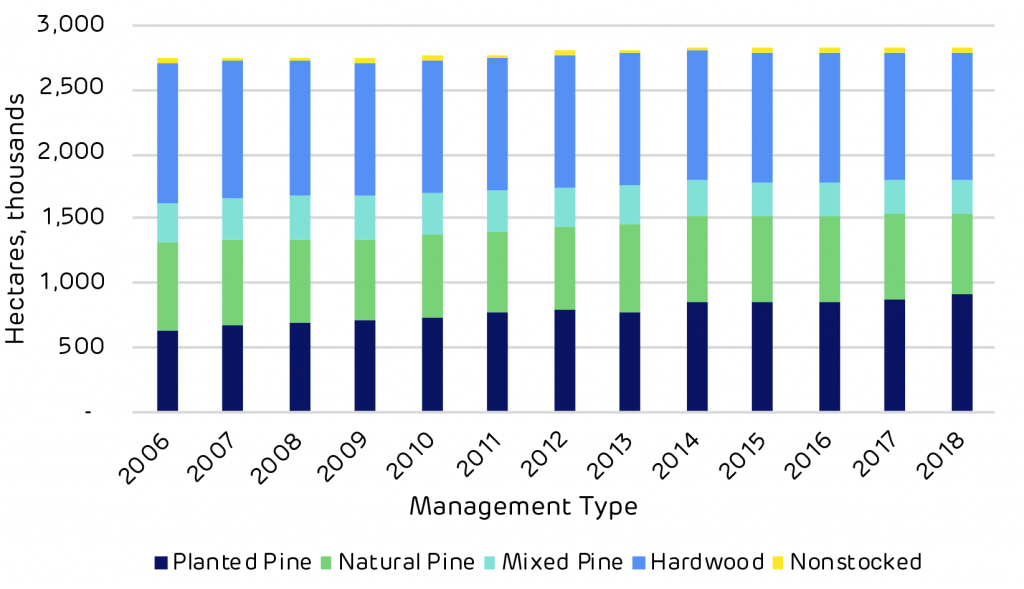
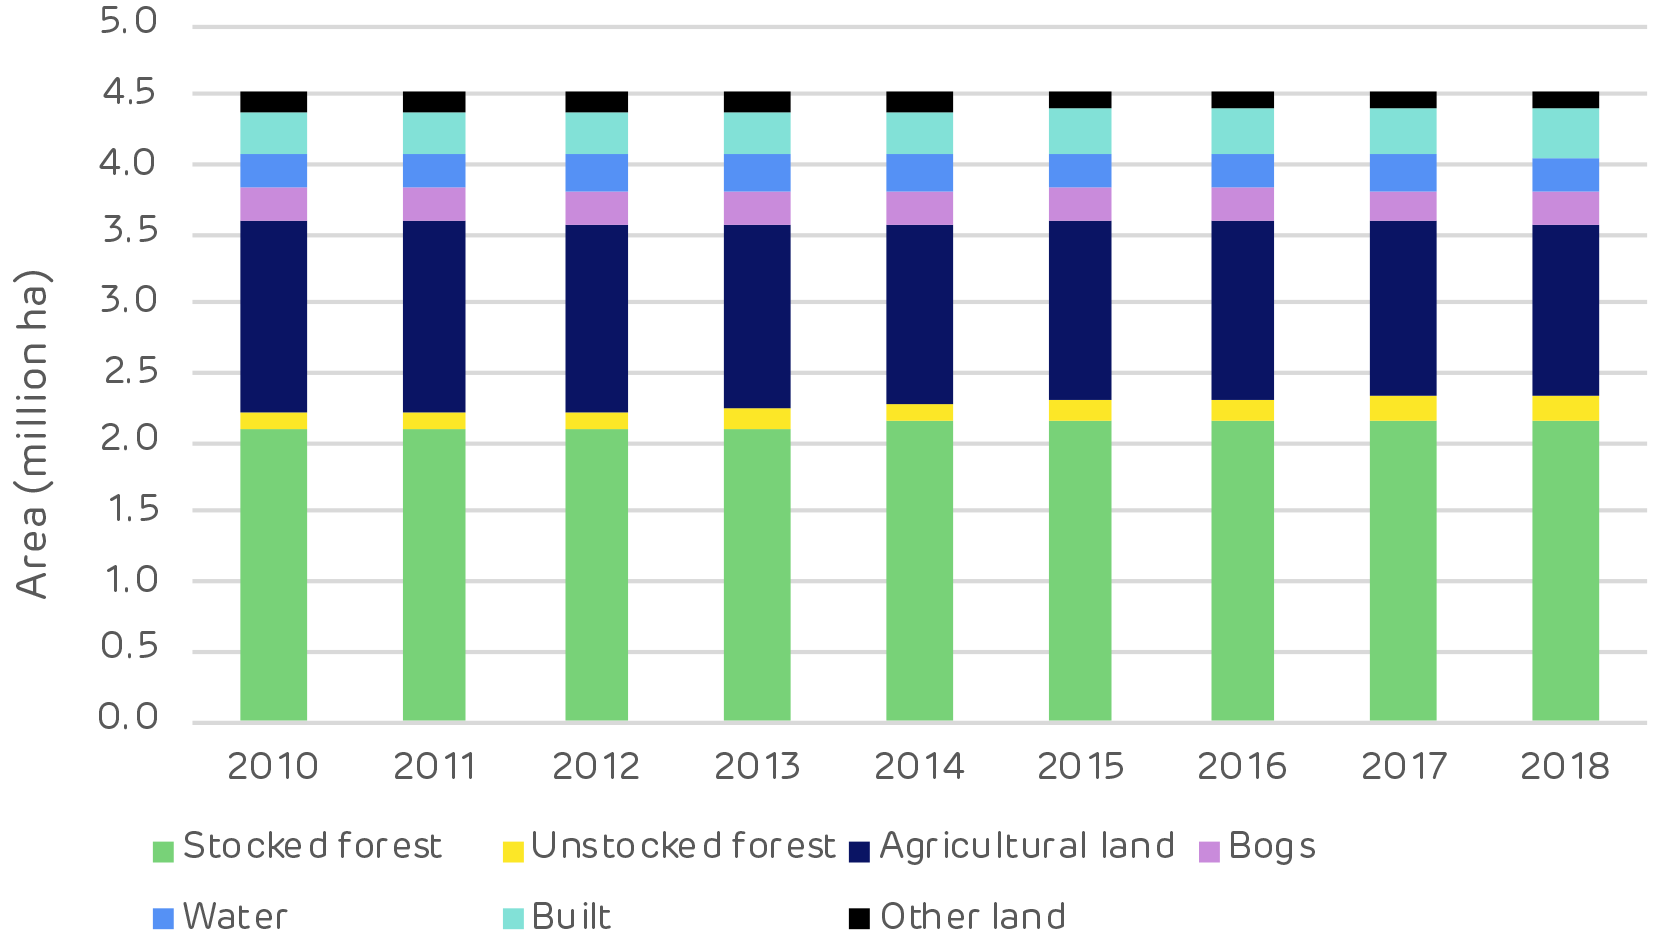
Total area of timberland
Lumber – such as sawtimber – makes up the bulk of demand for wood products, accounting for 46% of total demand, largely as a result of its high market value and landowners’ aims to extract maximum revenue from their pine stands.
However, the less valuable wood – parts of trees that are misshapen, too short or thin to be used for lumber – can be sold at a lower price to biomass pellet mills. This wood might previously have been sold to paper and pulp mills exclusively, but with International Paper’s departure, Morehouse BioEnergy now fills a part of that role.
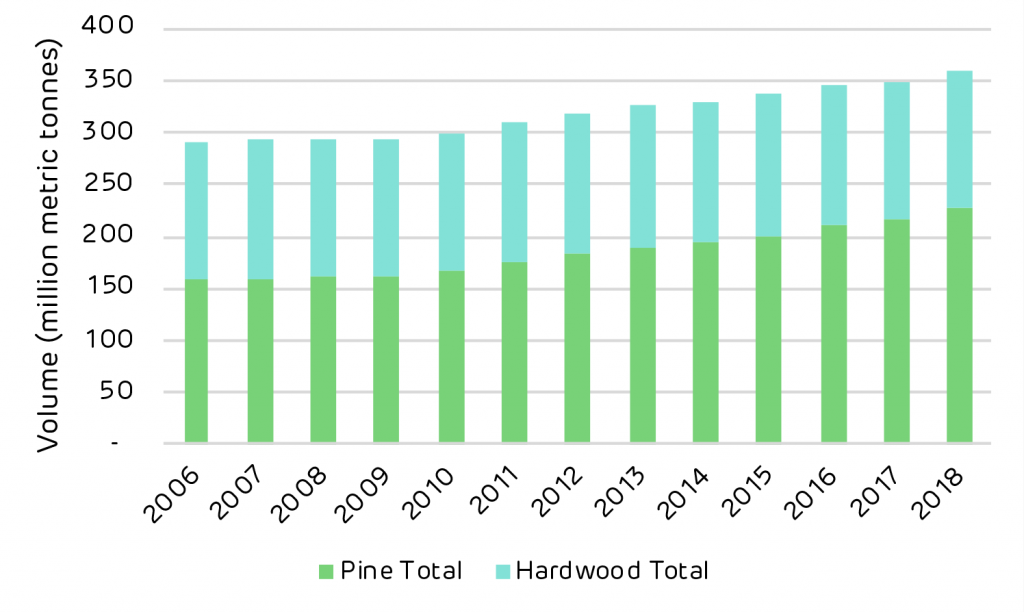
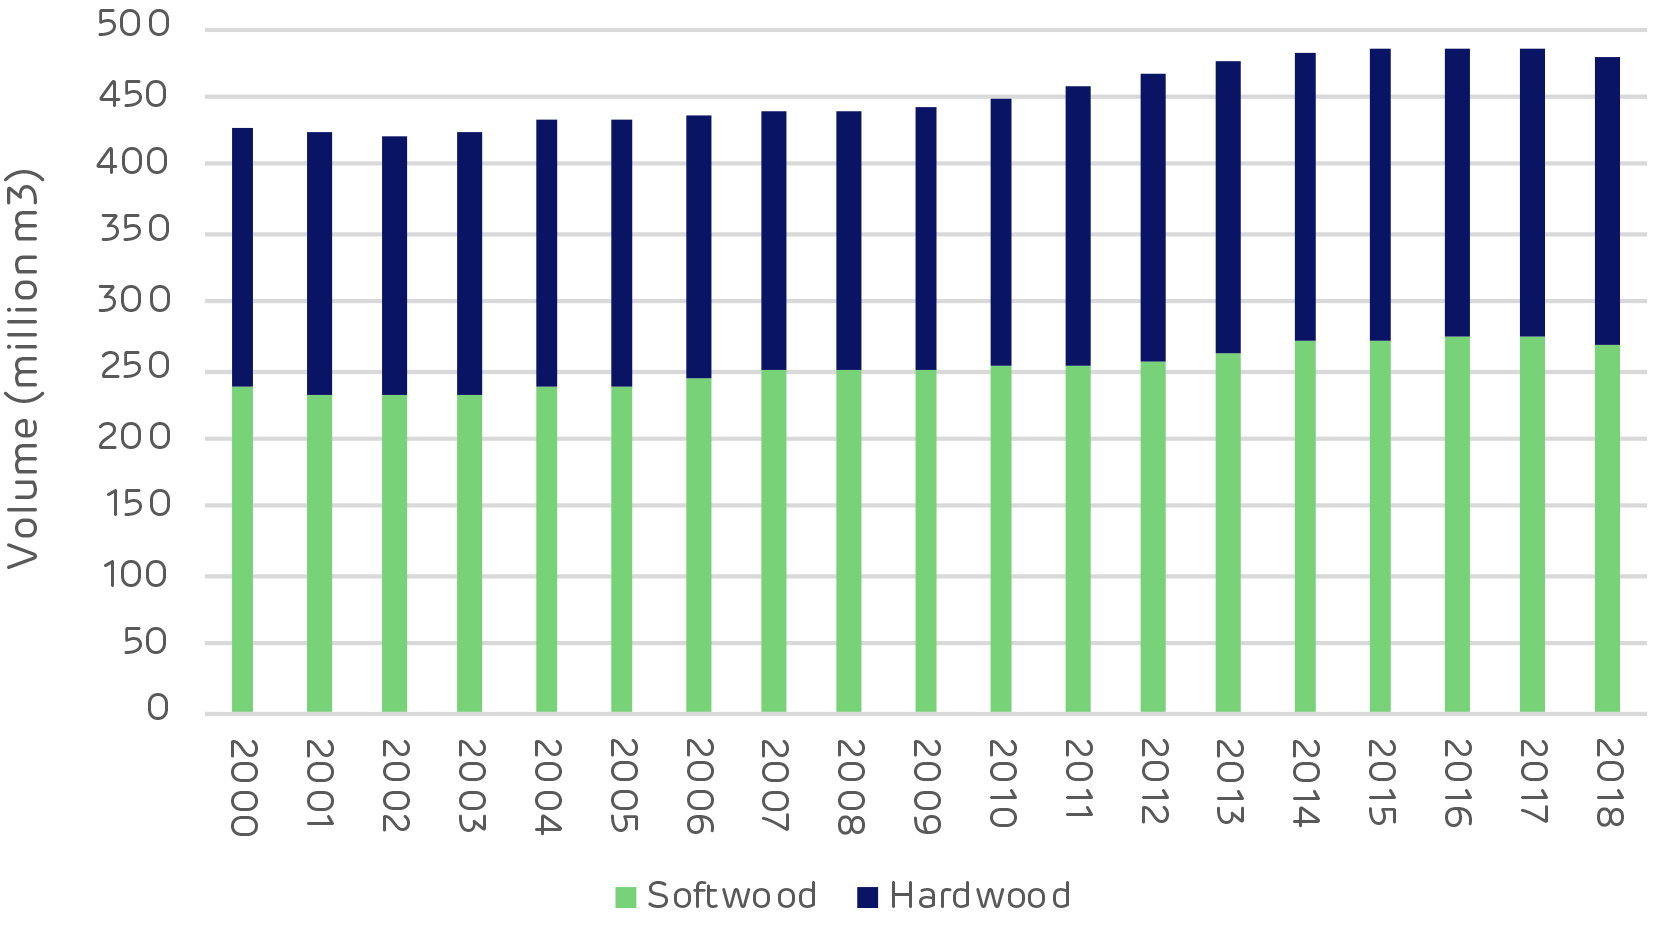
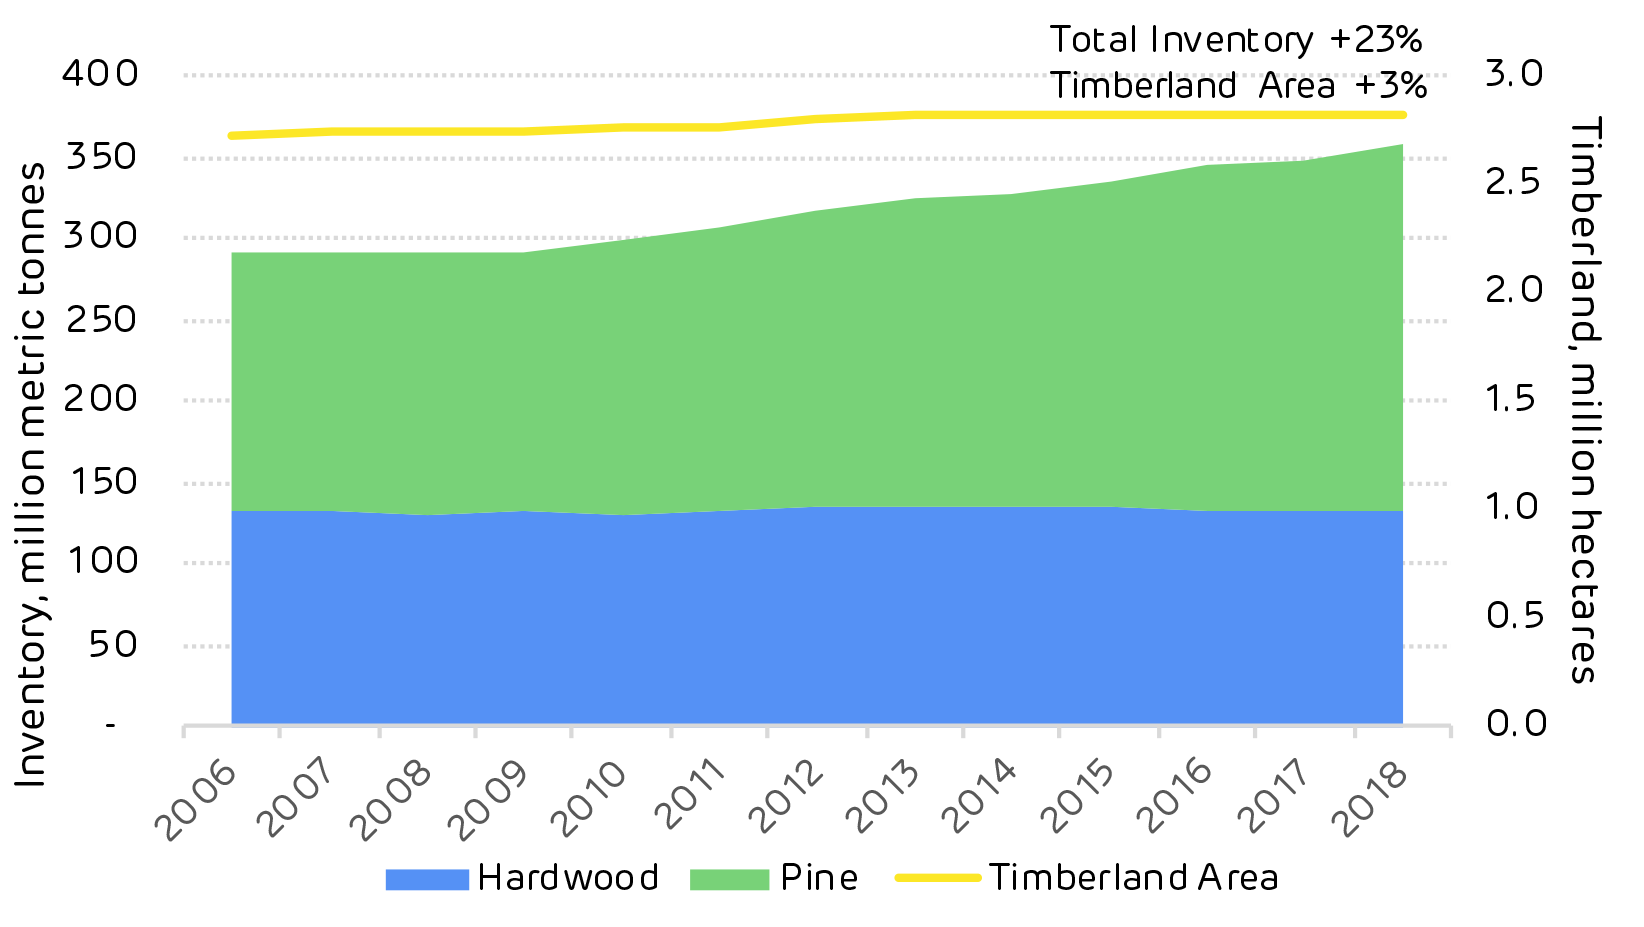
Total volume of growing stock on timberland
Maintaining healthy markets for both high and low-value wood is key to enabling landowners to reforest areas once they have been harvested in the knowledge it will provide a valuable return in the future. Ultimately, however, the way forests are maintained depends on the individual landowners and how they want to use their land.
The advantages of corporate ownership
Morehouse BioEnergy’s catchment area covers 28,000 square kilometres of timberland, within which 96% of the timber is privately owned. While some of that is owned by families with small patches of productive land, 54% is held by corporate owners. This includes businesses such as real estate investment trusts (REITs) and timber investment management organisations (TIMOs), which advise institutional investors on how to manage their forest assets.
This high percentage of corporate ownership influences forest management and replanting, as owners look to maximise the value of forests and seek to continue to generate returns from their land.
“In general, corporate owners are spending more money on silviculture and actively managing their timber stands,” explains Forisk Consulting Partner Amanda Lang. “They are investing more in fertiliser, their seedlings and harvest control on pine stands, because that leads to larger trees of a higher quality and more profit in the long run.” This is reflected in the higher growth rates found in the private sector, leading to faster rates of carbon sequestration.
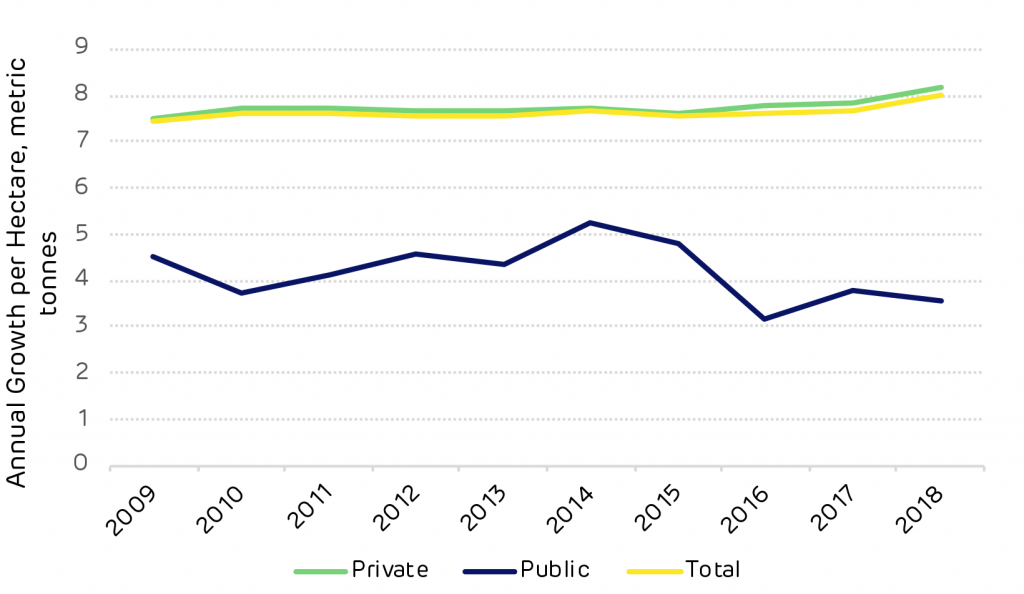
Annual growth per hectare by owner type
Smaller private landowners, meanwhile, may have other objectives for their land like recreation and hunting, in addition to timber income. As a result, some owners may be less inclined to intensively manage their timber stands, forgoing fertilisation and competition control (due to cost) and might harvest on a less regular basis. Although these landowners may not be maximising the productivity of their timber resource to the same degree corporate owners do, their unique management often contribute to greater diversity on the landscape.
Demand and forest health
In 2018 the annual average price for a metric tonne of pine sawtimber in Morehouse BioEnergy’s catchment area was $25.71, down from a 10-year high of $31.60 in 2010. Similarly, pine pulpwood, from which biomass pellets are made, was valued at $7.75 per metric tonne in 2018, down from a 10-year high of $13 in 2010.
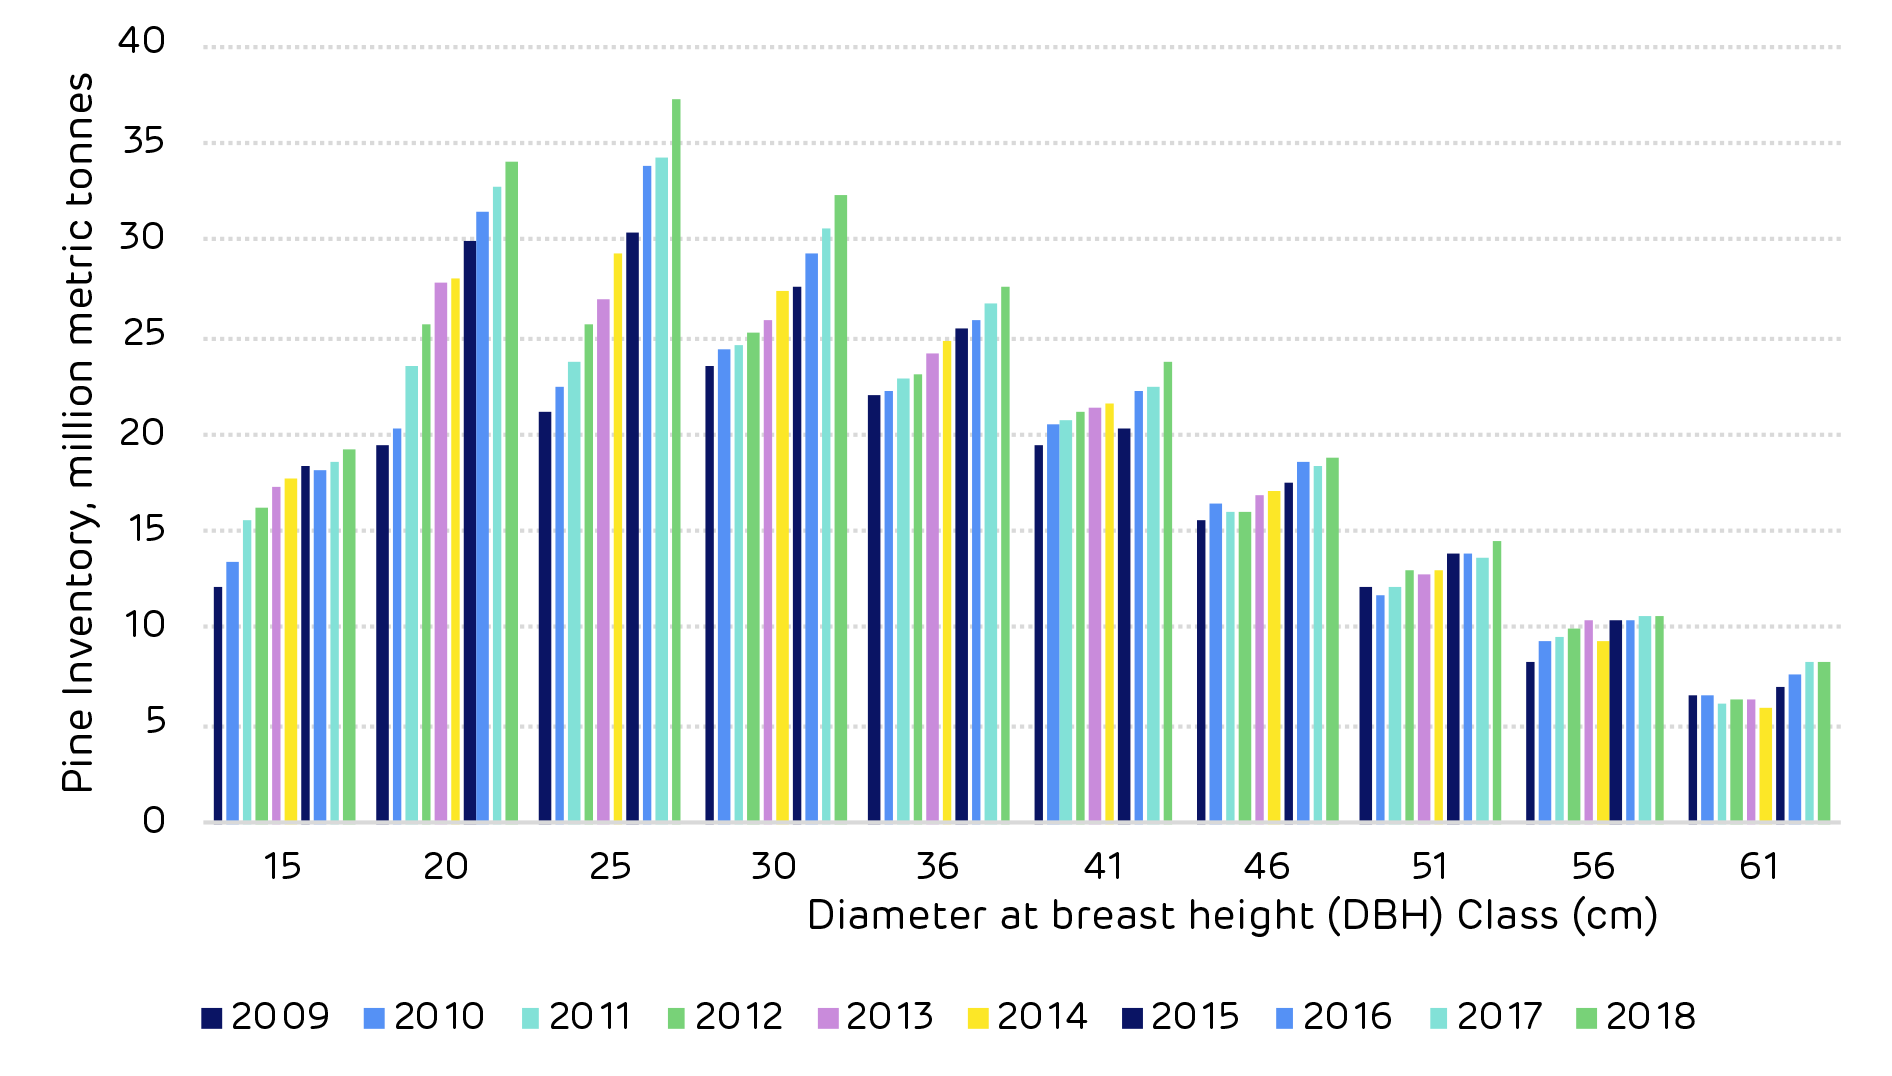
These low wood prices have caused many landowners to delay harvesting forests in hopes for a more lucrative wood price. As a result, pine timber inventories have grown across Morehouse BioEnergy’s catchment area. In 2010 the US Forest Service counted more than 167 million metric tonnes of pine inventory. By 2018 this had increased by more than 35% to reach 226 million.
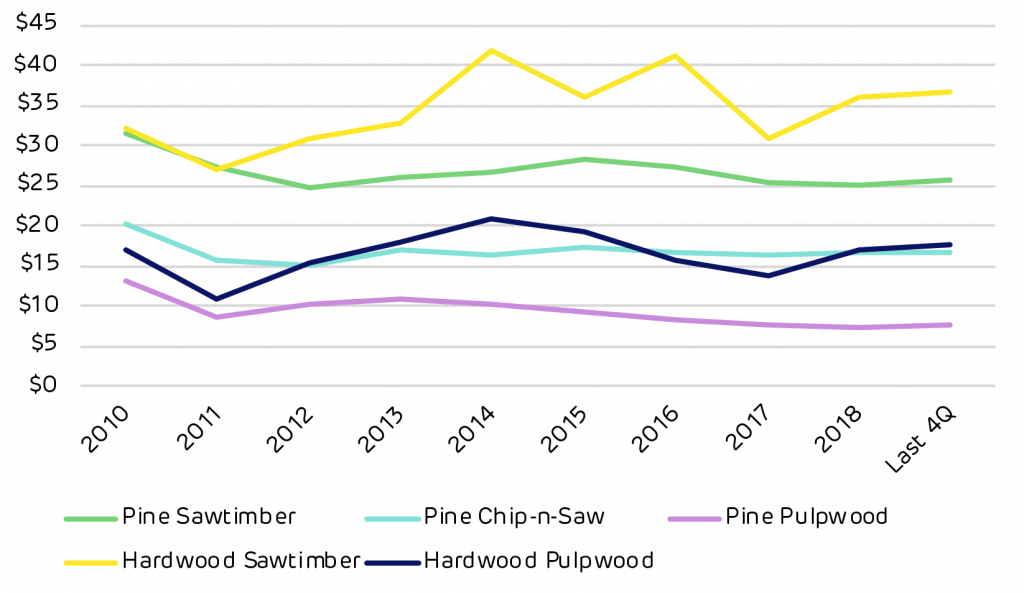
Morehouse BioEnergy market historic stumpage prices, $/metric tonne
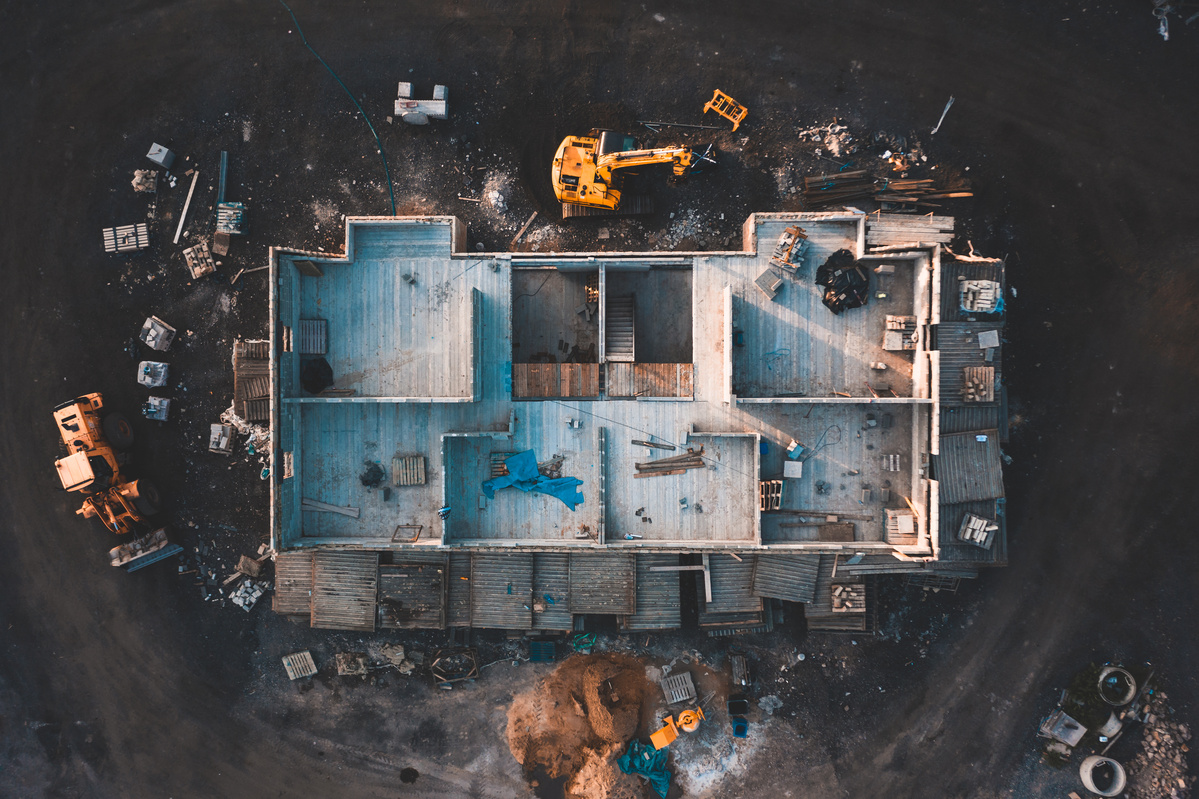
The report suggests this price slump is an ongoing result of the 2008 recession, which greatly affected US house construction – one of the primary uses of sawtimber and many other types of wood products in the US. Some areas have already seen sawtimber prices increase as they recover from the recession, however, the report suggests this is not spread evenly on a national level.
The inventory overhang in Morehouse BioEnergy’s catchment area is expected to begin reversing in 2024 or 2025, as Lang explains: “We expect inventories to increase for a few more years and then start to decline. That said, inventories will remain higher than pre-recession levels.”
While high inventories suggest an abundant resource, lower inventory volumes are not indicative of declining or unhealthy forests. Rather, they can point to younger, growing forests that have recently been replanted, which will later grow to higher inventory volumes as they mature. Both suggest a healthy forestry industry in which landowners continue to reinvest in forests.
Overall, the analysis of the region points to healthy, growing forests and, importantly, a sustainable industry from which Drax can responsibly source biomass pellets. Ensuring the biomass used at Drax Power Station is sustainably sourced is crucial to its generation of renewable, carbon-neutral electricity, and in turn laying the path to negative emissions.
Read the full report: Morehouse, Louisiana Catchment Area Analysis. A short summary of its analysis and conclusions, written by our forestry team, can be read here. Explore every delivery of wood to Morehouse BioEnergy using our ForestScope data transparency tool.


![Reforestation in Estonia. * Note: Since 2014 it has not been compulsory for private and other forest owners to submit reforestation data. [Click to view/download]](https://www.drax.com/wp-content/uploads/2020/03/figure_3.13.png)
![Species mix in Estonian forests [Click to view/download]](https://www.drax.com/wp-content/uploads/2020/03/figure_3.3.png)
![Comparison of sawlog and pulpwood prices [click to view/download]](https://www.drax.com/wp-content/uploads/2020/03/Picture-1.pdf2_-1.png)


