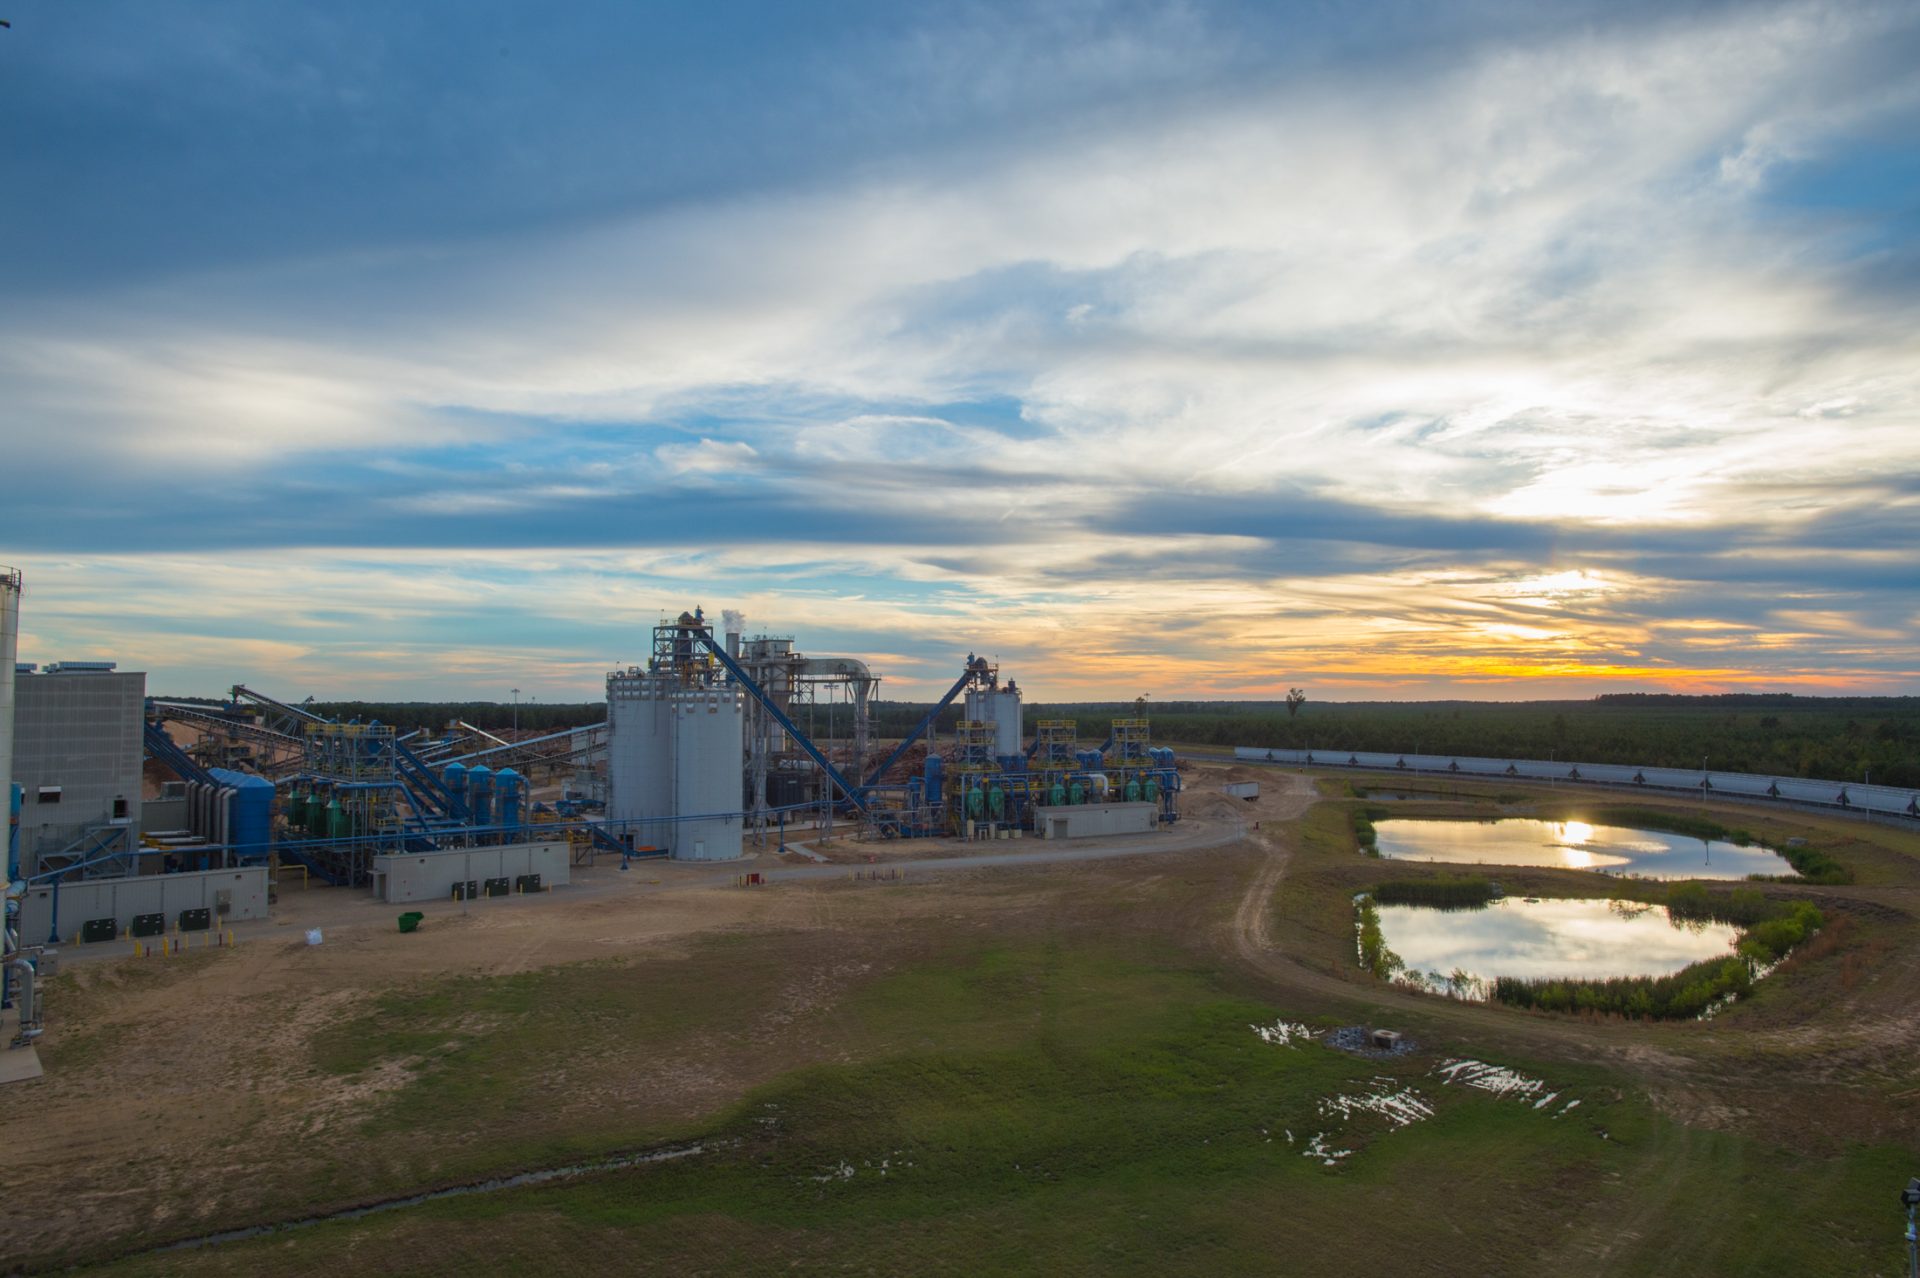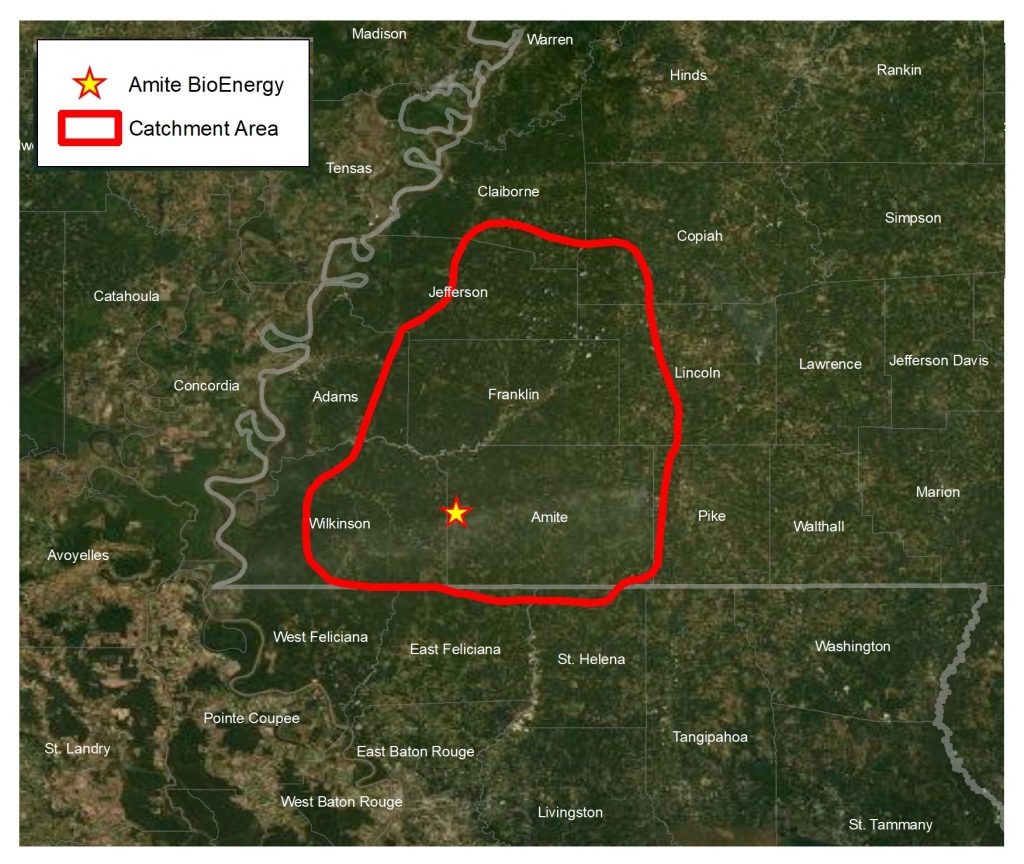


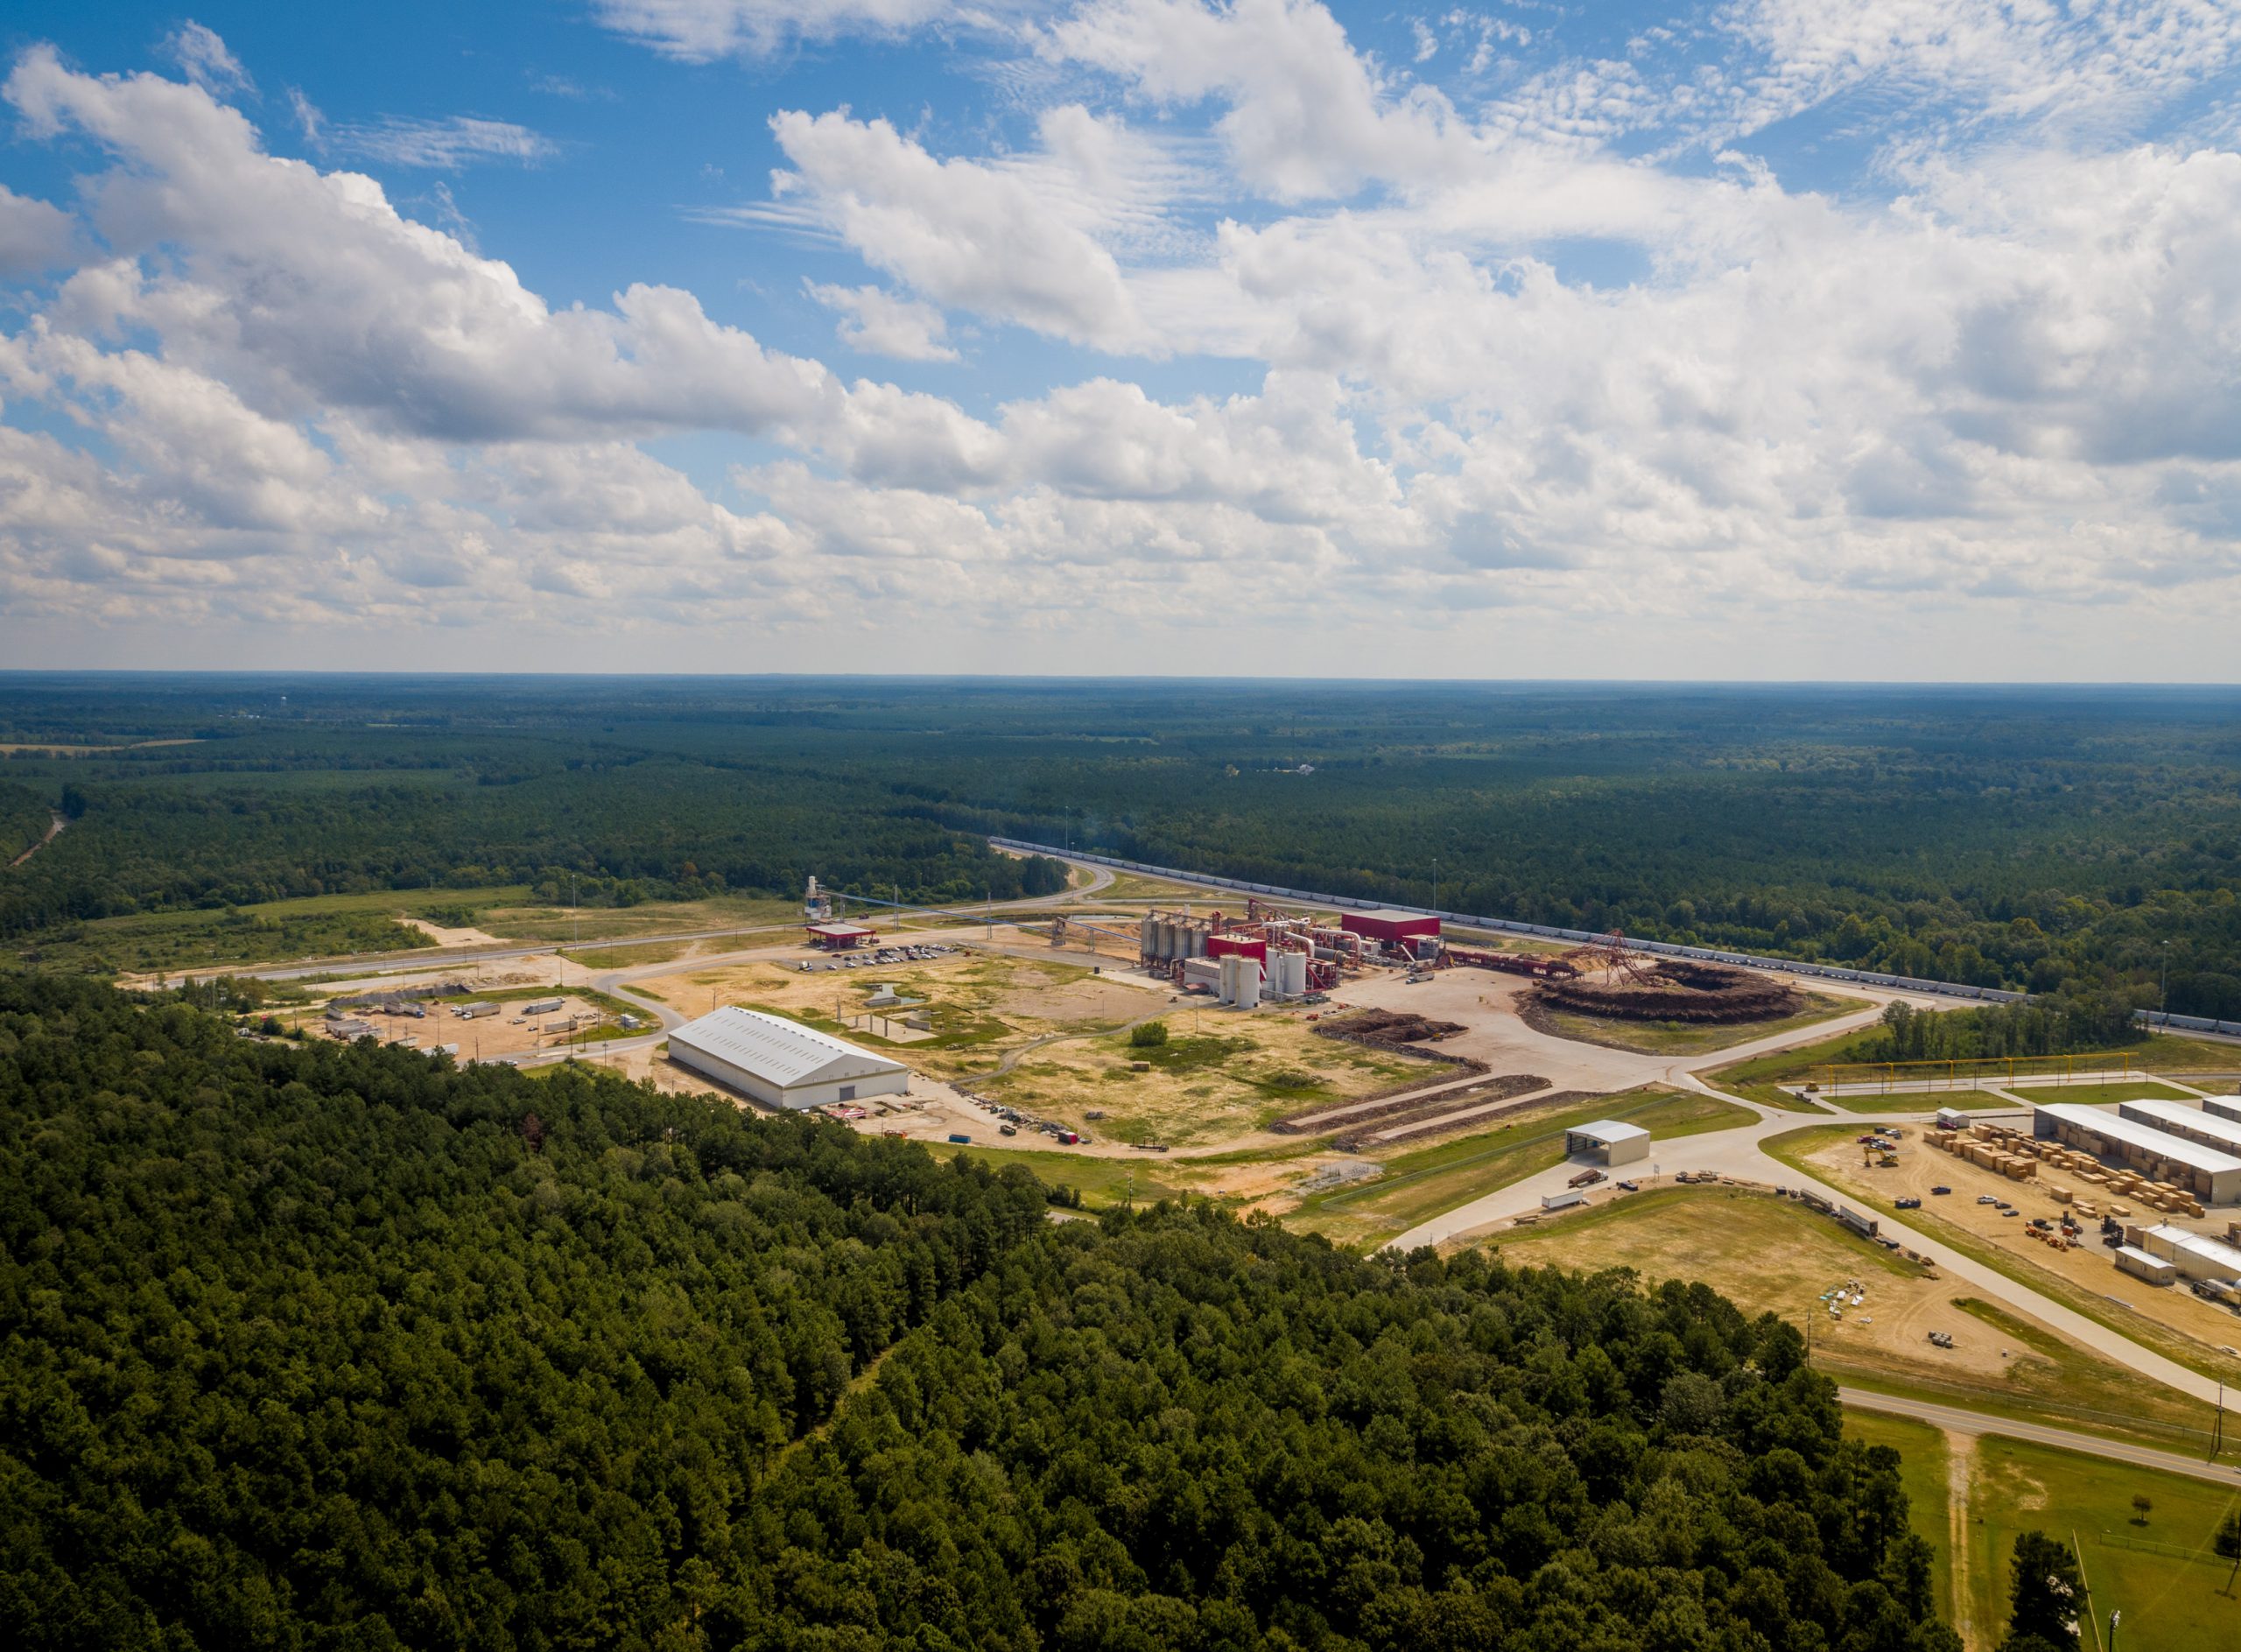
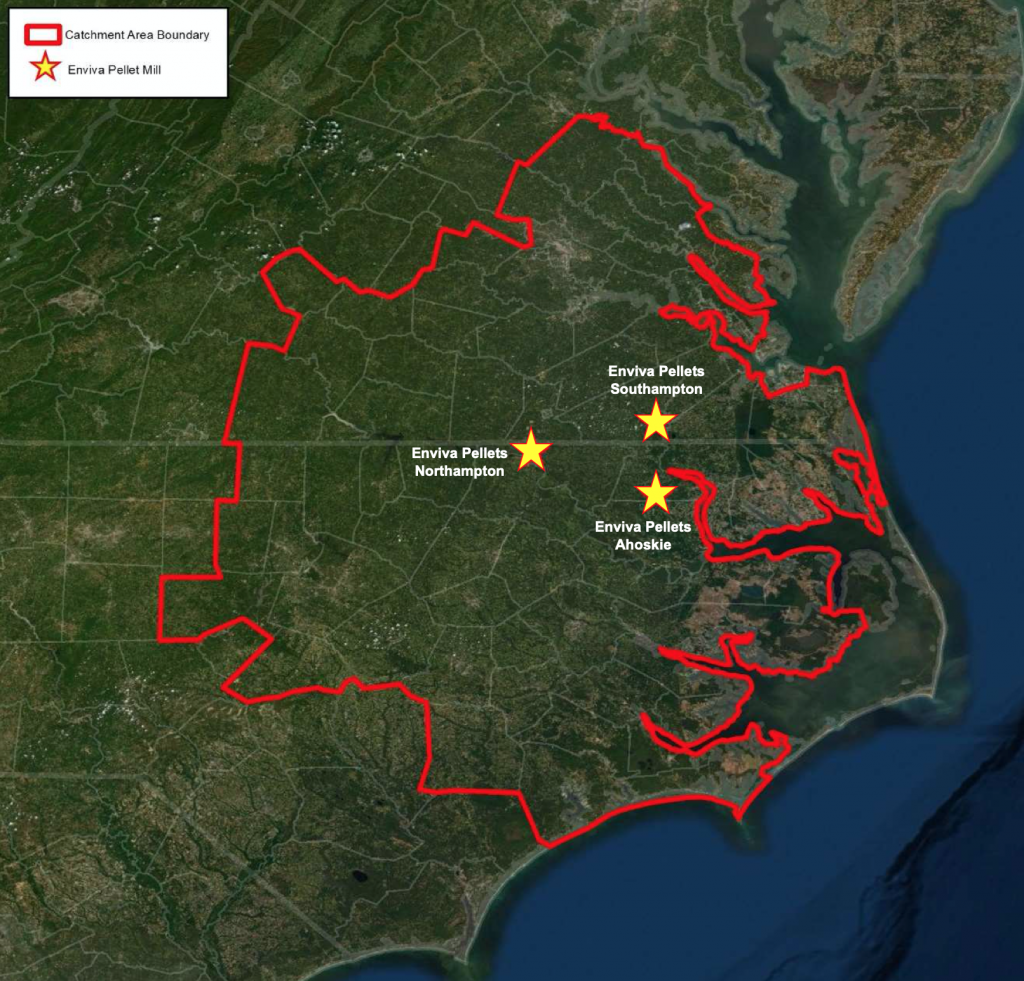
The seventh report in a series of catchment area analyses for Drax looks at the fibre sourcing area surrounding a number of compressed wood pellet plants operated by Georgia Biomass (now owned by Enviva) and Fram Renewable Fuels.
The evidence found in the report by Hood Consulting shows a substantial increase in forest inventory (stored carbon) and a relatively stable forest area. However, with continued pressure from urban development, future losses of timberland area are possible. Despite this, increasing growth rates can maintain and improve wood supply and carbon stock for the foreseeable future.
Increasing forest growing stock and carbon sequestration
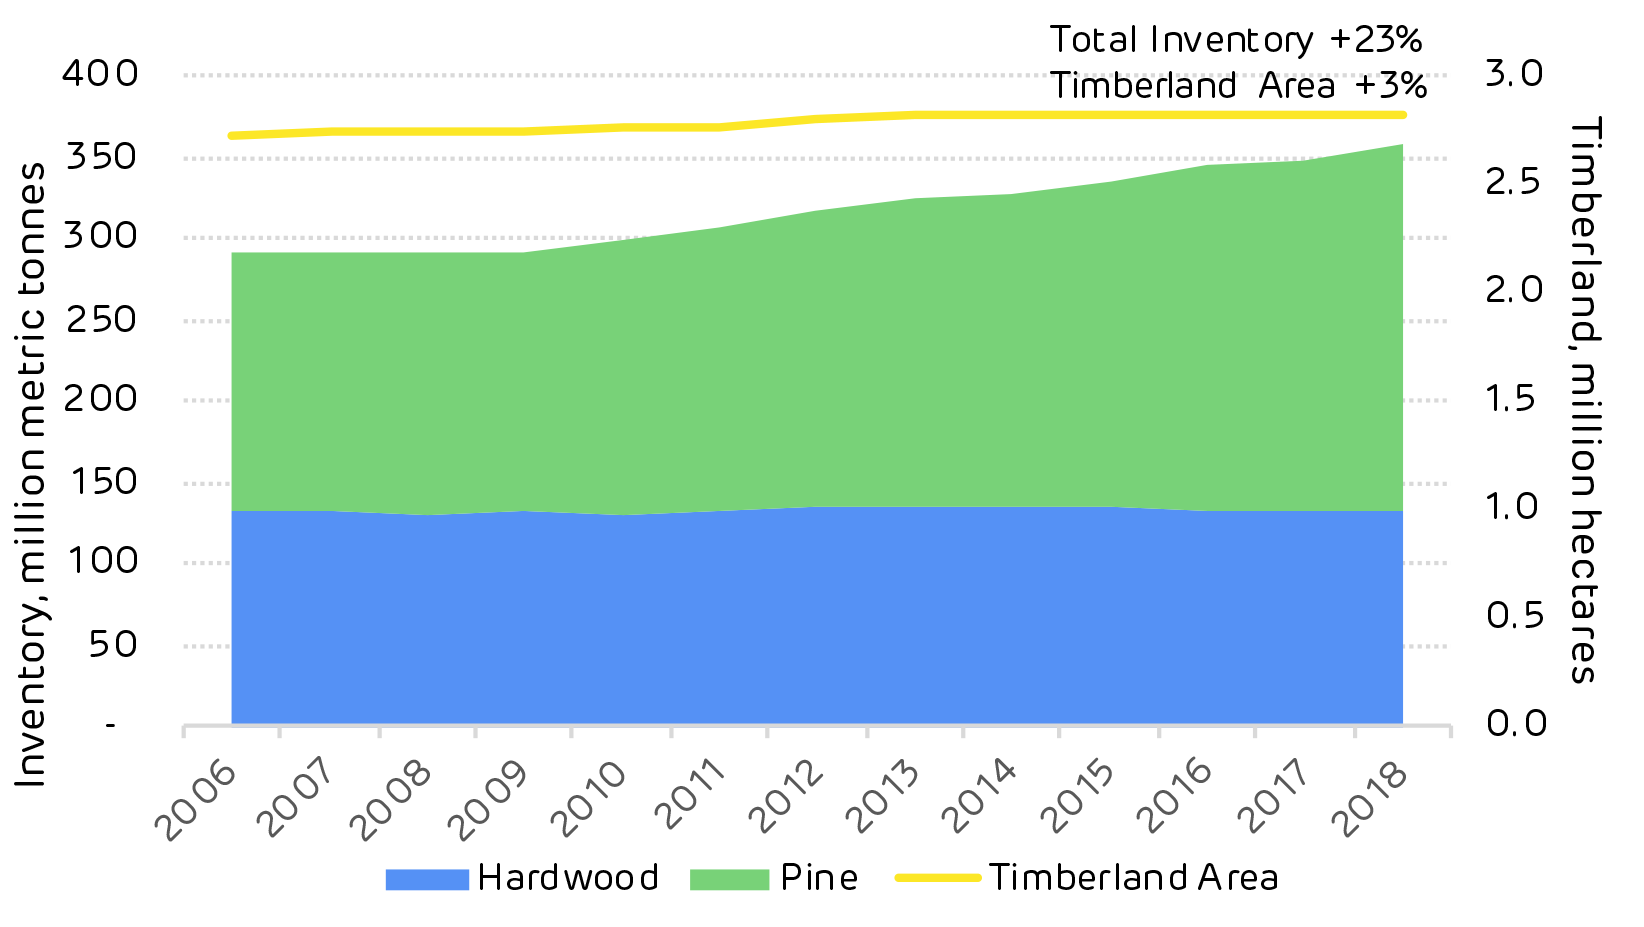
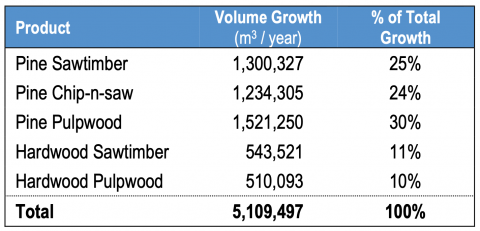
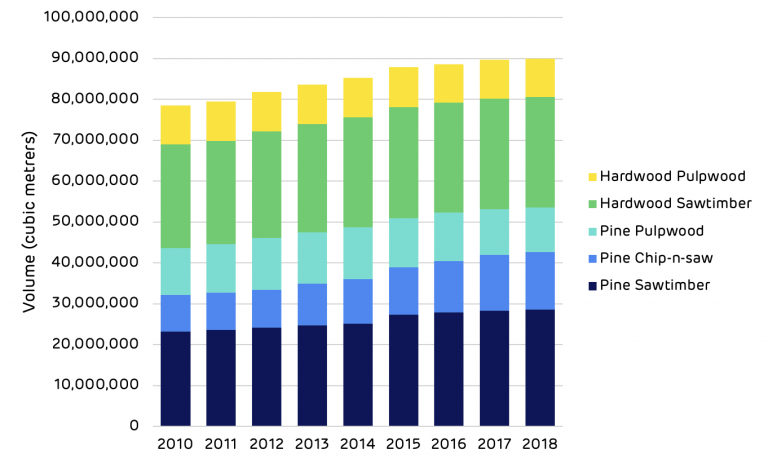
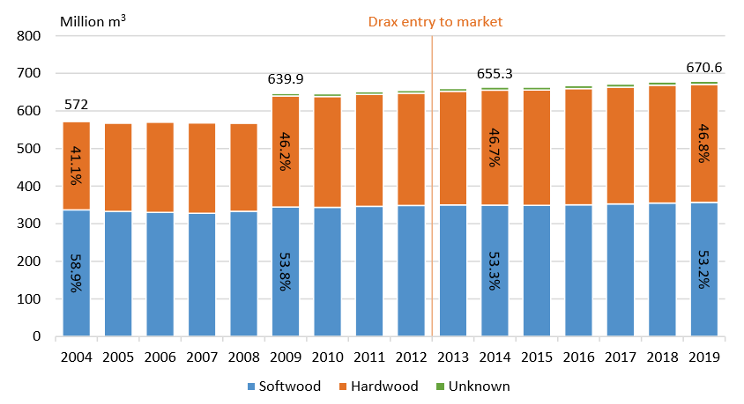
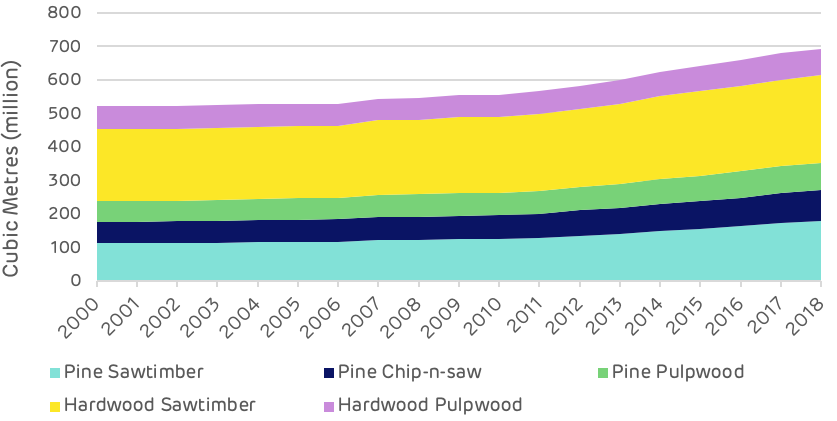
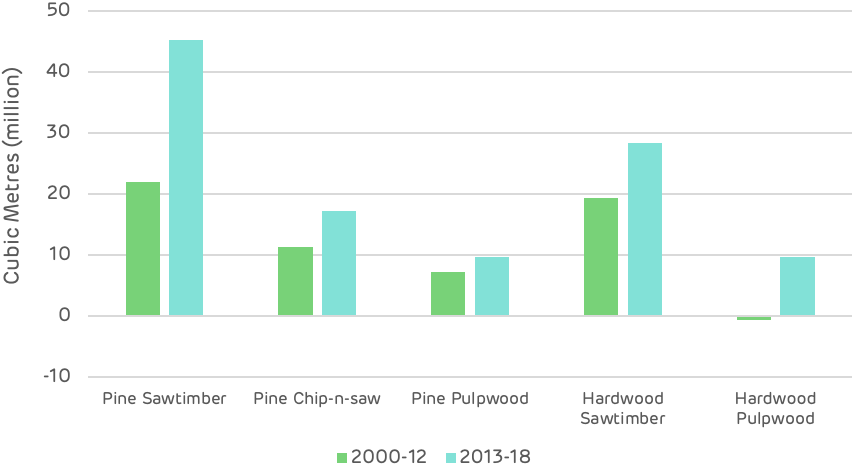
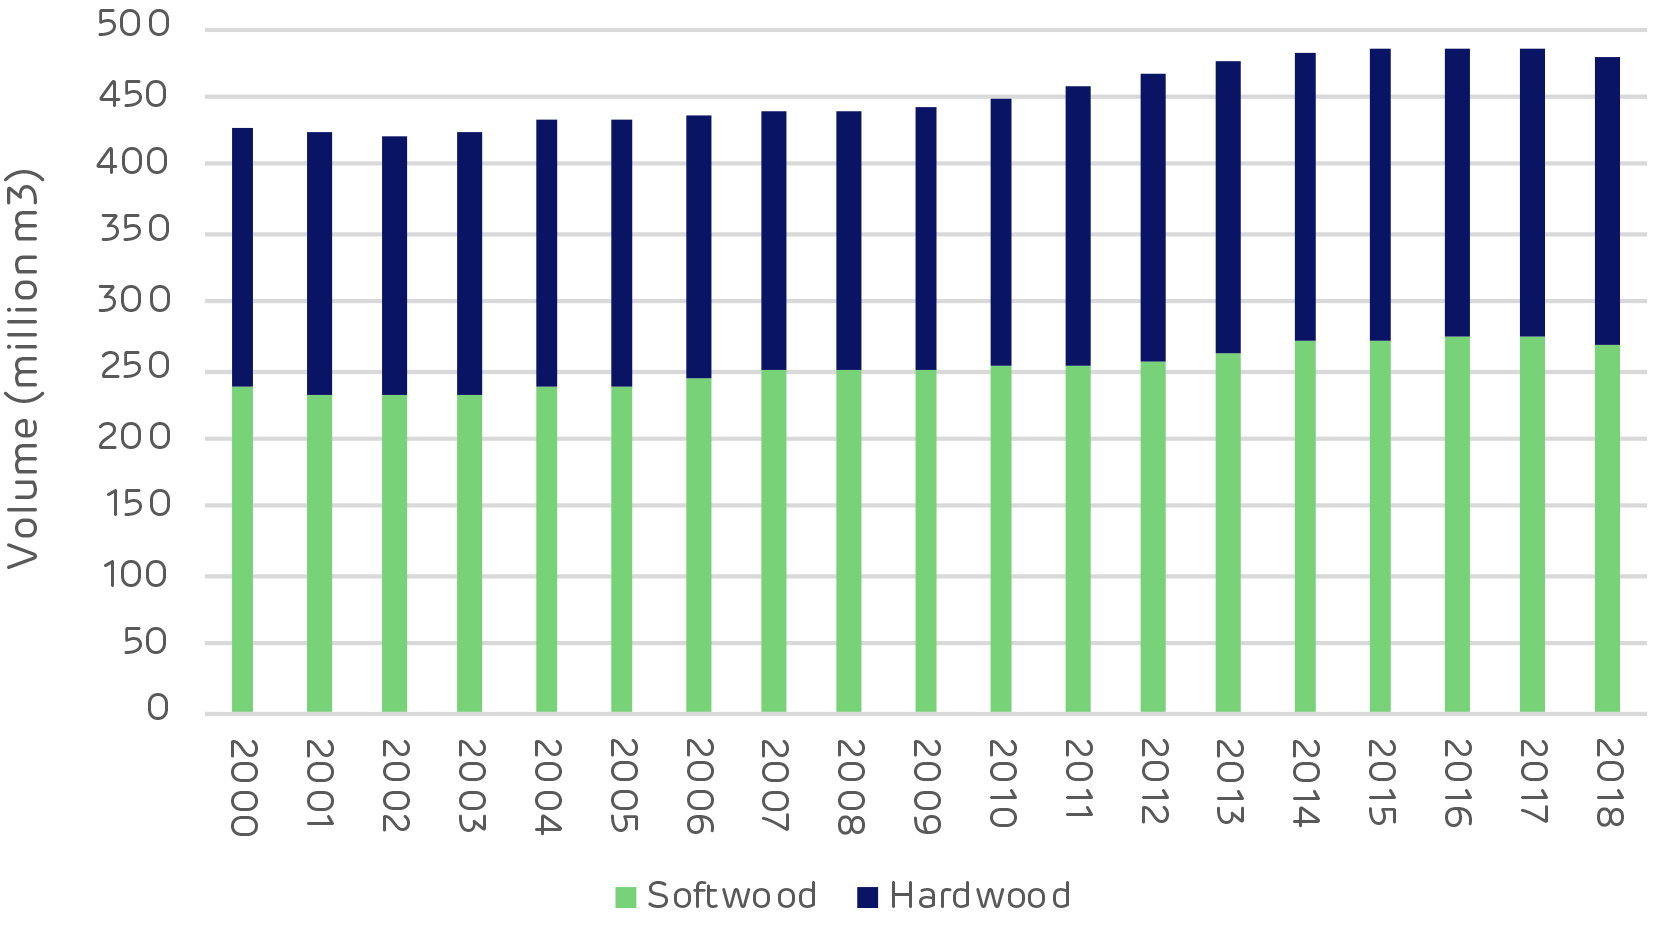
The overall inventory of growing stock in the catchment area has increased by 63 million cubic metres (m3) between 2000 and 2018, a growth of 19.3%. All of this increase has been in the pine area, which increased by nearly 68 million m3, whereas the hardwood species decreased in volume by 4.5 million m3. Overall, the inventory volume split by species in 2018 was 72% to 28% softwood to hardwood. The breakdown by product category is shown in Figure 3 below.
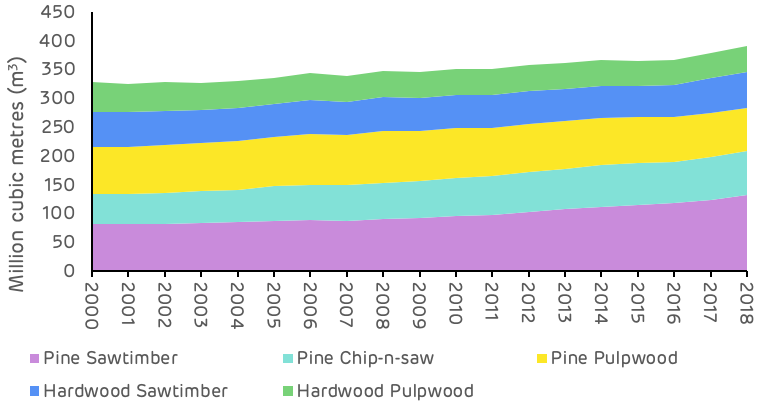
Figure 1: Change in growing stock by major product category and species (USFS)
The pine saw-timber and chip-n-saw product categories, larger dimension and higher value material, showed the largest increase in inventory, whereas pine pulpwood decreased in total volume. The most substantial change occurred from 2010 to 2018, where pulpwood went from an increasing trend to a decreasing trend and saw-timber increased in volume much more rapidly – this is shown in Table 1 and Figure 2 below.
| Change (cubic metres (m3)) | Pine Sawtimber | Pine Chip-n-saw | Pine Pulpwood | Hardwood Sawtimber | Hardwood Pulpwood | Total |
|---|---|---|---|---|---|---|
| 2000-2018 | 51,301,628 | 22,277,139 | -5,835,230 | 1,211,110 | -5,657,114 | 63,297,533 |
| 2000-2010 | 14,722,995 | 12,707,674 | 5,262,192 | -3,740,507 | -5,769899 | 23,182,455 |
| 2010-2018 | 36,578,632 | 9,569,465 | -11,097,422 | 4,951,618 | 112,784 | 40,115078 |
These changes are likely to reflect an increasing age class in the catchment area, with younger stands of pine (previously classed as pulpwood), growing into a larger size class and being reclassified as saw-timber. This means that the volume of saw-timber availability in future will be significantly higher, but pulpwood availability will be diminished. For pellet mill markets any loss in pulpwood availability can be compensated by an increase in sawmill residue production if market demand is maintained or increased.
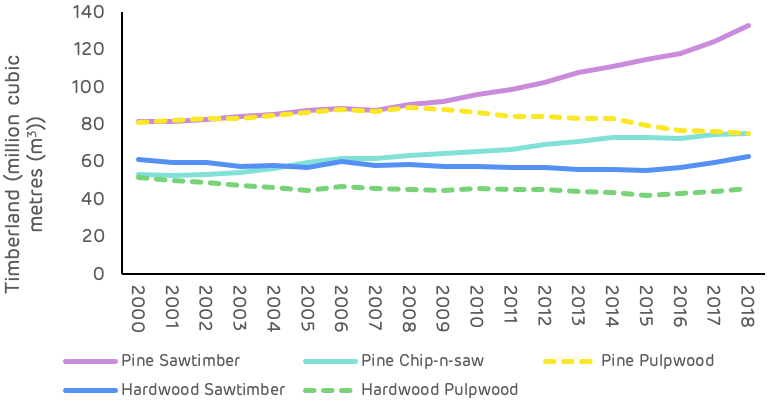
Figure 2: Change in growing stock by major product category and species (USFS)
Growth rates for both softwood and hardwood species have been increasing since 2000 as shown in Figure 3 below. Softwood growth has increased by 18.5% since 2000 and hardwood by 1.4%. The improved softwood growth rate probably resulted from increased investment in the management of pine forests, the superior quality of seedlings and better management practice (ground preparation, weed control, fertilisation etc.). This is a very positive trend for the sequestration rate of carbon and also for providing landowners with the potential to increase revenue per hectare and encourage the retention and improved management of forests, rather than converting to other land uses. The Georgia catchment area is likely split between passive owners that do not actively manage, where growth rates are slower or decline and the incentive to convert land is greater, and owners that actively manage to improve growth and quality, increasing revenue and maintaining productive forest. There is likely to be a much greater differential in growth rate between these two management approaches than reflected by the trend in Figure 3, highlighting the importance of active management for carbon abatement.
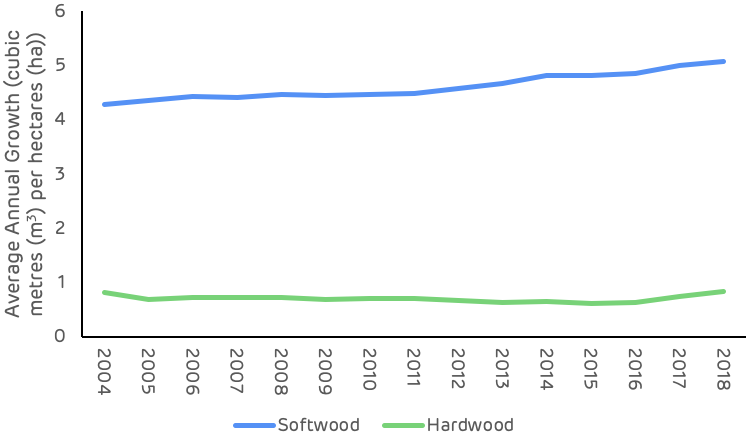
Figure 3: Average annual growth rate per hectare (USFS)
Stable forest area
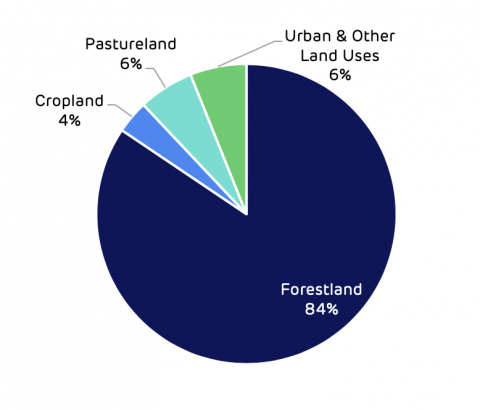
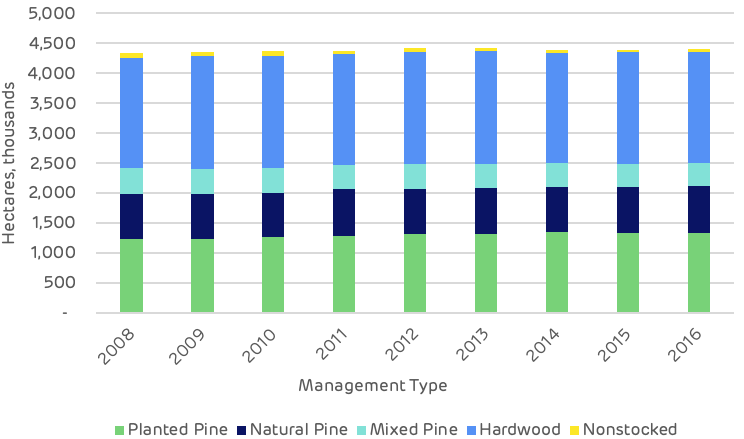
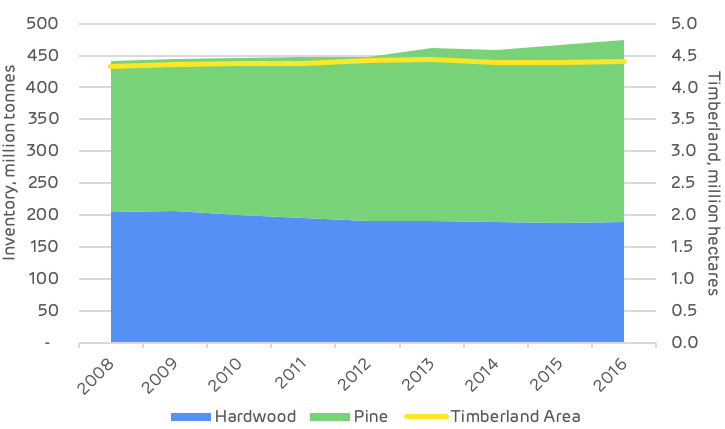
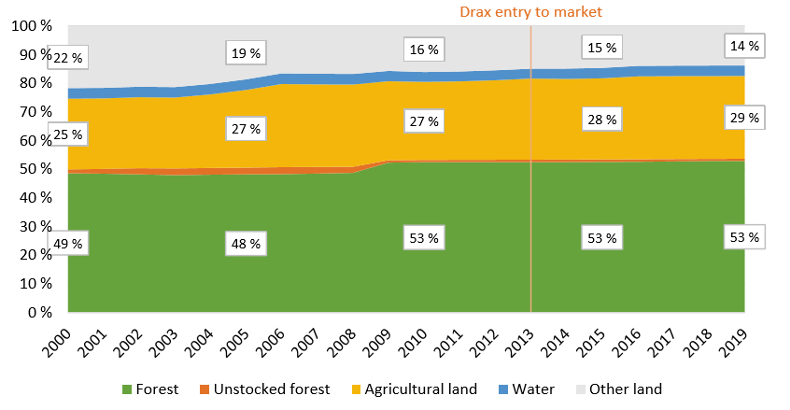
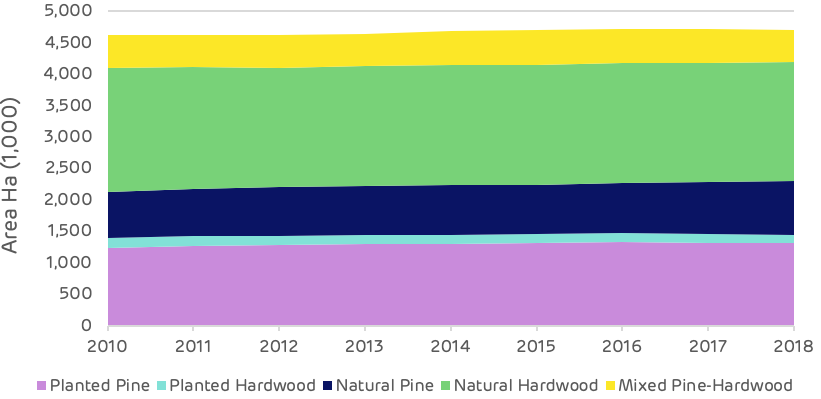
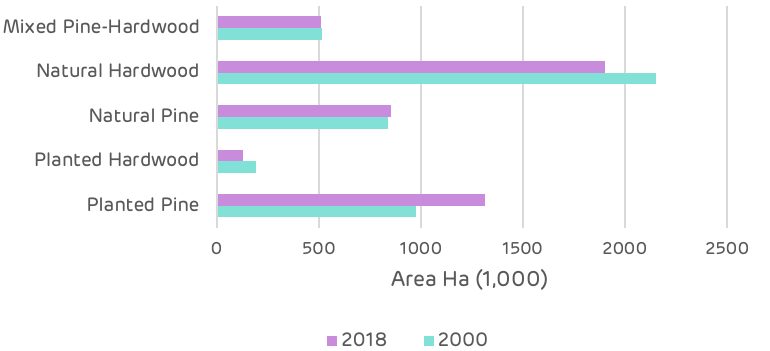
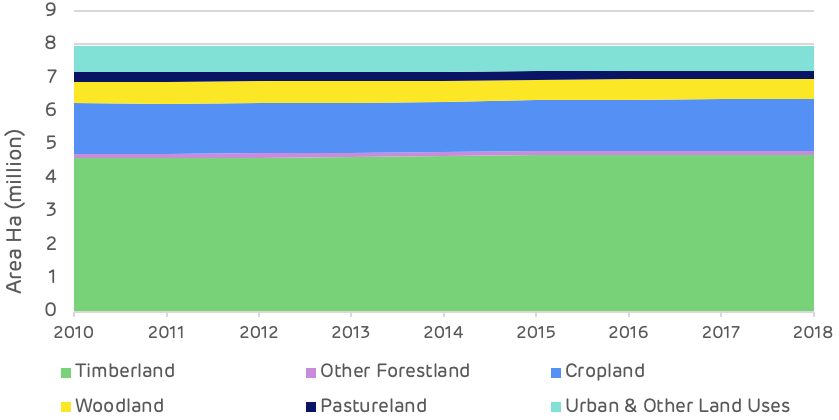
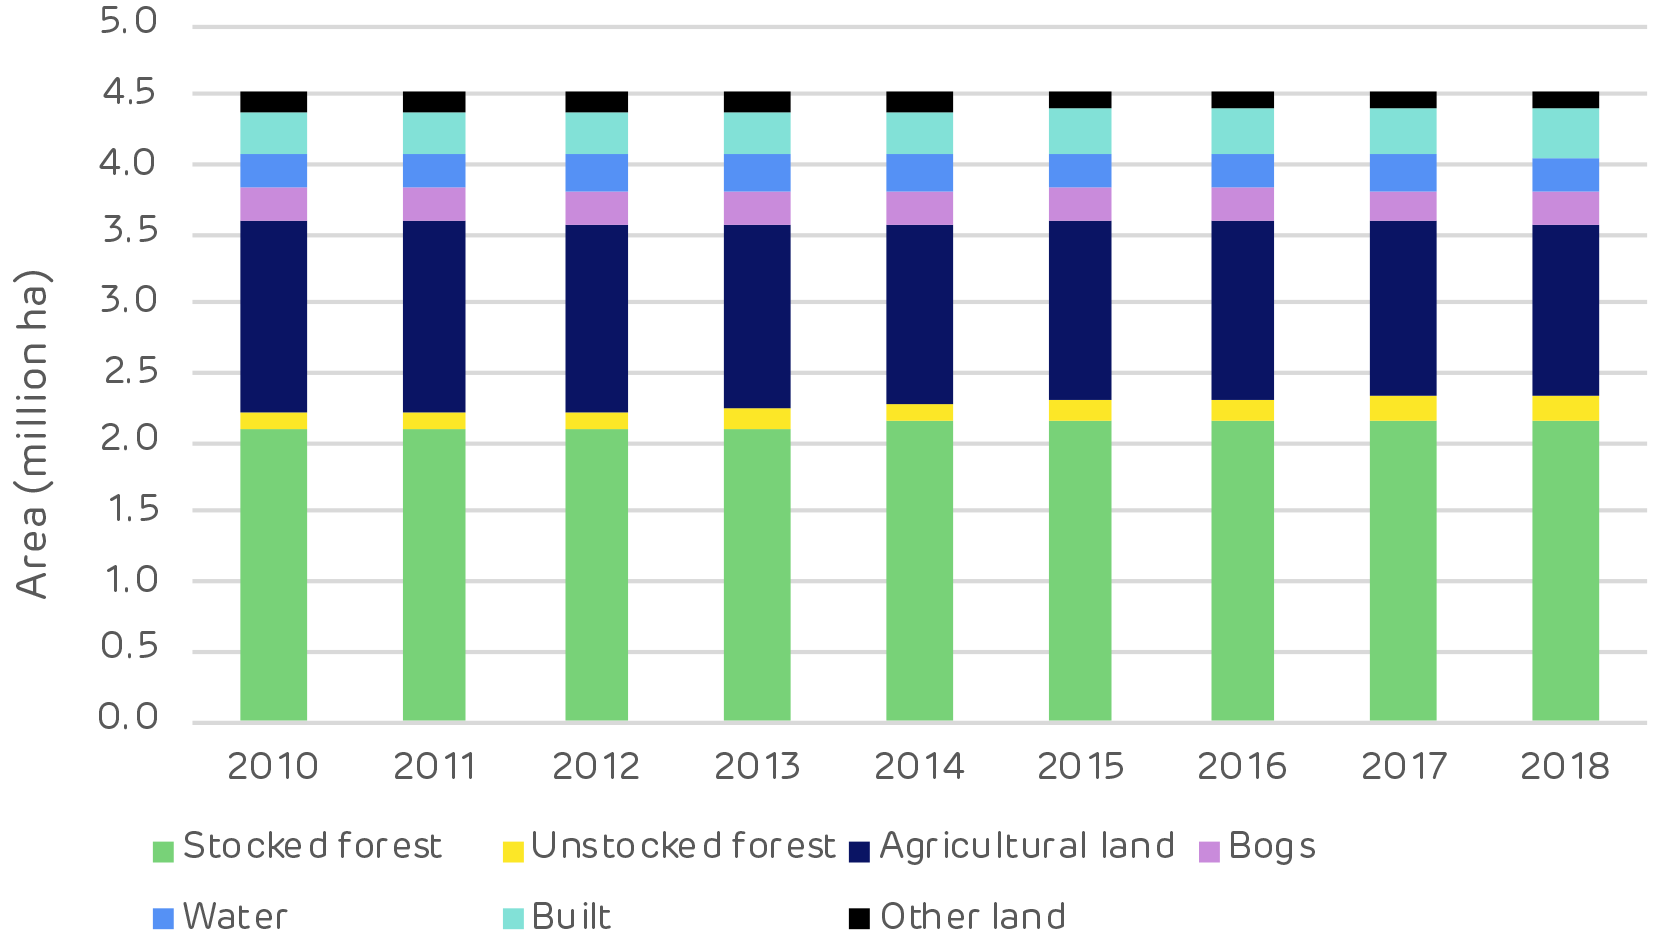
At a macro scale, the distribution of land use categories has remained relatively stable since 2000, with no apparent major shifts in land use. The timberland area around the seven mills has decreased by around 135 thousand hectares (ha) between 2000 and 2018 (2.3% of the total land area), whilst the area of arable and urban land increased by 98 thousand (1.7% of total area) and 158 thousand (2.7% of total area) ha respectively. In 2018, timberland represented 67% of total land area and all forest and woodland 80% of total area, down from 69% and 82% respectively in 2000 (Figure 1).
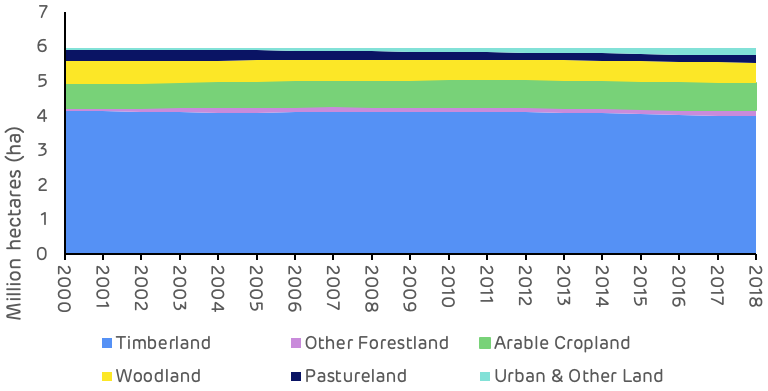
Figure 4: Change in land use category (USDA)
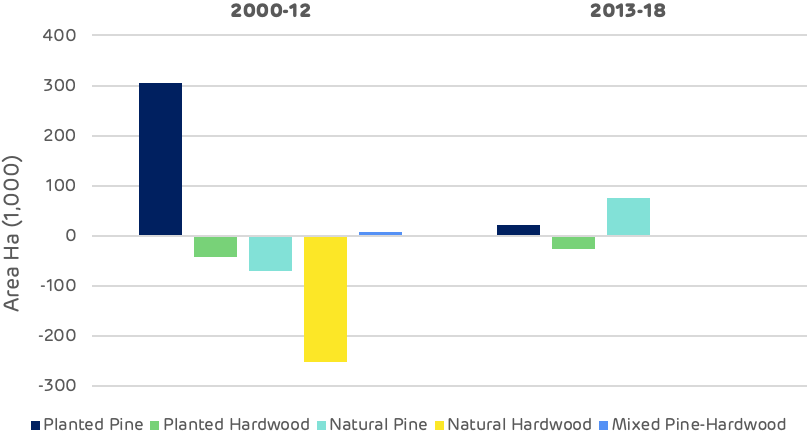
Looking at this change in land use more closely, the timberland area shows the most pronounced decline between 2010 and 2018, a drop of 117 thousand ha. The largest change in other land use categories over this period was an increase of 97 thousand ha in urban and other land, suggesting that a large proportion of the timberland area has been converted to urban areas.
The most significant change in agricultural land occurred prior to 2010, when the timberland area remained relatively stable, this change appears to have involved the transition of pastureland to arable crops. There may also have been some reclassification of forest and woodland types, with a decrease in the area of woodland and an increase in forestland during the period between 2000 and 2010 (Table 2).
| Change (hectares (ha)) | Timberland | Other Forestland | Arable Cropland | Woodland | Pastureland | Urban & Other Land |
|---|---|---|---|---|---|---|
| 2000-2018 | -135,195 | 70,073 | 98,436 | -77,904 | -113,725 | 178,315 |
| 2000-2010 | -18,539 | 53,150 | 73,243 | -73,077 | -95,630 | 60,852 |
| 2010-2018 | -116,656 | 16,922 | 25,193 | -4,827 | -18,096 | 97,463 |
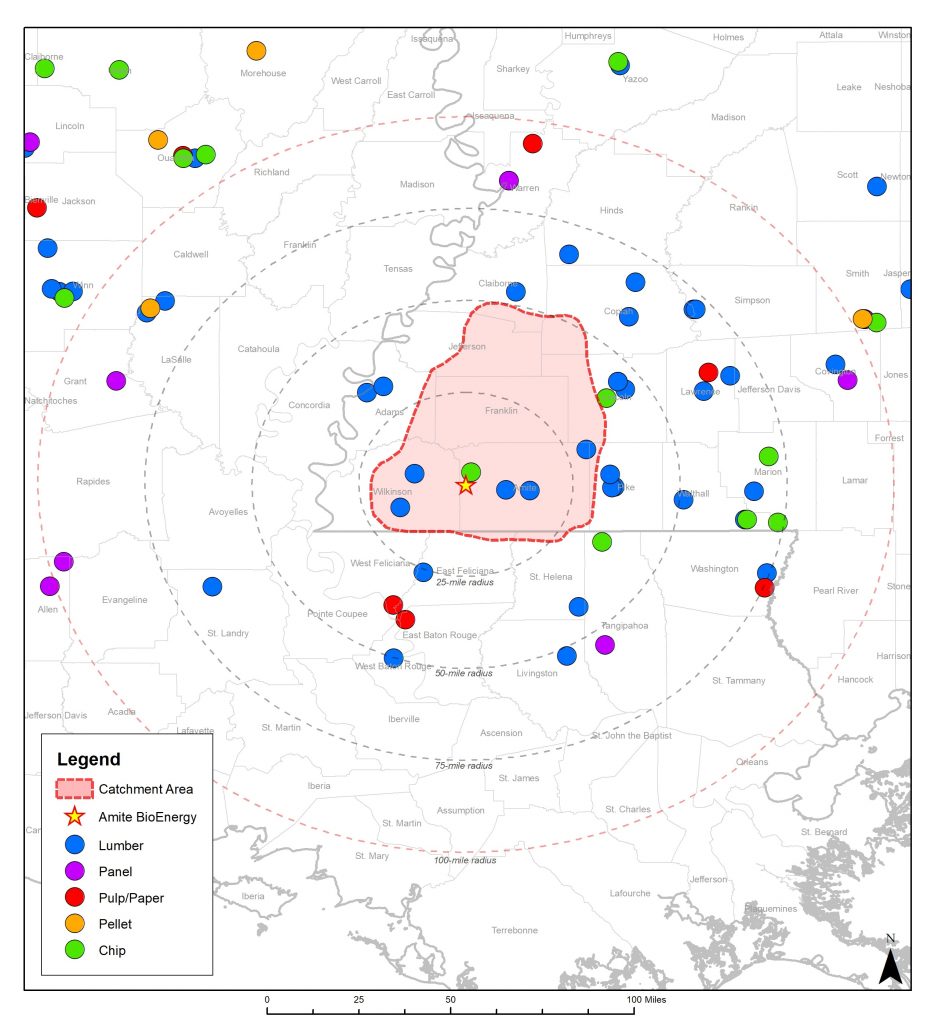
These trends are also clear and apparent in Figure 3 below which shows the sharp decline in timberland area, albeit small in absolute area relative to the total catchment area size, and the steady increase in urban land. Georgia ranks 8th in the list of US States and territories by total population with 10.6 million and 17th by population density at 184 per square mile (mi2) compared to just 63 per mi2 in Mississippi where Drax’s Amite Bioenergy (ABE) pellet plant is located and 108 per mi2 in Louisiana where the Morehouse Bioenergy (MBE) and LaSalle Bioenergy (LBE) mills are located (US Census Bureau). This population pressure and increased development can lead to more forest loss and land use change.
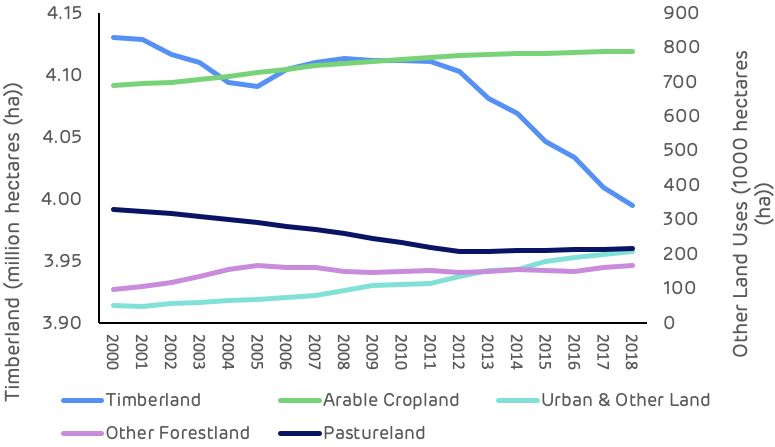
Figure 5: Trends in major land use categories (USDA)
Drax’s suppliers in the Georgia catchment area have made a commitment not to source wood from areas where land use change is taking place. This commitment is monitored and verified through the Sustainable Biomass Program (SBP) certification process that is maintained by each mill. Any land use change in the catchment area is likely to be a result of prevailing economic drivers in the region rather than due to actions being taken by the pellet producers.
Increasing demand and surplus forest growth
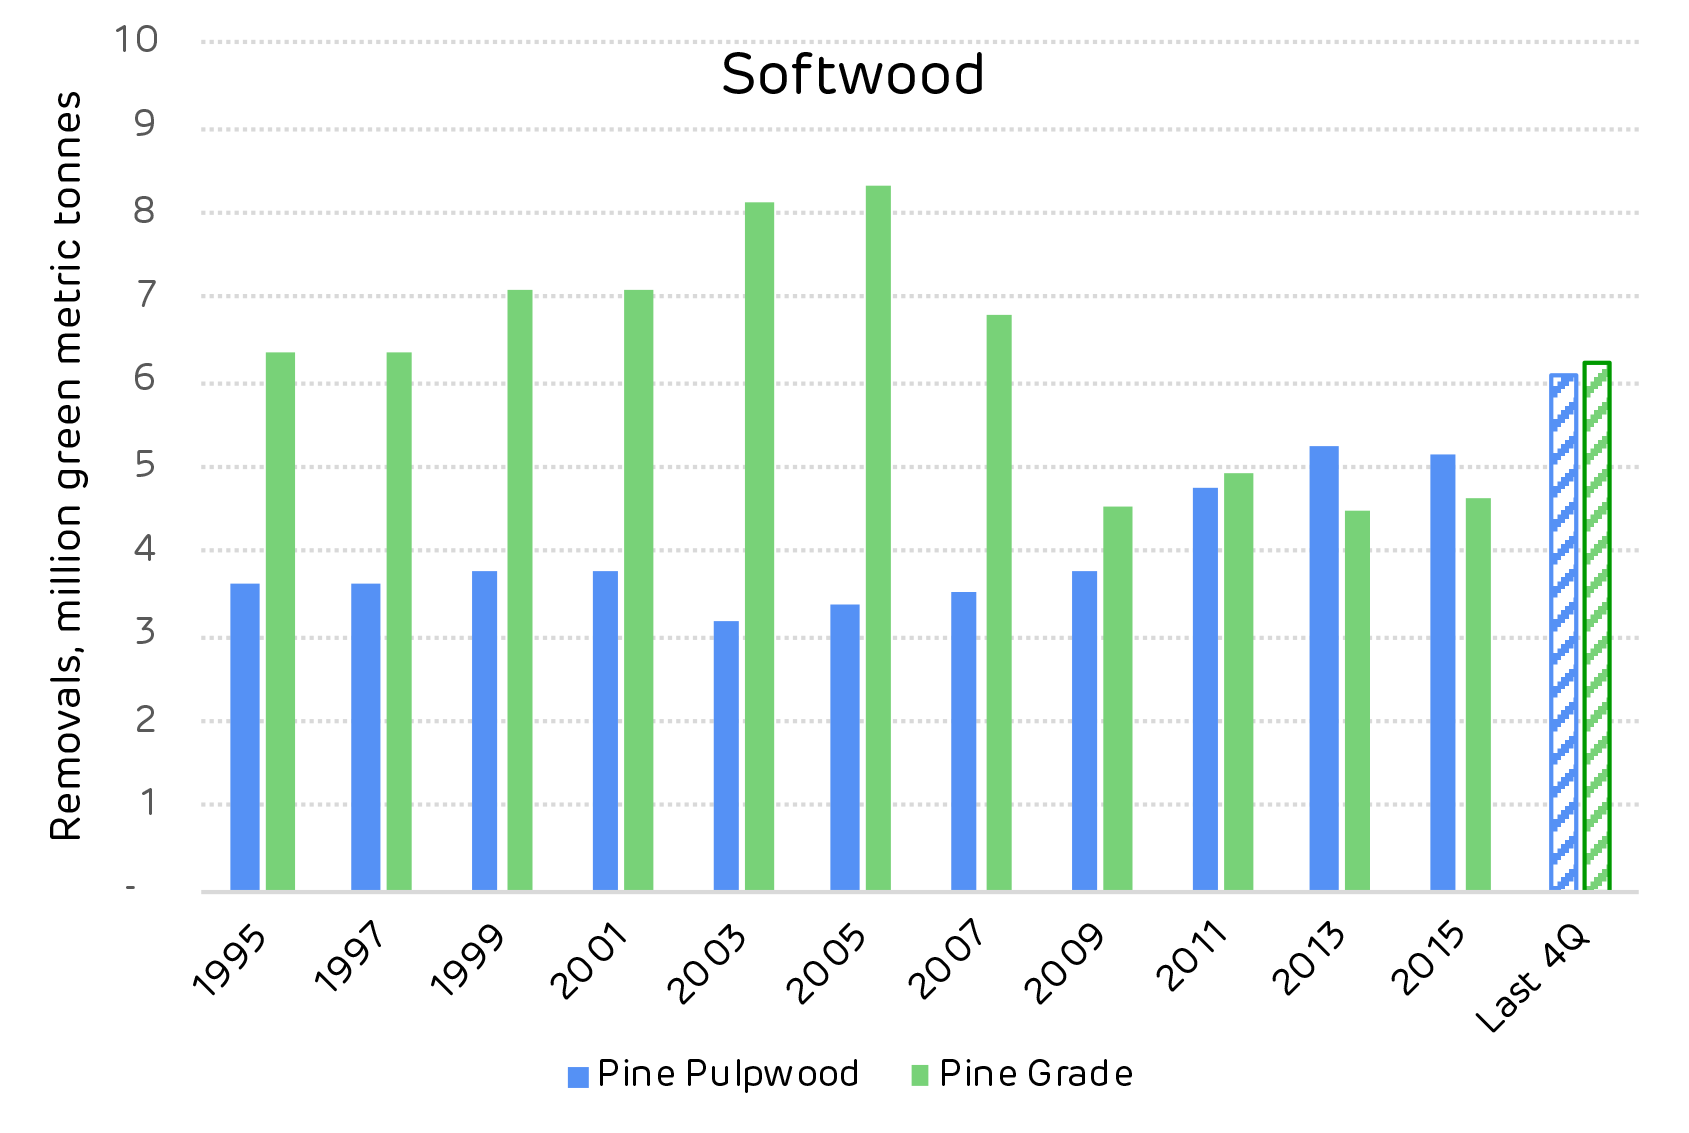
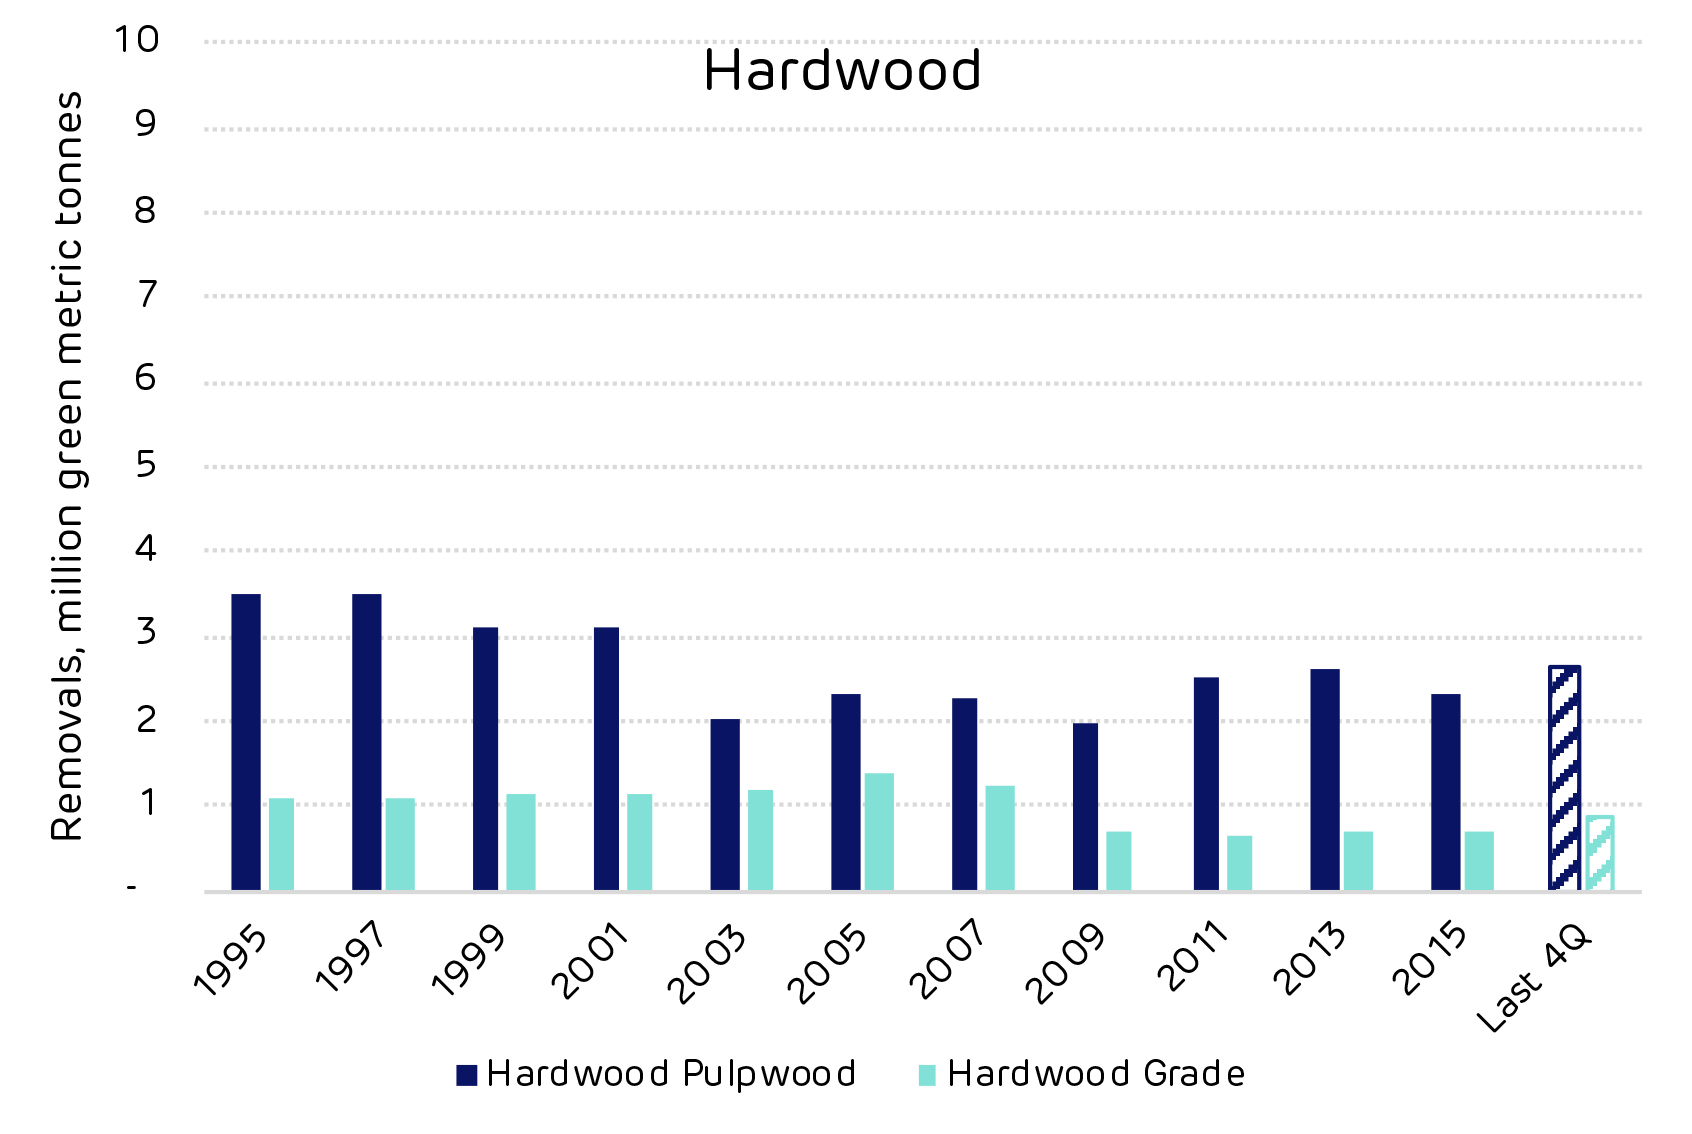
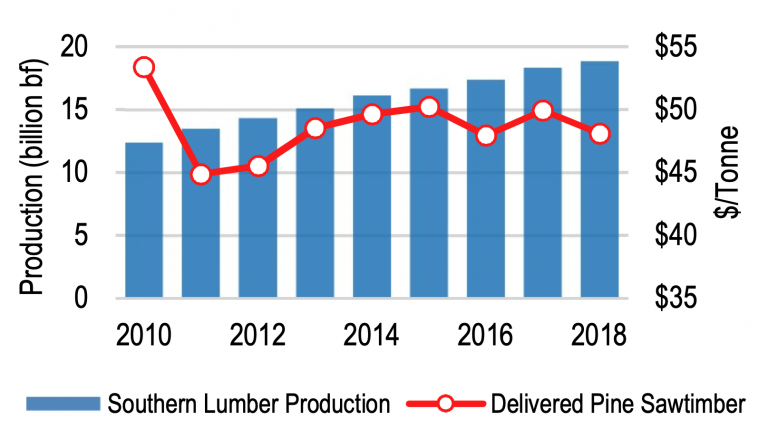
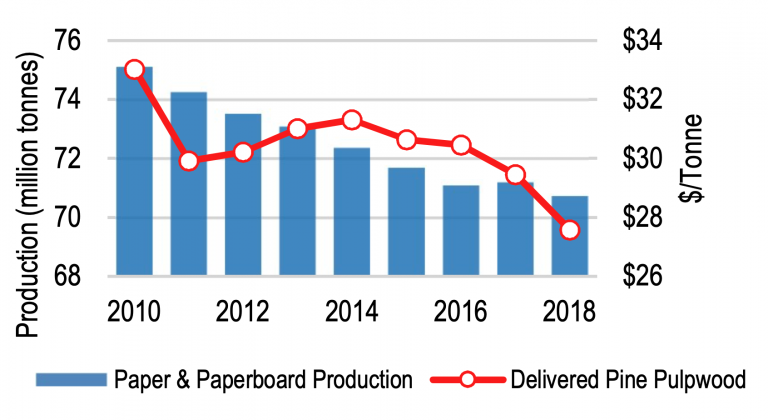
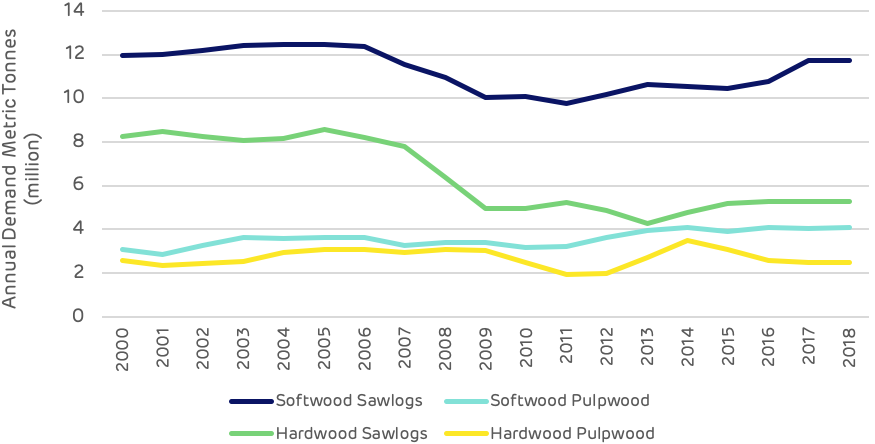
Strong markets are essential for ensuring that forests are managed and restocked to optimum benefit, sawlog markets are particularly important as this is highest revenue stream for forest owners. Figure 6 shows the trend in market demand for each major product category since 2000 and demonstrates the recent increase in softwood sawlog demand as the US economy (particularly housing starts) recovered from the global recession at the end of the last decade. Softwood pulpwood demand increased through the 2000s but has remained relatively stable since 2011, with the exception of a peak during 2018 which resulted from an increase in volume generated by salvage operations after hurricane Michael.
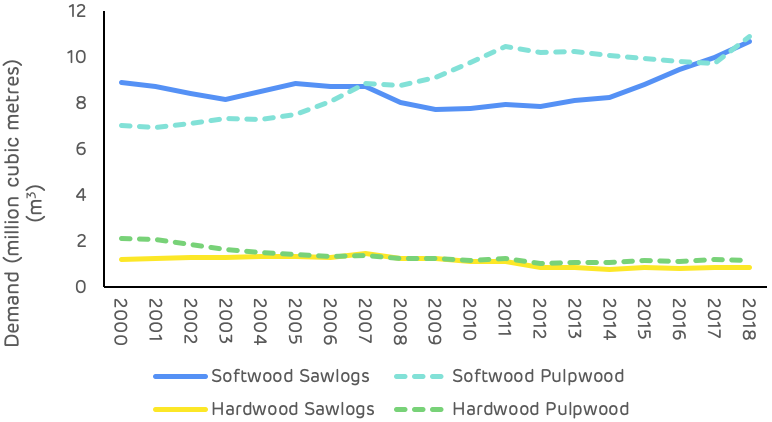
Figure 6: Demand for wood products (USFS, TMS)
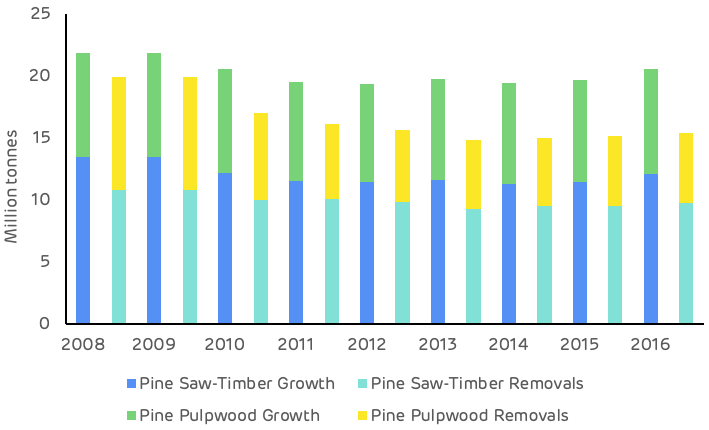
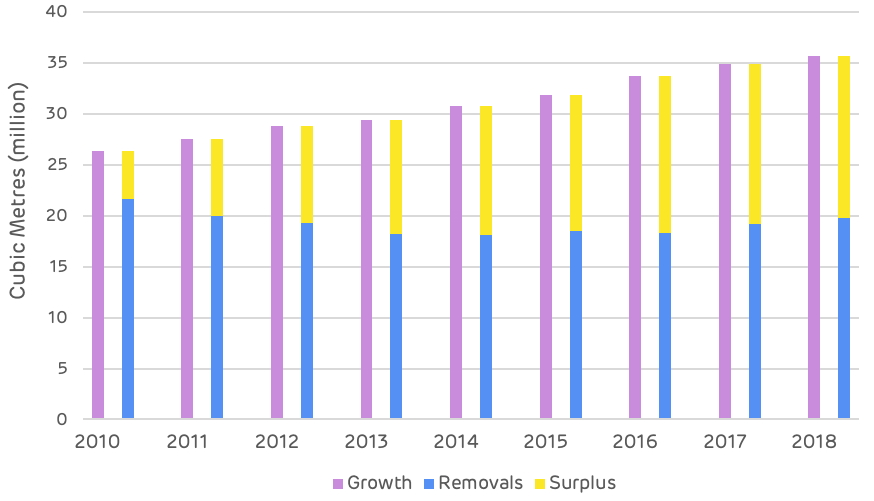
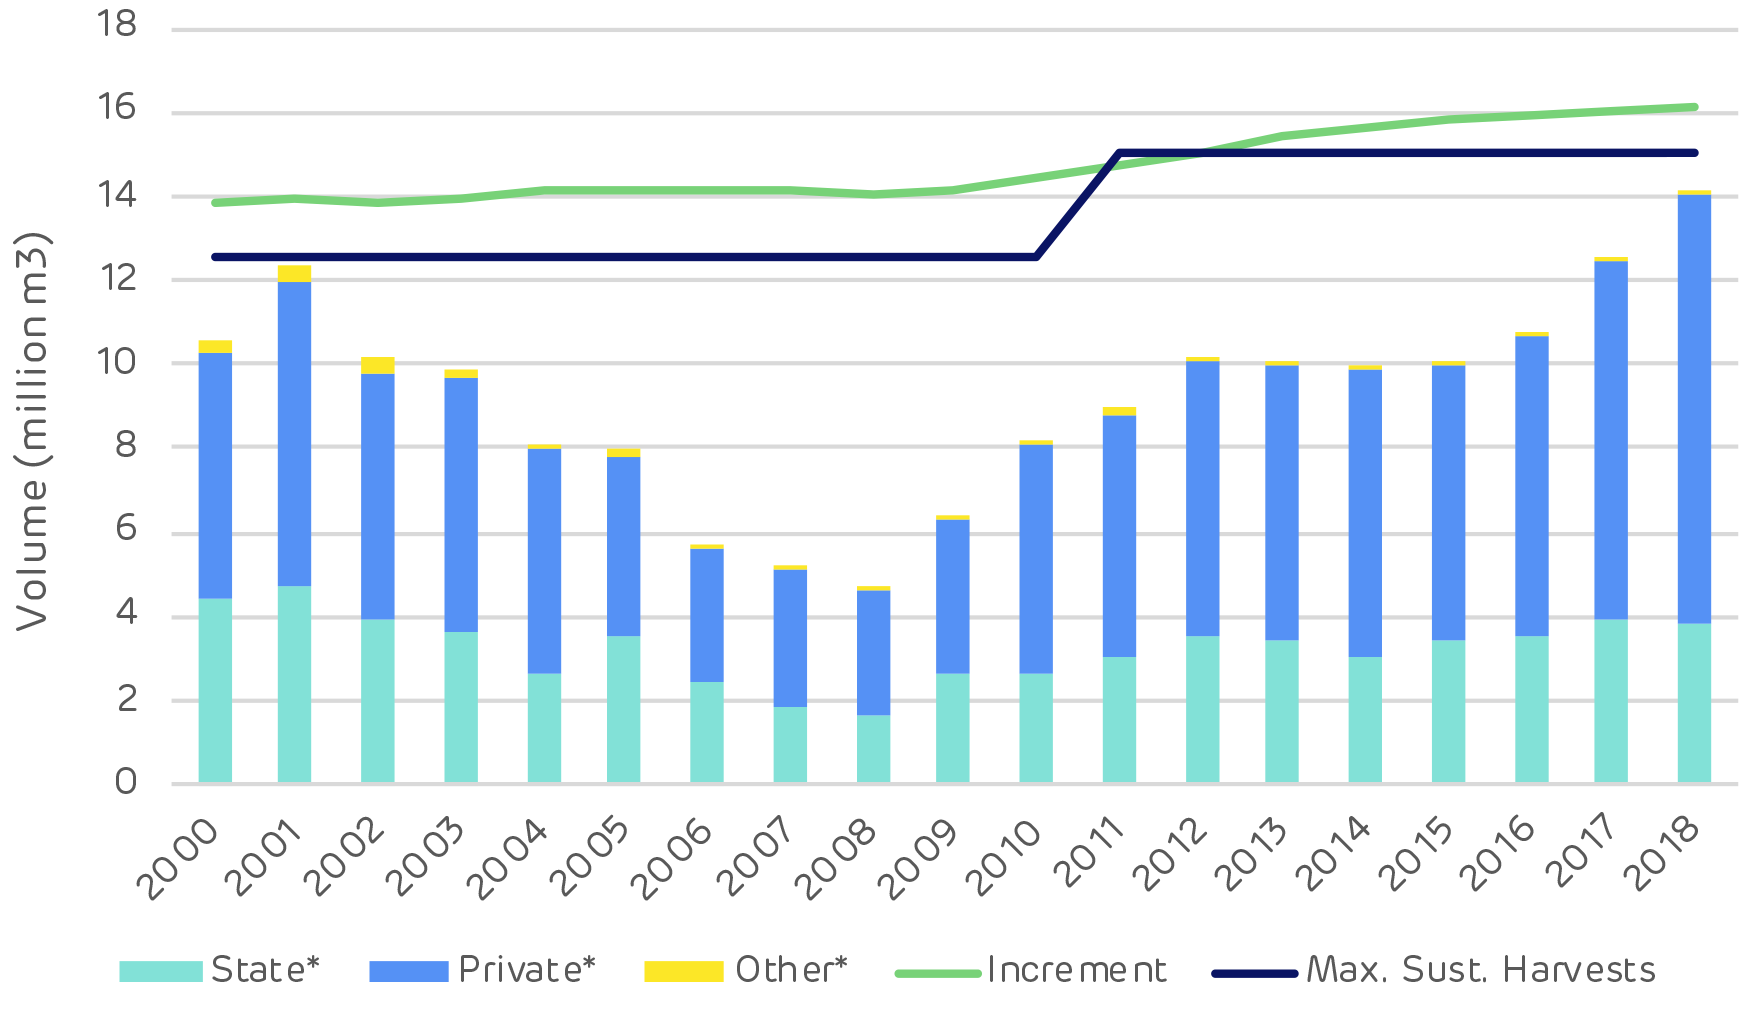
The comparison of average annual growth and removals in the Georgia catchment area is much more tightly balance than in Drax’s other supply regions, as shown in Figure 7. Since 2000 the average annual surplus of growth has been around 3.6 million m3 with both demand and growth increasing in recent years.
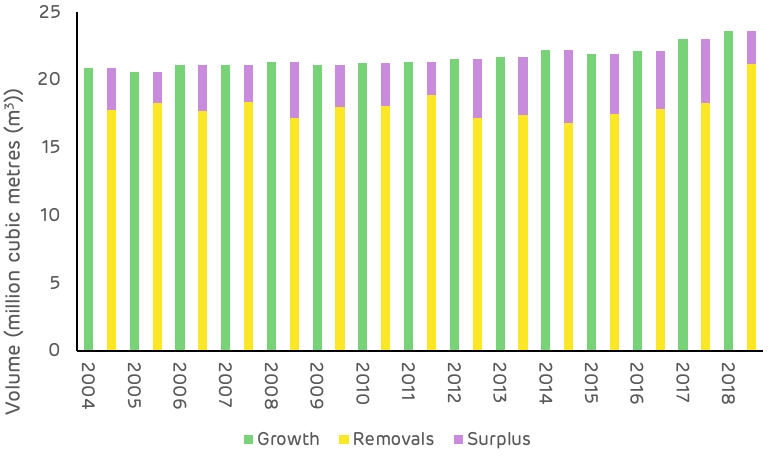
Figure 7: Average annual growth, removals and surplus (USFS)
As shown in Figures 2 & 3, growth rates are strong and inventory is increasing, this is not a problem in the Georgia area. The relatively small surplus, as compared to other catchment areas in the US South, is due to the higher concentration of wood fibre markets and the more intense forest industry activity in this region. As of July 2020, there were over 50 major wood-consuming mills operating within the Georgia catchment area and an additional 80+ mills operating within close proximity, overlapping the catchment area. Total pulpwood demand in 2019 was 12.9 million tons, of which approximately 87% was attributed to non‐bioenergy‐related sources (predominantly pulp/paper) and 13% was attributed to the bioenergy sector. Given the bio-energy sector’s low ranking position in the market (with the lowest ability to pay for fibre), combined with the relatively small scale in demand compared to the pulp and paper industry, the influence of biomass markets can be considered to be minimal in this region, particular when it comes to impacts on wood prices and forest management practice.
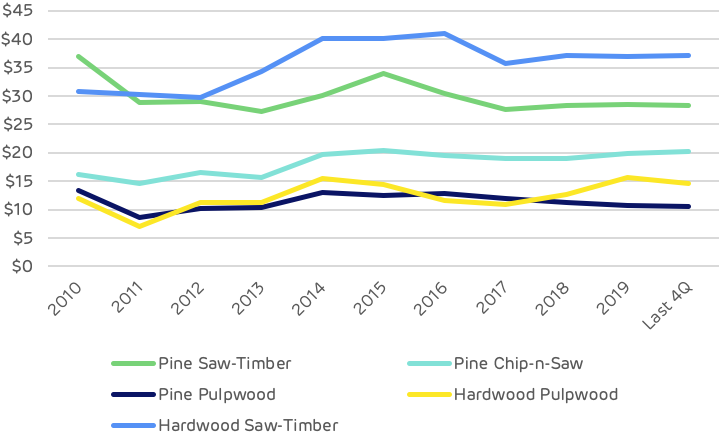
Wood price trends
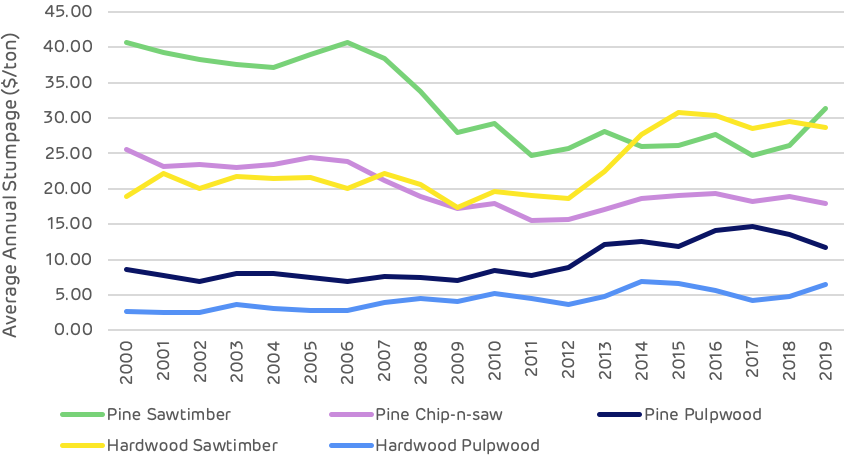
Pine sawtimber prices suffered a significant decline between 2000 and 2010, dropping almost $21 per ton as a result of the global financial crisis and the decline in demand due to the collapse in housing markets and construction (Table 3). Since 2010 pine sawtimber has remained relatively stable, with some minor fluctuations shown in Figure 8 below.
| Change ($/ton) | Pine Sawtimber | Pine Chip-n-saw | Pine Pulpwood | Hardwood Sawtimber | Hardwood Pulpwood |
|---|---|---|---|---|---|
| 2000-2019 | -$20.92 | $15.14 | $5.95 | $12.55 | $4.70 |
| 2000-2010 | -$20.92 | -$21.41 | $2.11 | $11.25 | $5.67 |
| 2010-2019 | $0.00 | $6.27 | $3.84 | $1.30 | -$0.97 |
Pine pulpwood prices have been on a generally increasing trend since 2000, with a more significant increase since 2011. This increase does not reflect an increase in demand or total volume, which has remained relatively stable over this period, but a shifting of the geographic distribution of the market with some new mills opening and old mills closing, resulting in increased competition in some localised fibre baskets and leading to an overall increase in stumpage price.
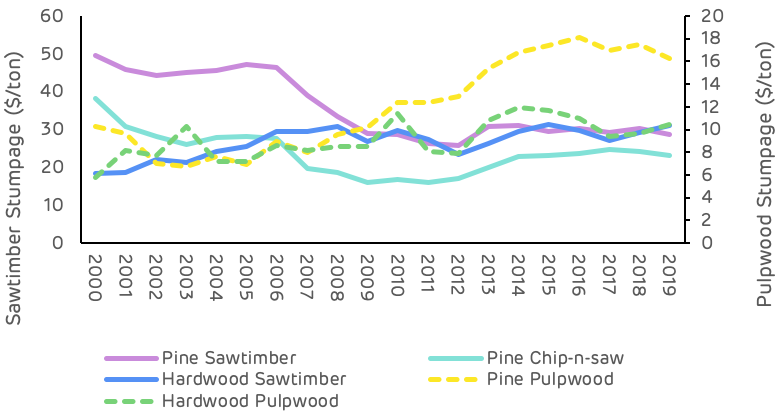
Figure 8: Stumpage price trends (TMS)
Figure 9 below shows that, with the exception of the hurricane salvage volume in 2018, pulpwood removals have declined or remained relatively stable since 2010, whereas pulpwood stumpage prices increased by 41% from 2010 to 2018.
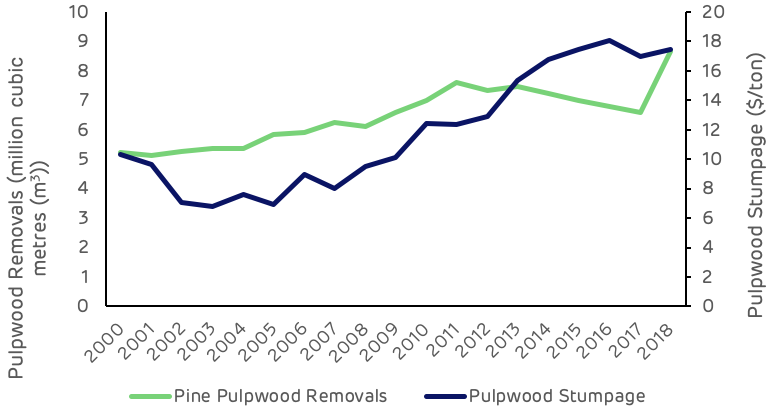
Figure 9: Pulpwood demand and stumpage price (USFS, TMS)
Comparing this stumpage price trend with other catchment areas of the US South (Figure 10), where Drax sources wood pellets, the Georgia area is on average 35% higher than the next highest area (Chesapeake) and 87% higher than the lowest cost area (Amite Bioenergy in Mississippi). This price differential is predominantly due to the scale of demand and availability of surplus low-grade fibre.
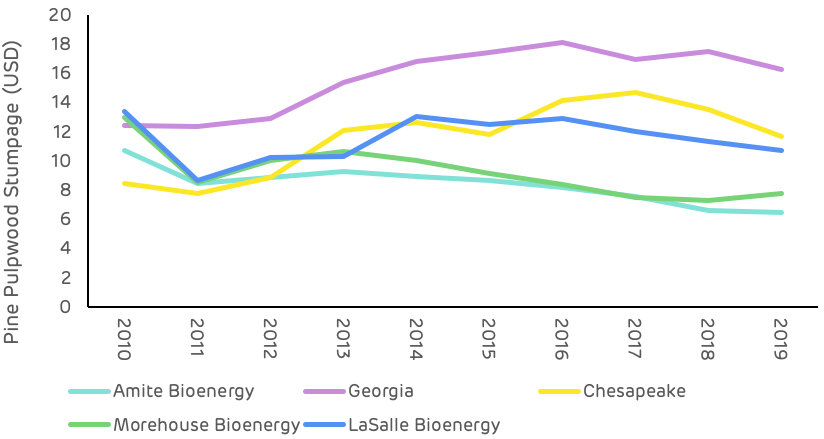
Figure 10: Comparison of pine pulpwood stumpage prices in Drax supply areas US South (TMS)
Hood Consulting summary of the impact of the seven pellet plants on key trends and metrics in this catchment area.
Is there any evidence that bioenergy demand has caused the following…
Deforestation?
No. US Forest Service (USFS) data shows a 108,130-hectare (-2.6%) decrease in total timberland in the Georgia catchment area since Georgia Biomass’ first full year of production in 2012. Specifically, this loss in total area of timberland coincided with a more than 21,000-hectare increase in cropland/pastureland and a more than 73,000-hectare increase in urban land and land classified as having other uses.
However, there is little evidence to suggest that increased wood demand from the bioenergy sector has caused this decrease in total timberland. Furthermore, pine timberland – the primary source of roundwood utilized by the bioenergy industry – has increased more than 17,000 hectares in the catchment area since 2016.
A change in management practices (rotation lengths, thinnings, conversion from hardwood to pine)?
No. Changes in management practices have occurred in the catchment area over the last two decades. However, there is little evidence to suggest that bioenergy demand, which accounts for roughly 10-14% of total pulpwood demand (and only 5-7% of total wood demand in the catchment area), has caused or is responsible for these changes.
Clearcuts and thinnings are the two major types of harvests that occur in this region, both of which are long-standing, widely used methods of harvesting timber. TimberMart-South (TMS) data shows that thinnings accounted for 67% of total reported harvest area in the southeast Georgia market from 2000-2010, but only 43% of total harvest area reported from 2012-2019. Specifically, this downward shift was initiated by the bursting of the US housing bubble in the mid-2000s and had been completed by the early 2010s. We’d like to note that this shift coincided with a nearly 50% decrease in pine sawtimber stumpage price from 2006-2012. This is important because the strength of pine sawtimber markets had been a driving force behind timber management decisions in this region in the early and mid-2000s.
Also, contributing to the decreased prevalence of thinnings was the strengthening of pine pulpwood markets in the mid-2000s, as pine pulpwood stumpage prices increased more than 40% in the Georgia catchment area from 2003-2008. So, with sawtimber markets continuing to weaken and pulpwood markets doing just the opposite, the data suggests that many landowners decided to alter their management approach (to take advantage of strong pulpwood markets) and focus on short pulpwood rotations that typically do not utilize thinnings.
Ultimately, the shift in management approach that occurred in this market can be linked to the weakening of one type of timber market and the strengthening of another. In the early and mid-2000s, timber management was focused on sawtimber production – a type of management that utilizes thinnings. However, for more than a decade now, this market has been driven to a large degree by the pulp/paper industry, with a significant portion of the timber management in this area focused on short pulpwood rotations.
Diversion from other markets?
No. Demand for softwood (pine) sawlogs increased an estimated 39% in the Georgia catchment area from 2011-2019. Also, increased bioenergy demand has caused no diversion from other pulpwood markets (i.e. pulp/paper), as pulpwood demand not attributed to bioenergy held steady and remained nearly unchanged from 2012-2017 before increasing in 2018 and 2019 due to the influx of salvage wood brought about by Hurricane Michael.
We’d like to make special note that increased demand for softwood sawlogs since 2011 has not resulted in a full pine sawtimber (PST) stumpage price recovery in this market. Reduced demand for softwood sawlogs in the late 2000s and early 2010s resulted in oversupply, and this oversupply has remained, despite increased demand the last 6-8 years. As a result, PST stumpage prices have held steady and averaged roughly $30 per ton in the catchment area since 2013 – down approximately 35% from the 2000-2006 average of more than $46 per ton, but up roughly 15% from the 2011-2012 average of approximately $26 per ton.
An unexpected or abnormal increase in wood prices?
No / Inconclusive. The delivered price of pine pulpwood (PPW) – the primary roundwood product consumed by both Georgia Biomass and Fram – increased 26% in the Georgia catchment area over the six years directly following the startup of Georgia Biomass, increasing from $29.16 per ton in 2011 to $36.63 per ton in 2017. And while this 26% increase in delivered PPW price coincided with a roughly 1.1 million metric ton increase in annual pine pulpwood demand from Georgia Biomass and Fram, total demand for pine pulpwood (from both bioenergy and other sources) actually decreased 7% over this period. Moreover, evidence suggest that this increase in PPW price is more closely linked to changes in wood supply, specifically, the 9% decrease in PPW inventory from 2011-2017.
However, there is evidence that links increased demand from the bioenergy sector to an increase in secondary residual (i.e. sawmill chips, sawdust, and shavings) prices. Specifically, the price of pine sawmill chips – a residual feedstock utilized by the bioenergy industry for wood pellet production – held steady and averaged approximately $26 per ton in the Georgia catchment area from 2008-2012. However, from 2012-2016, pine sawmill chip prices increased more than 15% (to $29.55 per ton in 2016). This increase in price coincided with annual pine residual feedstock purchases by Georgia Biomass and Fram increasing from roughly 325,000 metric tons to nearly 1.0 million metric tons over this period. However, note that pine sawmill chip prices have held steady and averaged roughly $29.50 per ton in the catchment area since 2016, despite further increases in pine secondary residual purchases by Georgia Biomass and Fram (to more than 1.2 million metric tons in 2019).
Ultimately, the data suggests that any excess supply of pine secondary residuals in the catchment area was absorbed by the bioenergy sector in the early and mid-2010s, and the additional demand/competition placed on this market led to increased residual prices. However, the plateauing of residual prices since 2015 along with the continued increase in secondary residual purchases by Georgia Biomass and Fram further suggest that an increasing percentage of secondary residual purchases by the bioenergy sector is sourced from outside the catchment area. Specifically, Fram confirmed this notion, noting that 35-40% of its secondary residual purchases come from outside the Georgia catchment area (from six different states in the US South).
A reduction in growing stock timber?
No. Total growing stock inventory in the catchment area increased 11% from 2011 through 2018, the latest available. Specifically, over this period, inventories of pine sawtimber and chip-n-saw increased 35% and 13%, respectively. However, pine pulpwood inventory decreased 11% from 2011-2018.
Note that the decrease in pine pulpwood inventory was not due to increased demand from bioenergy (or other sources) or increased harvesting above the sustainable yield capacity of the forest area – as annual growth of pine pulpwood has exceeded annual removals every year since 2011. Rather, this decrease can be linked to the 24% decline in pine sawtimber removals that occurred from 2005-2014 (due to the bursting of the US housing bubble and Great Recession that followed). In this region, timber is typically harvested via clearcut once it reaches maturity (i.e. sawtimber grade), after which the stand is reestablished, and the cycle repeated. However, with the reduced harvest levels during this period also came a reduction in newly reestablished timber stands – the source of pine pulpwood. So, with less replantings occurring during this period, inventories of pine pulpwood were not replenished to the same degree they had been previously, and therefore this catchment area saw a reduction in pine pulpwood inventory levels.
However, according to the US Forest Service, annual removals of pine sawtimber have increased 50% in the Georgia catchment area since 2014, which would suggest higher clearcut levels and increased stand reestablishment. TimberMart-South data also supports this assertion, as clearcut harvests have constituted approximately 60% of the total harvest area reported to TimberMart-South in this region since 2014, compared to 40% from 2005-2014. Ultimately, these increases in clearcut (and stand reestablishment) levels may not be reflected in increased pine pulpwood inventory levels in the short term – as it can take more than 10 years for a pine seedling to become merchantable and reach the minimum diameter requirements to be classified as pulpwood. However, adequate supply levels are expected to remain in the meantime. Furthermore, pine pulpwood inventory levels are expected to increase in the mid-to-long terms as a result of the increased harvest levels and stand reestablishment levels that have occurred in the catchment area since 2014.
A reduction in the sequestration rate of carbon?
No / Inconclusive. US Forest Service data shows the average annual growth rate of total growing stock timber has remained nearly unchanged (holding between 6.0% and 6.1%) in the catchment area since 2011, which would suggest that the sequestration rate of carbon has also changed very little in the catchment area the last 8-10 years. However, the 11% increase in total growing stock inventory since 2011 does indicate that total carbon storage levels have increased in the Georgia catchment area since Georgia Biomass commenced operations in this market.
An increase in harvesting above the sustainable yield capacity of the forest area?
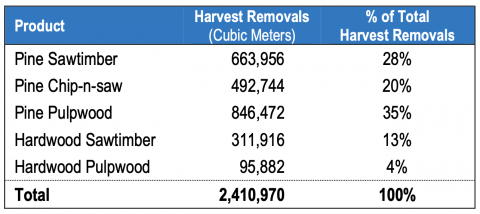
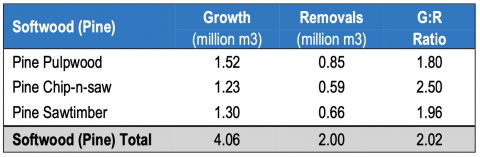
No. Growth-to-removals (G:R) ratios, which compare annual timber growth to annual harvests, provides a measure of market demand relative to supply as well as a gauge of market sustainability. In 2018, the latest available, the G:R ratio for pine pulpwood, the predominant timber product utilized by the bioenergy sector, equaled 1.06 (a value greater than 1.0 indicates sustainable harvest levels). Note, however, that the pine pulpwood G:R ratio averaged 1.44 from 2012-2017. The significant drop in 2018 was due to a 31% increase in removals (due to Hurricane Michael) and is not reflective of the new norm. Specifically, pine pulpwood removals are projected to be more in line with pre-2018 levels in 2019 and 2020, and so too is the pine pulpwood G:R ratio.
Timber growing stock inventory
Neutral. According to USFS data, inventories of pine pulpwood decreased 11% in the catchment area from 2011-2018. However, that decrease was not due to increased demand from bioenergy. Typically, a reduction in inventory is linked to harvest levels above the sustainable yield capacity of the forest area, but in this case, annual growth of pine pulpwood exceeded annual removals every year during this period.
Ultimately, the decrease in pine pulpwood inventory from 2011-2018 can be linked to decreased pine sawtimber production beginning in the mid-2000s. Specifically, annual removals of pine sawtimber decreased 24% from 2005-2014, and the reduction in harvest levels during this period meant fewer new pine stands were reestablished, and that has led to the current reduction in pine pulpwood inventory. (Note that the decrease in pine sawtimber removals from 2005-2014 was mirrored by a 27% increase in pine sawtimber inventory over this same period). However, USFS data shows that annual removals of pine sawtimber have increased 50% in the Georgia catchment area since 2014, which suggests that pine pulpwood inventory levels will start to increase in the catchment area due to increased harvest levels and the subsequent increase in stand reestablishment levels.
Timber growth rates
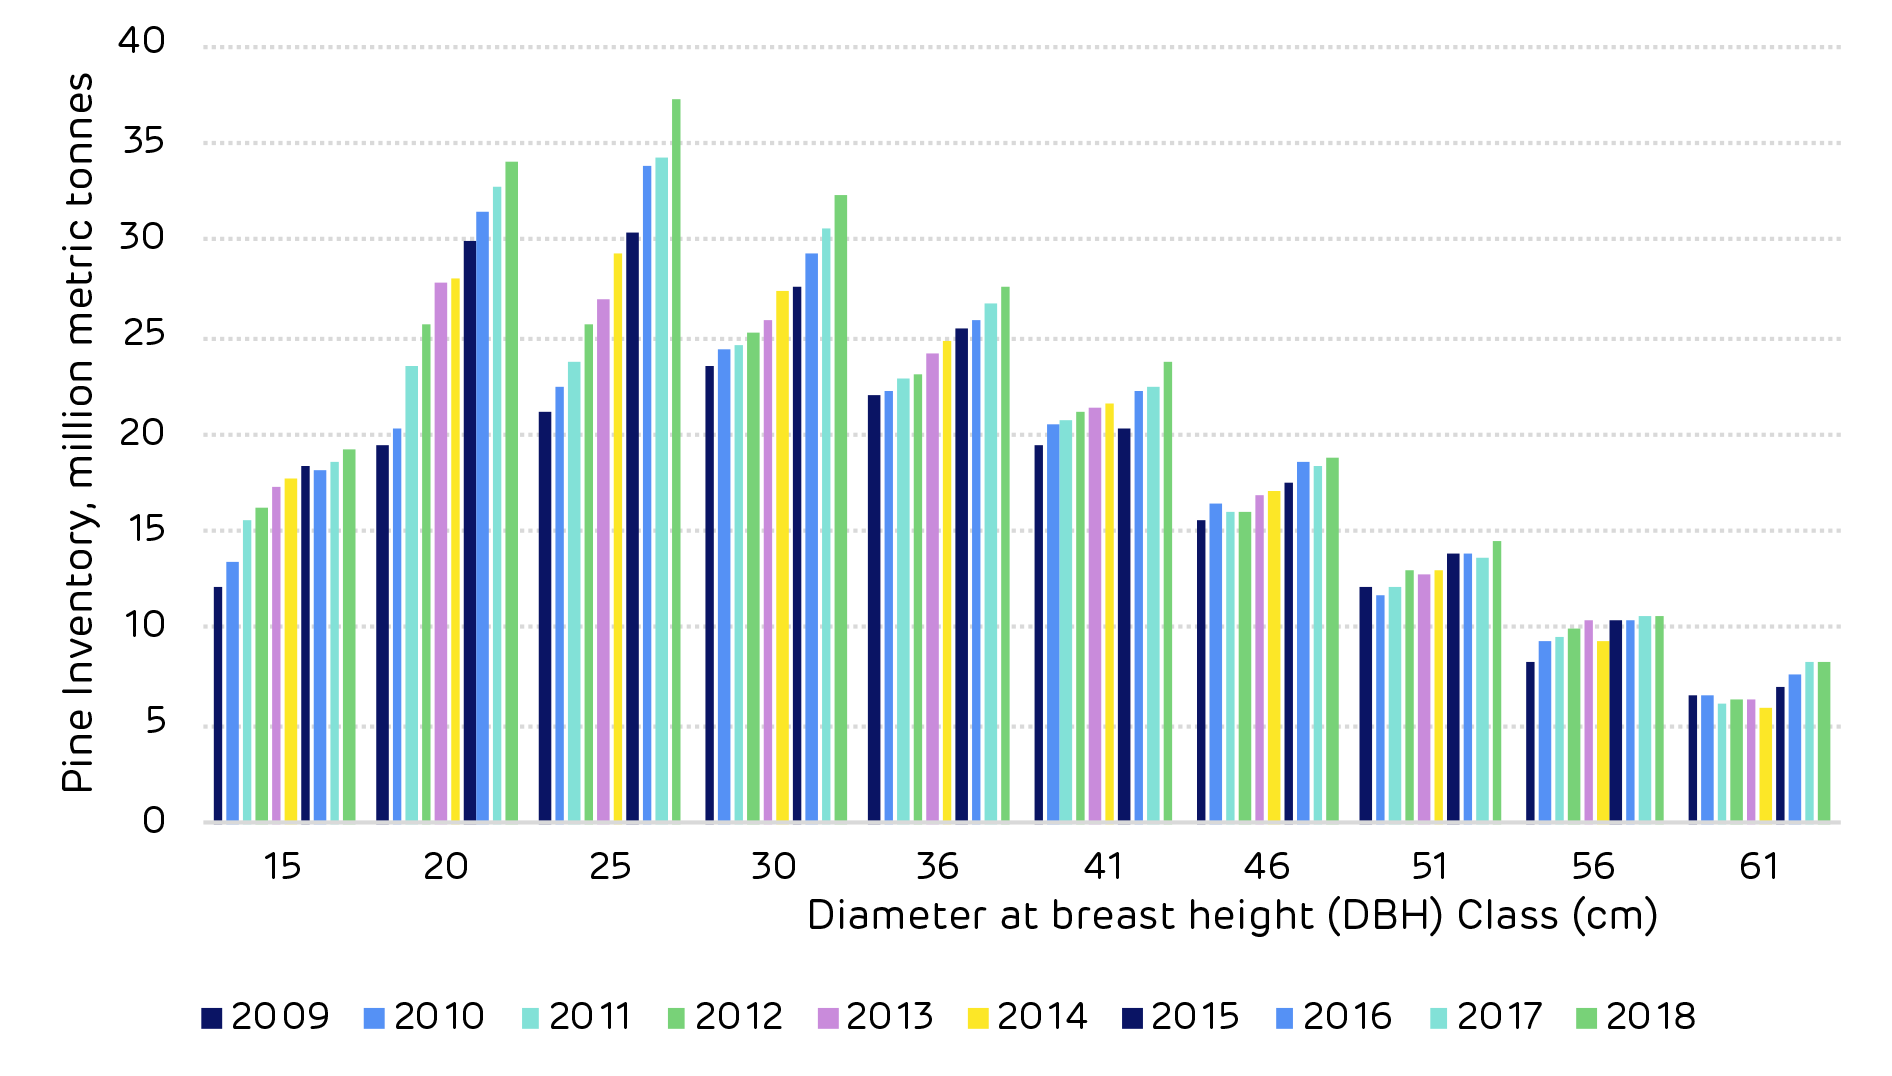
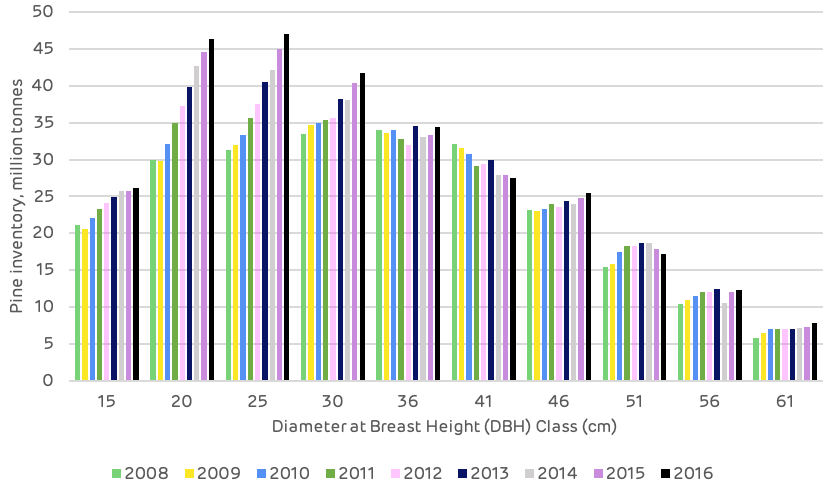
Neutral. Timber growth rates have increased for both pine sawtimber and pine chip-n-saw but decreased slightly for pine pulpwood in the catchment area since 2011. Evidence suggests that this decrease in pine pulpwood growth rate is not due to increases in bioenergy demand, but rather linked to changes in diameter class distribution and indicative of a forest in a state of transition, where timber is moving up in product class (i.e. pine pulpwood is moving up in classification to pine chip-n-saw).
Forest area
Neutral. In the Georgia catchment area, total forest area (timberland) decreased more than 115,000 hectares (-2.8%) from 2011 through 2018. Note that this decrease coincided with a roughly 19,000-hectare increase in cropland and 93,000-hectare increase in urban land and land classified as having other uses.
Specifically, pine timberland, the primary source of roundwood utilized by the bioenergy industry, decreased over 34,000 hectares from 2011-2016. However, from 2016-2018, pine timberland stabilized and rather increased more than 17,000 hectares in the catchment area (or a net decrease of roughly 17,000 hectares from 2011-2018). Ultimately, there is little evidence that the decrease in pine timberland from 2011-2016 or increase since 2016 is linked to increased bioenergy demand. Rather, the overall decrease in pine timberland since 2011 appears to be more closely linked to the relative weakness of pine sawtimber markets in the Georgia catchment area and the lack of return from sawtimber.
Wood prices
Positive / Negative. Intuitively, an increase in demand should result in an increase in price, and this is what the data shows in the Georgia catchment area as it relates to increased biomass demand from Georgia Biomass and Fram and the prices of the various raw materials consumed by these mills. Specifically, the 1.4-million metric ton increase in softwood pulpwood demand attributed to Georgia Biomass and Fram coincided with a 20% increase in delivered pine pulpwood price and a 10-15% increase in pine chip prices from 2011-2015. Since 2015, biomass demand has held relatively steady, and, overall, so too have delivered pine pulpwood and pine chip prices. The apparent link between increased bioenergy demand and increased pine raw material prices is supported further by statistical analysis, as strong positive correlations were found between softwood biomass demand and both delivered pine pulpwood and pine chip prices. However, note that biomass demand alone is not responsible for these changes in prices, as softwood biomass demand accounts for only 10-15% of total softwood pulpwood demand in the catchment area. Rather, the prices of these raw materials are impacted to a larger degree by demand from other sources (i.e. pulp/paper), which accounts for 85-90% of total softwood pulpwood demand in the Georgia catchment area.
On the other hand, it’s also important to note that the increase in bioenergy-related wood demand has been a positive for forest landowners in the Georgia catchment area. Not only has bioenergy provided an additional outlet for pulpwood in this market, but the increase in pulpwood prices as a result of increased pulpwood demand has transferred through to landowners (improved compensation). Specifically, since 2015, pine pulpwood (PPW) stumpage price – the price paid to landowners – has averaged more than $17 per ton in the Georgia catchment area. This represents a 70% increase over the approximately $10 per ton averaged by PPW stumpage in the catchment area over the last five years prior to Georgia Biomass’ startup in 2Q 2011.
(Note: Pine pulpwood stumpage prices are notably higher in the Georgia catchment area due to a much tighter balance in supply and demand (in comparison to most other markets across the US South). For instance, in all other areas across the US South2, PPW stumpage prices have averaged less than $9 per ton since 2015, or roughly half that of prices in the Georgia catchment area).
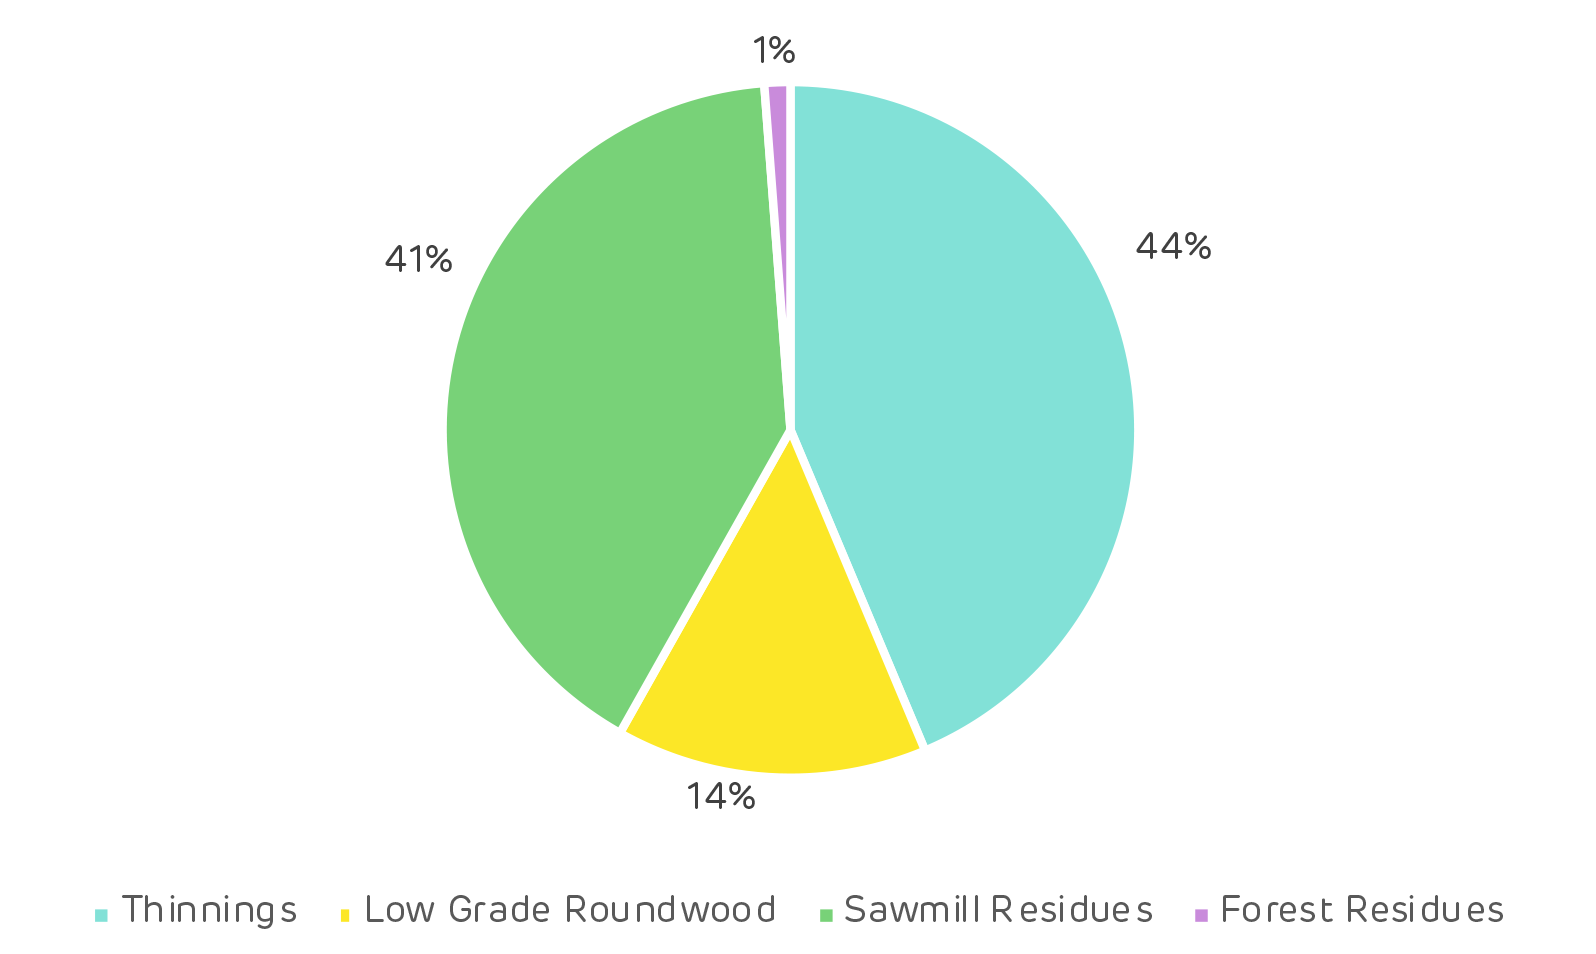
Markets for solid wood products
Positive. In the Georgia catchment area, demand for softwood sawlogs used to produce lumber and other solid wood products increased an estimated 39% from 2011-2019, and by-products of the sawmilling process are sawmill residuals – materials utilized by Georgia Biomass and the Fram mills to produce wood pellets. With the increased production of softwood lumber, so too has come an increase in sawmill residuals, some of which have been purchased/consumed by Georgia Biomass and Fram. Not only have these pellet producers benefited from the greater availability of this by-product, but lumber producers have also benefited, as the Georgia Biomass and Fram mills have provided an additional outlet for these producers and their by-products.
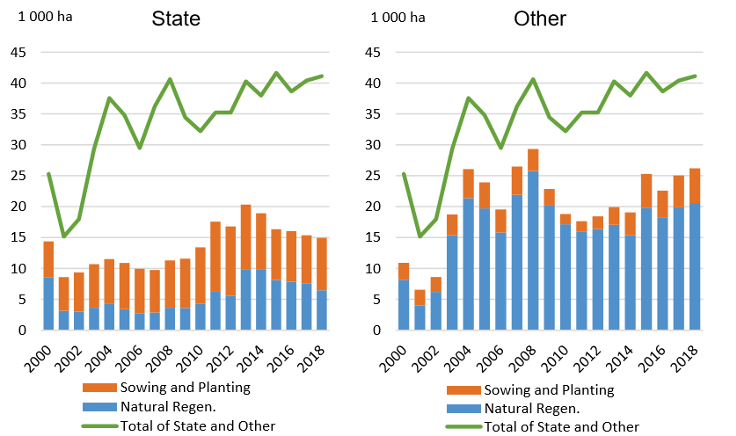

![Reforestation in Estonia. * Note: Since 2014 it has not been compulsory for private and other forest owners to submit reforestation data. [Click to view/download]](https://www.drax.com/wp-content/uploads/2020/03/figure_3.13.png)
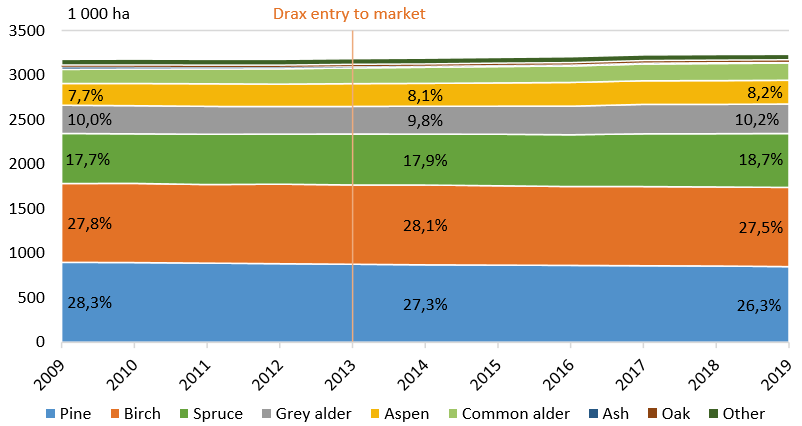
![Species mix in Estonian forests [Click to view/download]](https://www.drax.com/wp-content/uploads/2020/03/figure_3.3.png)

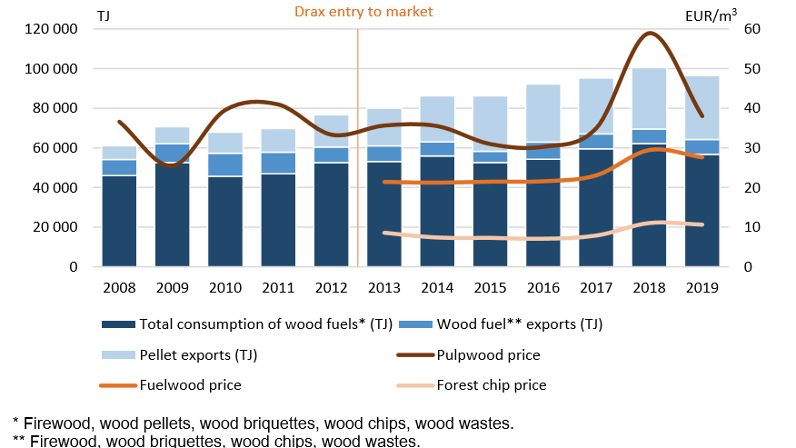
![Comparison of sawlog and pulpwood prices [click to view/download]](https://www.drax.com/wp-content/uploads/2020/03/Picture-1.pdf2_-1.png)