


When business and academia shake hands, they don’t just bridge theory and practice – they step into a space where friction can spark breakthrough ideas.
But bringing those worlds together can sometimes feel awkward. Business tends to want quick answers, in simple terms. Academia thrives on nuance and complexity, so collaboration becomes both a challenge and opportunity.
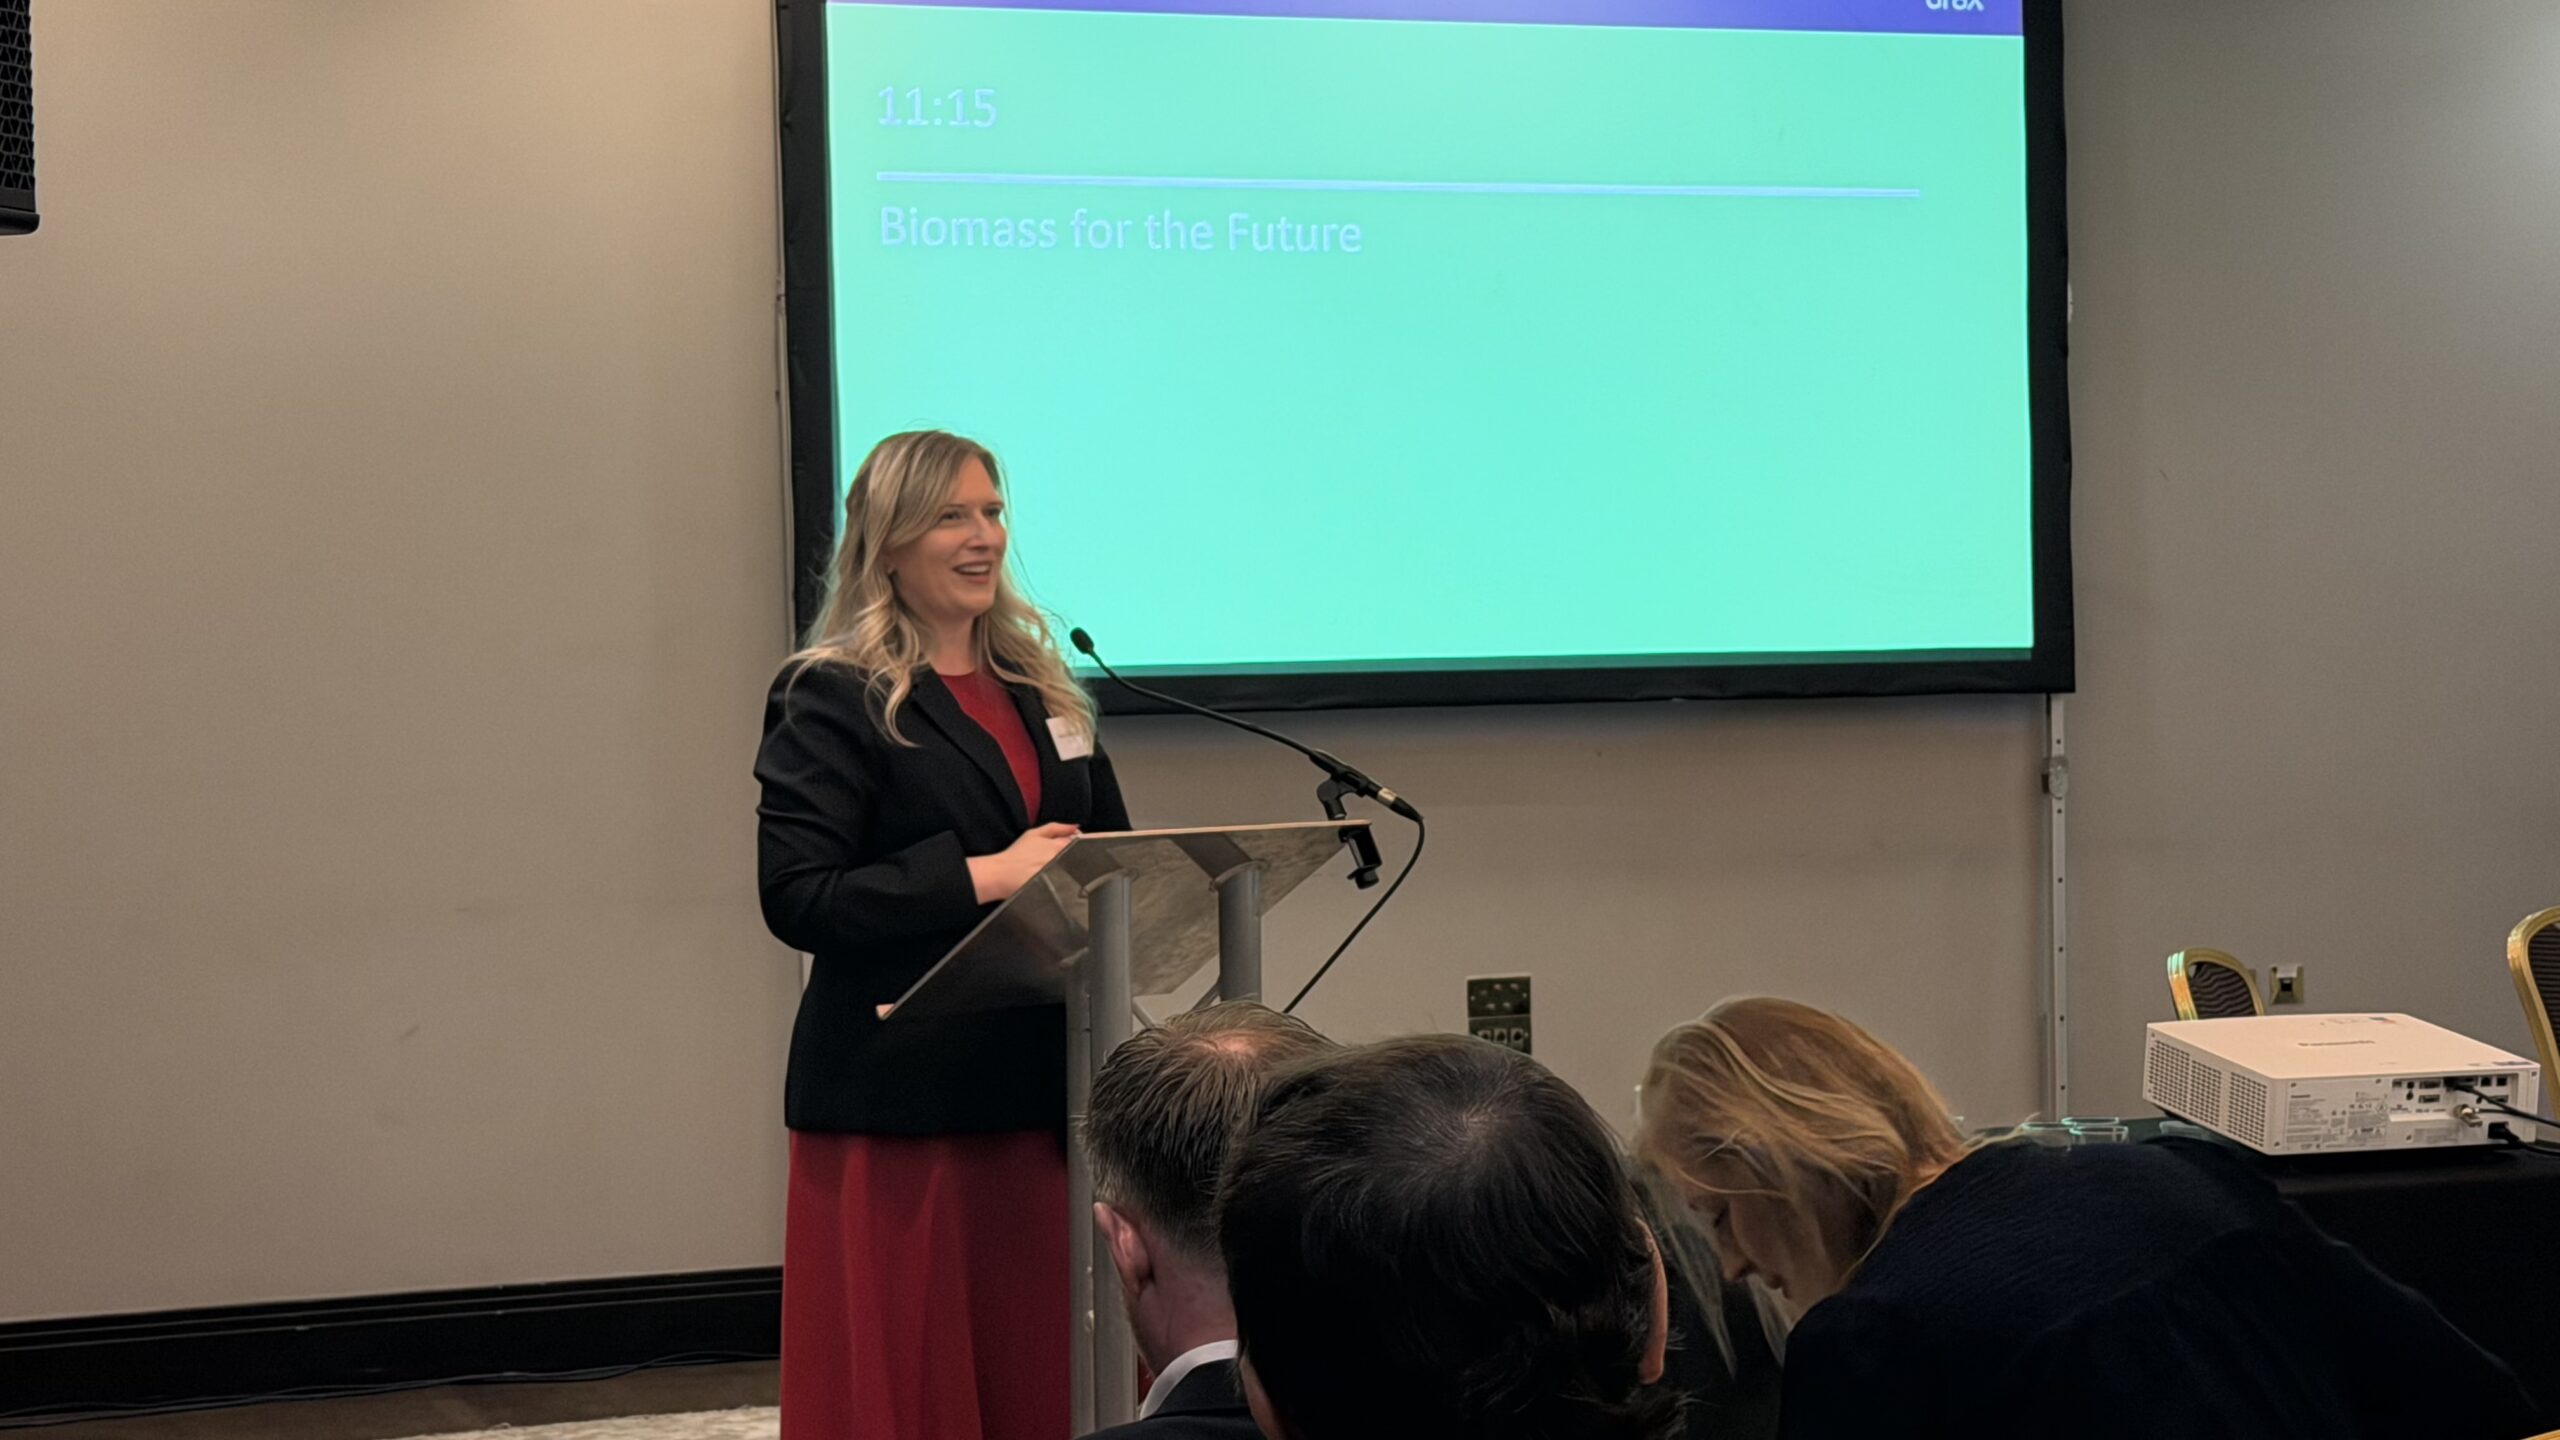
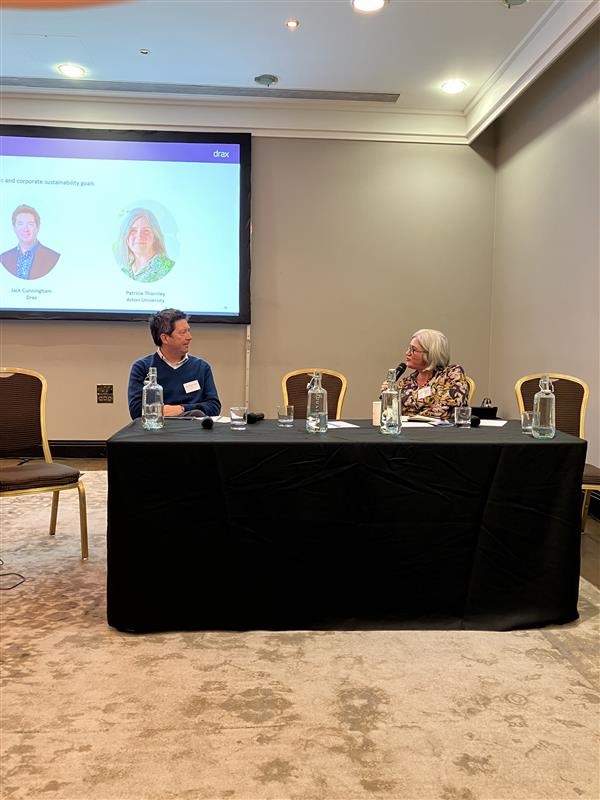
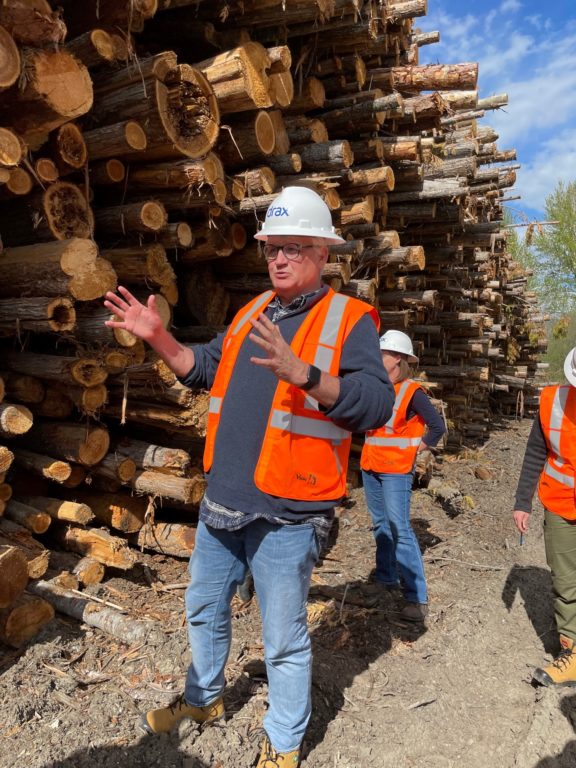
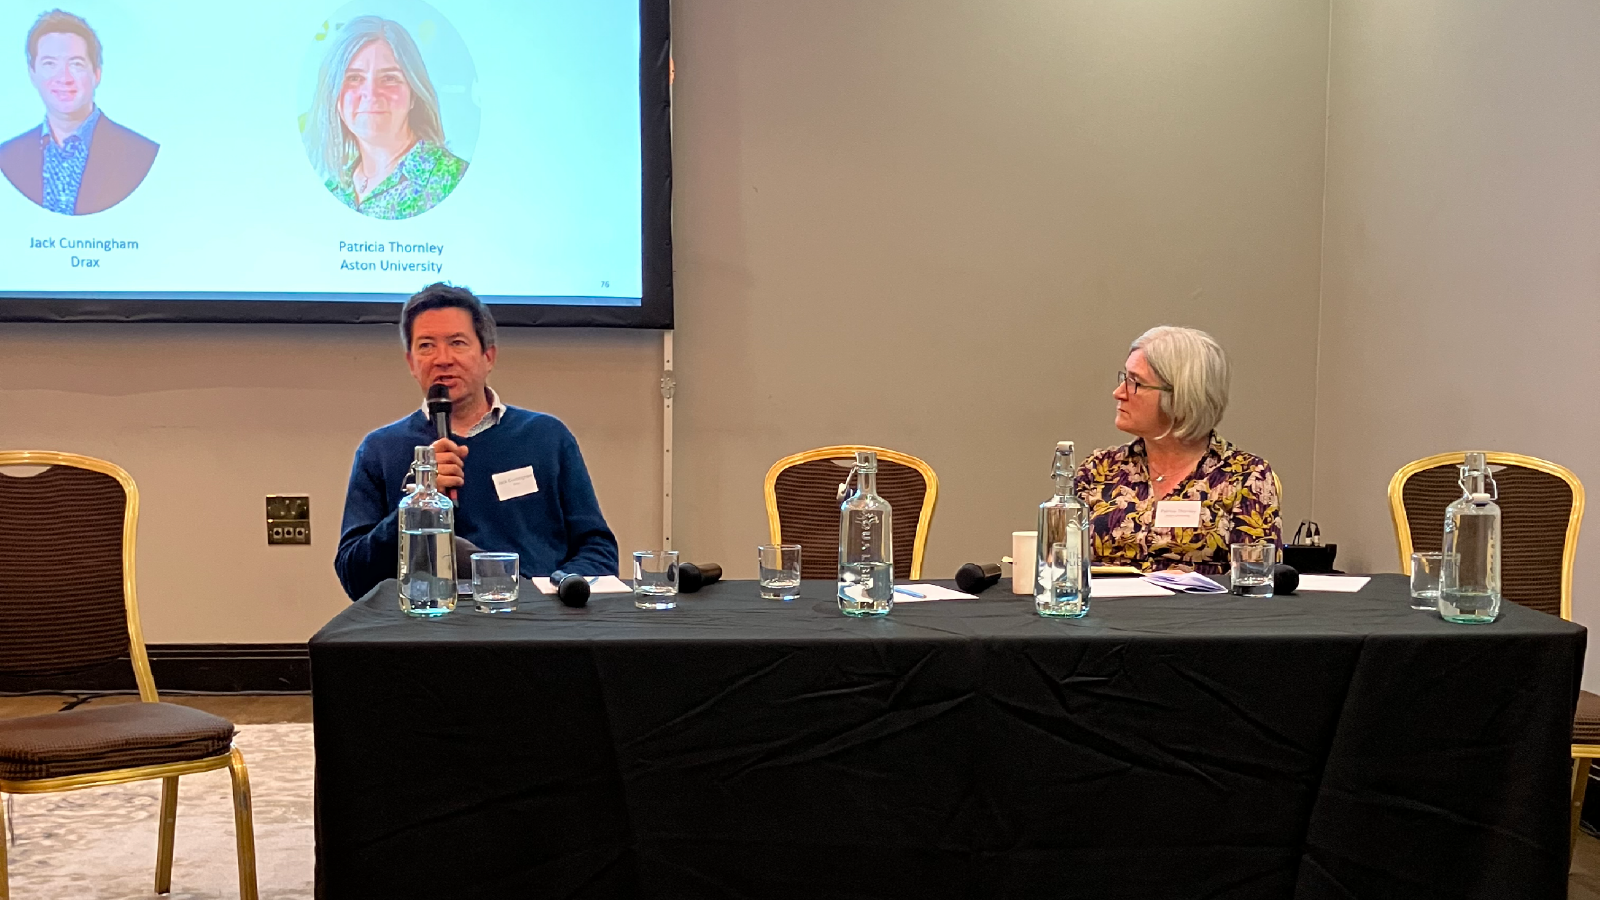
I recently delved into this with Professor Patricia Thornley, newly appointed chief scientific adviser at the Department for Transport (DfT), an expert in bioenergy and green fuels, at the Drax Science Summit.
We talked about why it’s critical all-sides work to bring these worlds together and how we can make it happen. Here are my key takeaways:
1. Aligning incentives for sustained collaboration
As businesses we usually want answers rapidly, maybe even yesterday, and if not then certainly ahead of the next executive or quarterly board meeting. This isn’t where academics excel in adding value to business.
A better approach is to build lasting partnerships with academics. These may not provide quick results but, over the long term, they can keep you your business ahead of the curve, while providing academics with novel research opportunities.
The key is aligned incentives. We can provide stat hungry academics with interesting data sets, and in return gain innovation, credibility and long-term thinking. Prof Patricia shared some insights of her work as the Director of the Supergen Bioenergy Hub, a research hub that works with academia, industry and government to develop sustainable bioenergy systems. It’s a perfect example of the two worlds in synergy. She explained that business and academic participants in Supergen Bioenergy can bring mutually exclusive strengths to jointly think about problem-solving and innovative solutions.
Our partnership with Dr Iain Staffell at Imperial College on our Electric Insights project is another good example, with Iain providing the methodological and analytical vigour to pull our energy system data into meaningful insights that help inform decision making.
2. Preserving academic independence
As someone who facilitates this collaboration first-hand and understands how the cogs fit together, Patricia focused on the criticality of independence during our session.
For partnerships to be credible and productive, academics must retain the freedom to ask hard questions, publish honest results, and challenge assumptions. That independence is not a barrier to collaboration, but rather the foundation of trust and value.
This allows academics to step inside the businesses and understand the real-world and practical challenges they face, which in turn means rigorous research and better corporate decisions. Both sides benefit without sacrificing their core principles or priorities.
Drax has an Independent Advisory Board, made up of leading academics, which plays exactly this role. It’s also going to be critical to Patricia’s new role as chief scientific adviser at DfT, bringing independent academic insight into the hugely complex world of the UK’s transport networks.
Another way we’re working with academia is via a partnership with Brunel University that aligns with our nature positive commitments. We’re supporting their study into upcycling bottom ash from Drax Power Station as a potential method of carbon capture. While we receive updates on the work, we haven’t been involved in shaping the research as it remains independent.
3. Complexities in academic public life
The way we consume information has changed significantly over the last couple decades. We want everything, right now, in bitesize chunks. We’re always looking for our next click or scroll. While the business world tunes into this, it’s not an easy or comfortable space for academics to inhabit.
Adding to this, we operate in a highly complex business and political environment, where public debate often (probably too often) becomes emotionally charged. Academic experts feel threatened by this and for most their instinct will be to shy away. We all have a duty to put that trend in reverse, creating forums – like our science event – where those interactions can happen safely, and working together in an open, engaging and respectful way.
To wrap up my thoughts, we need to recognise that both sides – business and academia – need each other. We don’t need silos, we need collaboration. And it’s on all sides to bring research to life in a way that can be used for better decision making.