Tag: electric insights

How close is Great Britain’s electricity to zero-carbon emissions?

Renewable energy mix, light bulb visual

Demand for electricity might have been 6% lower in the first three months of 2019 than in last year’s first quarter but the demand for lower carbon power is only growing and there’s more pressure than ever for global industries to decarbonise more rapidly.

Aided by a significantly milder winter than last year, Great Britain’s electricity sector continued to make further progress in reducing carbon emissions in the first quarter (Q1) of 2019.

The carbon intensity of Great Britain’s electricity was almost 20% lower in Q1 2019 than in the same period last year. This was driven by a significant decrease in coal usage, with 581 coal-free hours in total over the period – eight times more than in Q1 2018. This trend has only increased, with May seeing the country’s first coal-free week in modern times.

The findings come from Electric Insights, a report commissioned by Drax and written independently by researchers from Imperial College London, that analyses Great Britain’s electricity consumption and looks at what the future might hold.

As public, commercial and political demand for lower carbon emissions mounts, the question for the power system is: can it truly reach zero-emissions?

Keeping a zero-carbon system stable

Quarter after quarter, the carbon intensity of Great Britain’s electricity system has declined. From 545 grams of carbon dioxide (CO2) per kilowatt hour (g/kWh) in Q1 2012, to just over 200 g/kWh last quarter. For a single hour, carbon emissions have fallen as low as just 56 g/kWh. But how soon can that figure reach all the way down to net-zero carbon emissions?

The National Grid’s Electricity System Operator (ESO), believes it could be as soon as 2025. But some serious changes are needed to make it possible for the system to operate safely and efficiently, when you have fewer sources offering balancing services like reserve power, inertia, frequency response and voltage control.

The National Grid ESO believes an approach that establishes a marketplace for trading services holds the solution. The hope is that competition will breed new innovation and bring new technologies such as grid-scale storage and AI into the commercial energy markets, offering reserve power and more accurate forecasting for solar and wind power.

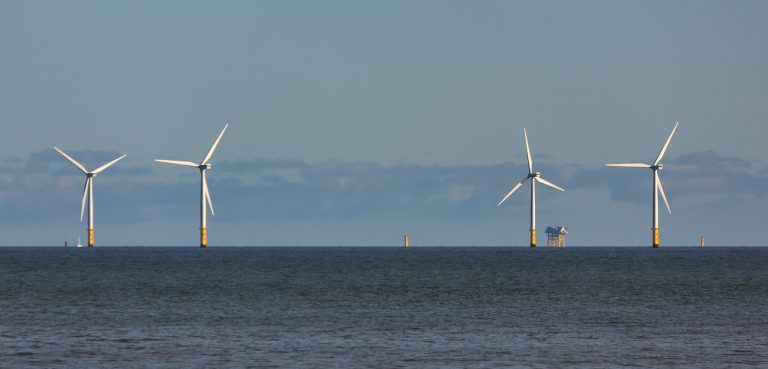
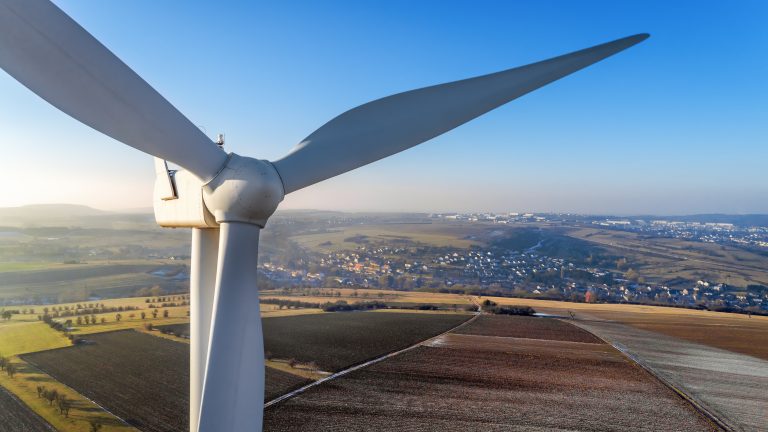
For the meantime, weather-dependent technologies are a key source of renewable electricity in Great Britain, with wind making up more than 20% of all generation in Q1 2019. However, with wind capacity only expected to increase, how should the system react when it’s not an option?

Read the full article, co-authored by Julian Leslie, Head of National Control, National Grid ESO: How low can we go?

We cannot control the weather – but we can harness its power

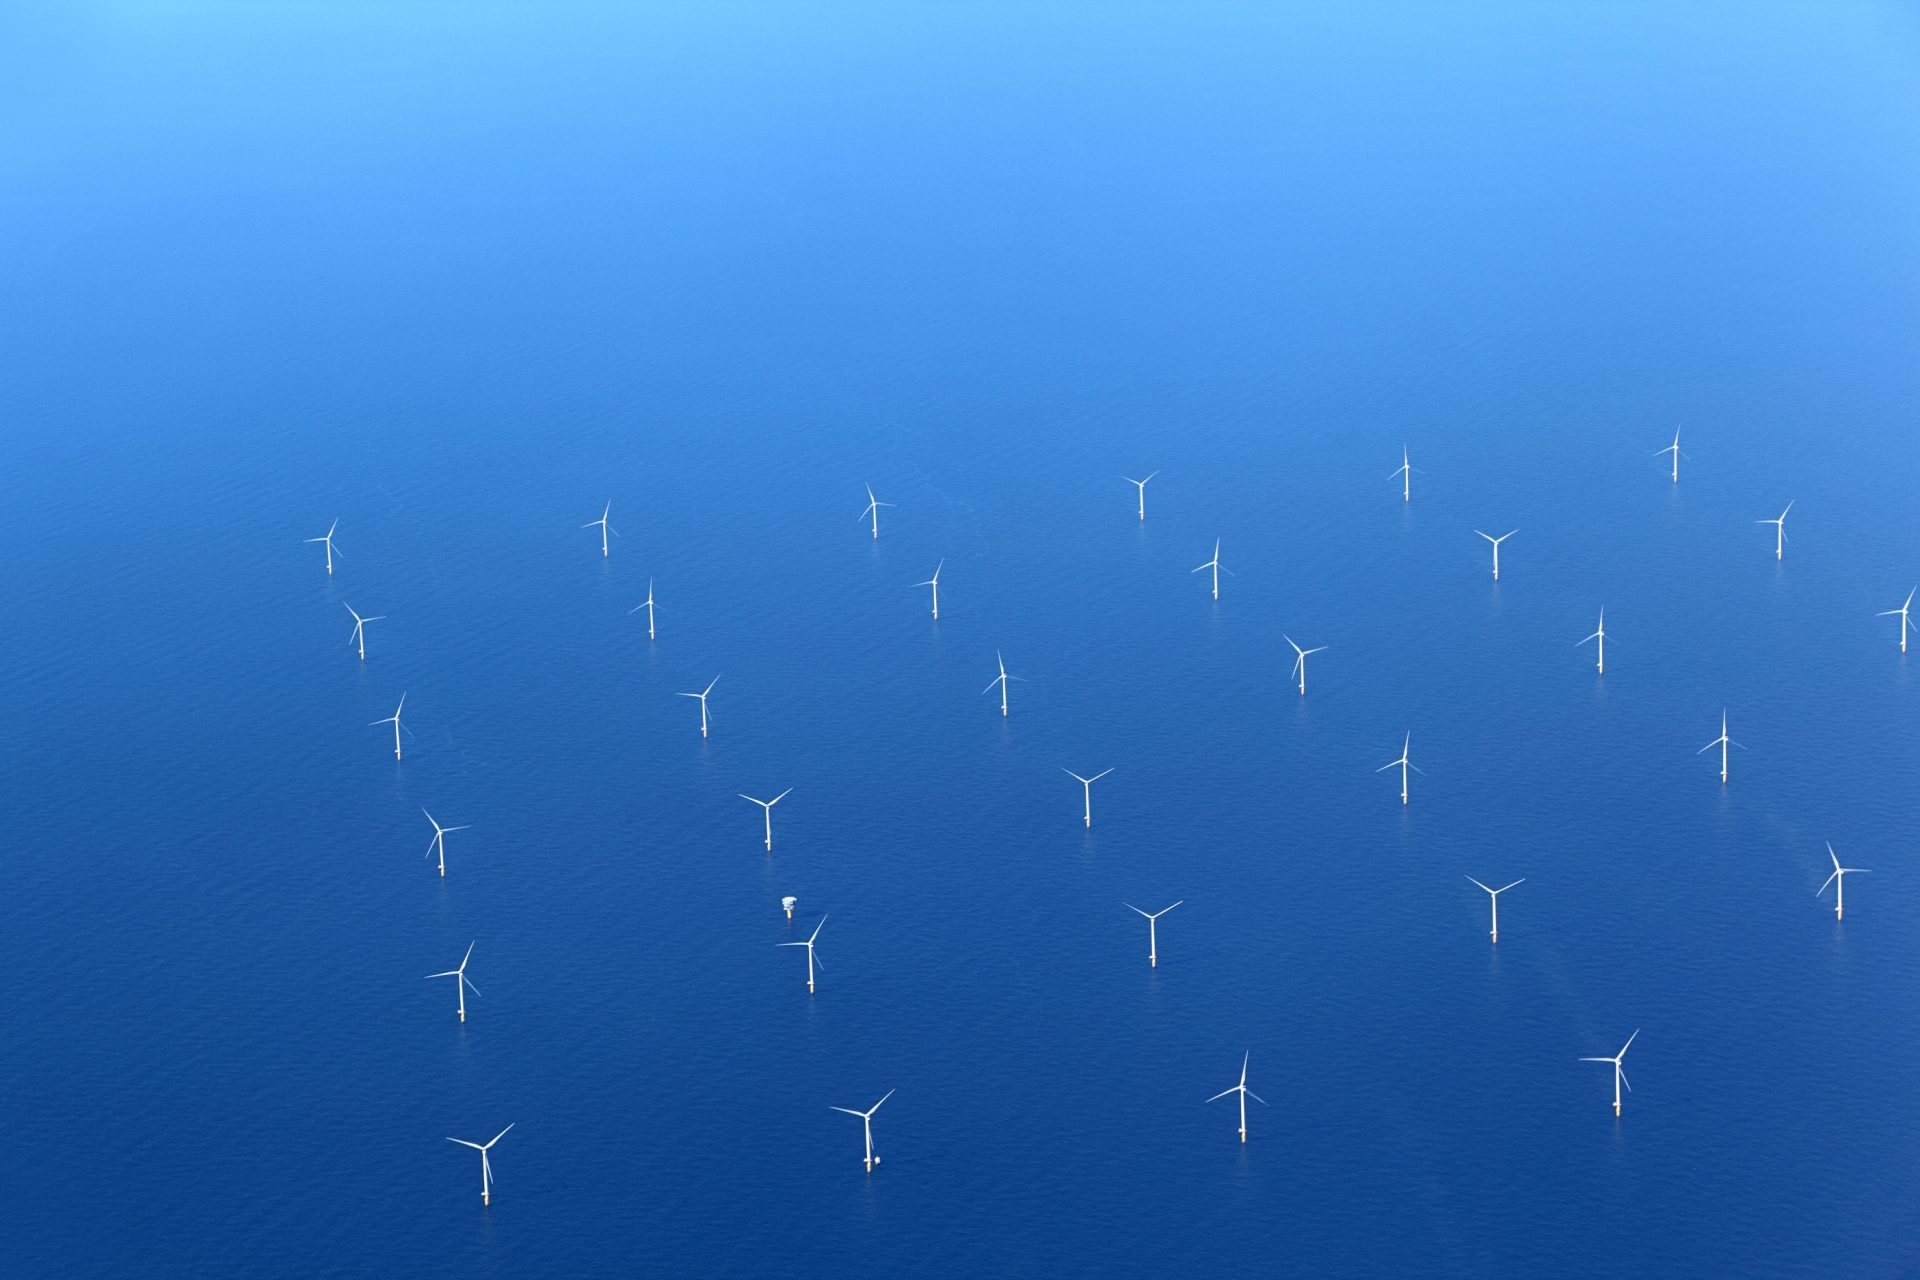
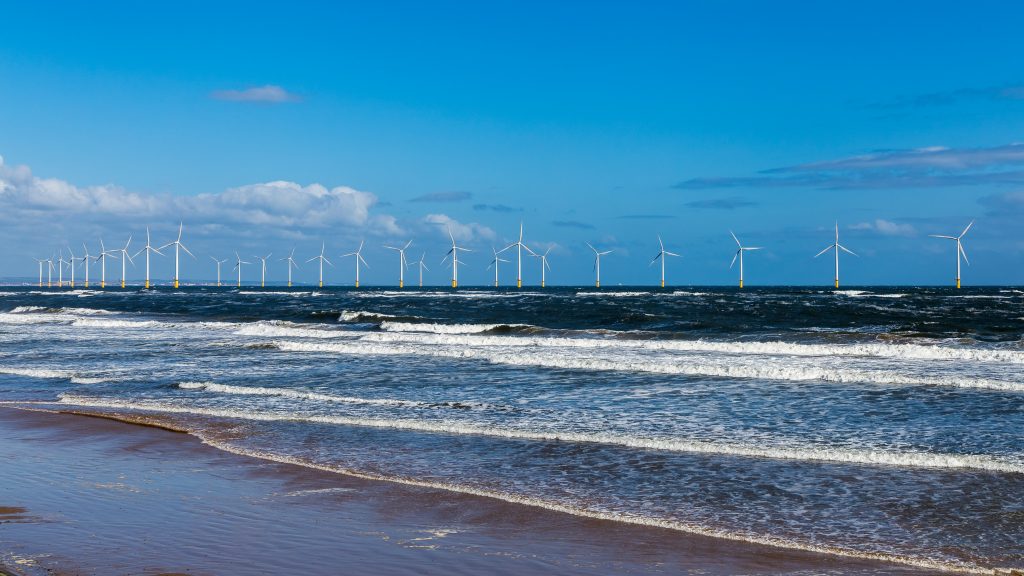
Today there are around 20 gigawatts (GW) of wind capacity installed around Great Britain, and this is forecast to double to 40 GW in the next seven years. However, average wind output can fluctuate between 2 GW one day and 12 GW the next – as happened twice in January. It highlights the ongoing needs for flexibility and diversity of sources in the electricity system even as it decarbonises.

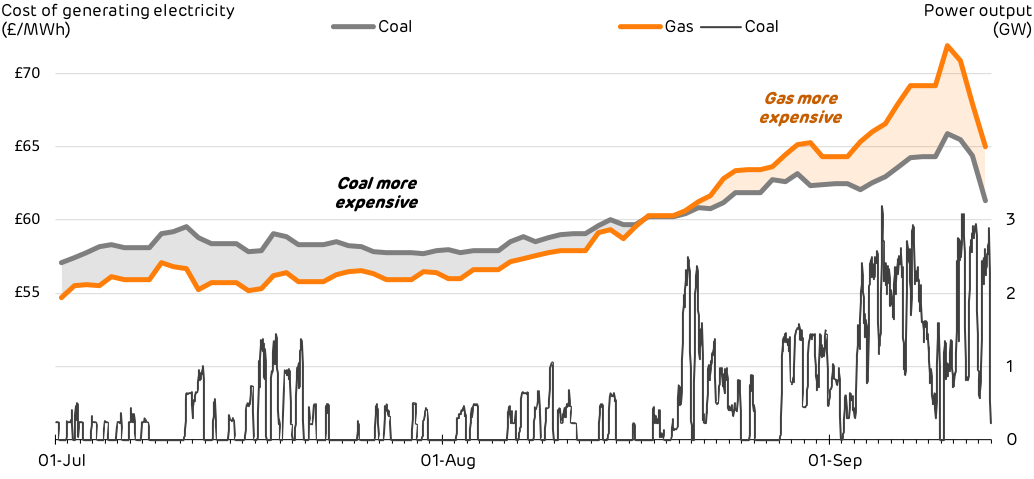
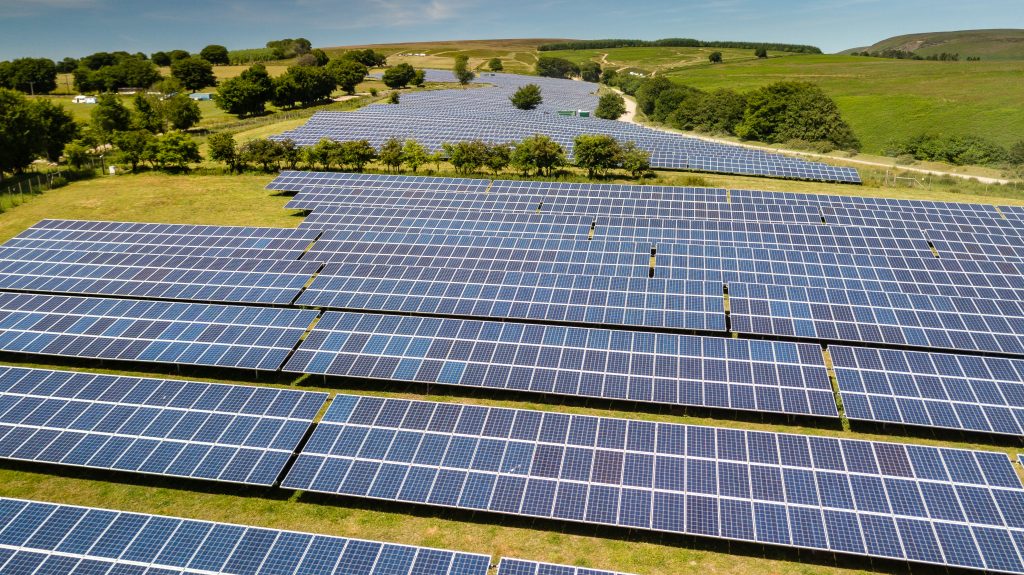
There are a number of ways to make up for shortfalls in wind generation. The most obvious of which is through other existing sources. There is more solar installed around the county than any source of generation (except gas), at 12.9 GW and sun power helped meet demand during a wind drought last summer. Solar averaged 1.3 GW over the last 12 months, this is more than coal which accounted for 1.1 GW.

However, storage will also be important in delivering low or zero-carbon sources of electricity when there is neither wind nor sufficient sunlight. At present this includes pumped storage and some battery technologies, but in future will include greater use of grid-scale lithium-ion batteries, as well as vehicle-to-grid systems that can take advantage of power stored in idle electric cars.

New fuels, particularly hydrogen, also have the potential to meet demand and help create a wider lower-carbon economy for heating, as well as vehicle fuel, with water as the only emission.

Hydrogen can be produced from natural gas or using excess electricity from renewable sources, or through carbon capture from industrial emissions. It can then be stored for a long time and at scale, before being used to generate electricity rapidly when needed.

Another increasingly important source of Great Britain’s electricity is interconnectors. However, they are not yet being used in a way that can support gaps in the electricity system, with Northern European countries normally all experiencing the same weather – and wind levels – at the same time.

Read the full article: What to do when the wind doesn’t blow?

A bigger future for interconnection

Great Britain added a new power source to its electricity system in Q1 2019, in the form of Belgium. The opening of the £600 million NEMO link between Kent and Zeebrugge added another 1 GW of interconnection capacity.

It joins connections to France, the Netherlands, Northern Ireland and the Republic of Ireland to bring Great Britain’s total interconnection capacity to 5 GW. These links accounted for 7.9% of the 78 terawatt hours (TWh) of electricity consumed over the quarter.

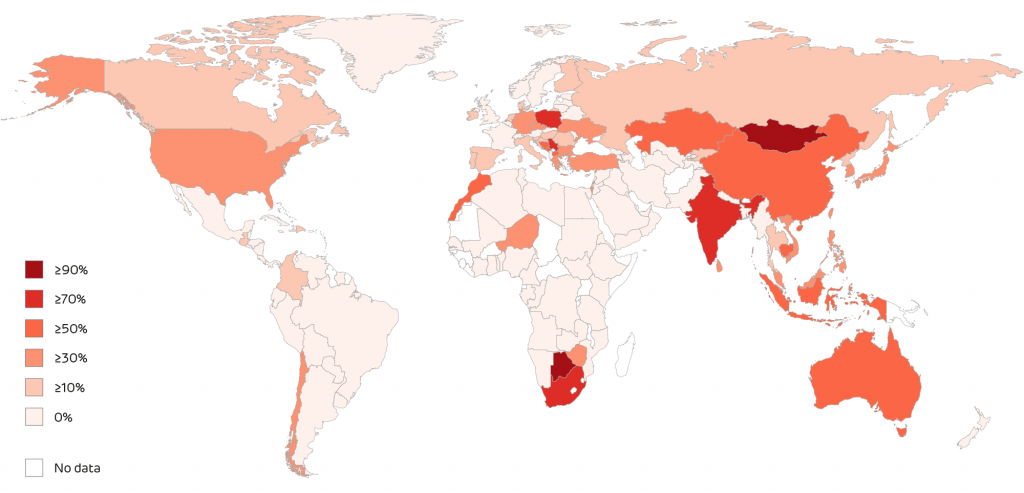
Electricity from imports also set new records for a daily average of 4.3 GW on 24 February, accounting for 12.9% of total consumption, and a monthly average in March when it made up 10.6% of consumption. These records represent the first time Great Britain fell below 90% for electricity self-sufficiency.

With 3.4 GW of new interconnectors under construction coming online by 2022 and 9.1 GW more planned to be completed over the next five years, Great Britain’s neighbours are set to play a growing role in the country’s electricity mix.

However, while interconnectors offer an often cost-effective way for Great Britain to ensure electricity supply meets demand, the carbon intensity of neighbouring countries’ electricity should also be considered.

Read the full article: 10% of electricity now generated abroad

The need for cross-border decarbonisation

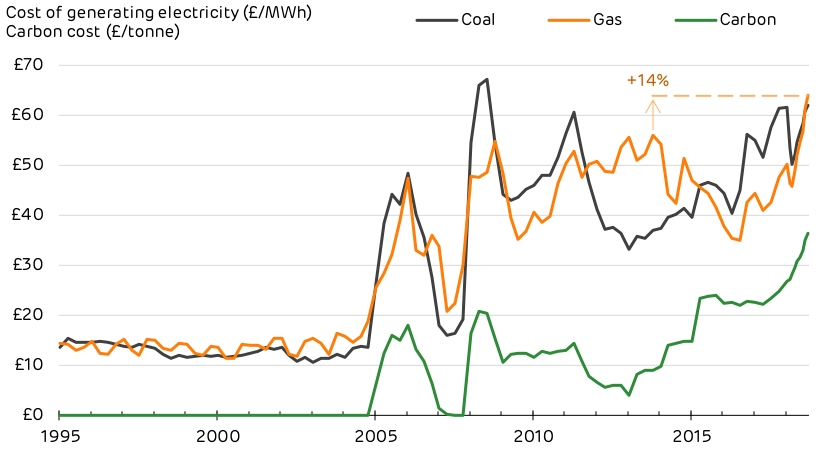
The new link to Belgium has imported, rather than exported, electricity every day since it began operations, as Belgium has the lowest natural gas prices in Europe and its power stations pay £16 per tonne less for carbon emissions than their British counterparts. This makes it cheaper to import, and less carbon intense, than electricity from the more coal-dependant Netherlands and Ireland.

Planned links to Germany and Denmark could allow Great Britain to import more renewable power. However, if there is a wind drought across Northern Europe these countries often turn to their emissions-heavy coal or even dirtier lignite sources.

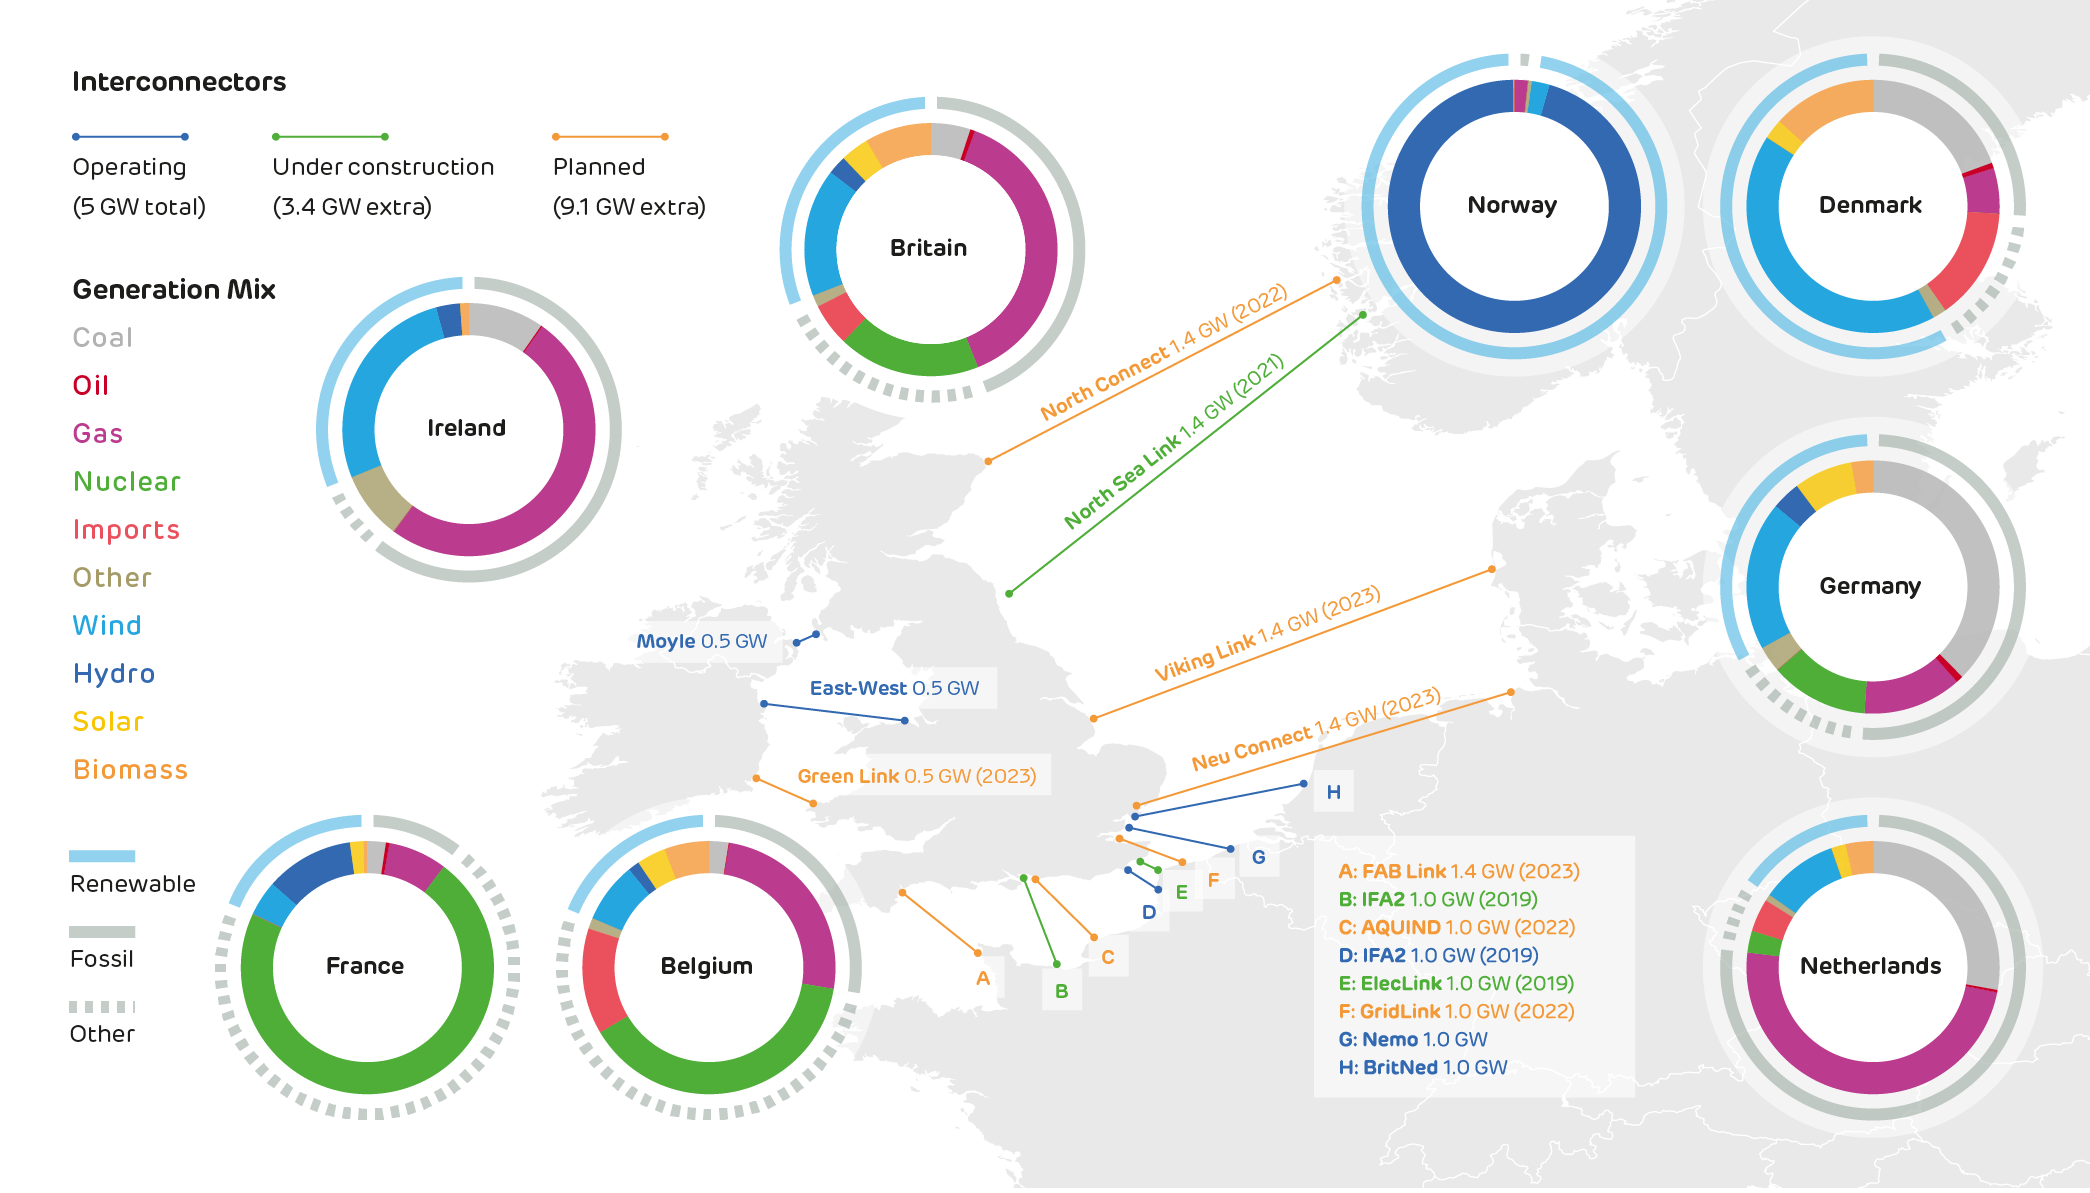
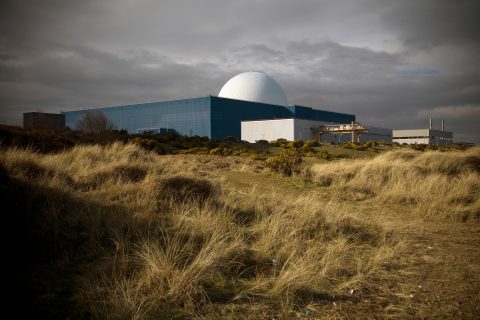
France is currently Great Britain’s cleanest source of imports, mostly using nuclear and renewable generation. However, when the North Sea Link opens in 2021, it will give Great Britain access to Norway’s abundance of hydro-power to plug gaps in renewable generation.

Considering the carbon intensity of Great Britain’s imports is important because the decarbonisation needed to address the global climate change emergency can’t be solved by one country alone. For electricity emissions to go as low as they can it takes collaboration that goes across borders.

Read the full article: Where do Britain’s imports come from?

Explore the quarter’s data in detail by visiting ElectricInsights.co.uk. Read the full report.

Commissioned by Drax, Electric Insights is produced, independently, by a team of academics from Imperial College London, led by Dr Iain Staffell and facilitated by the College’s consultancy company – Imperial Consultants.

Can Great Britain keep breaking renewable records?

How low carbon can Britain’s electricity go? As low as zero carbon still seems a long way off but  every year records continue to be broken for all types of renewable electricity. 2018 was no different.

Over the full 12-month period, 53% of all Britain’s electricity was produced from low carbon sources, which includes both renewable and nuclear generation, up from 50% in 2017.  The increase in low carbon shoved fossil fuel generation down to just 47% of the country’s overall mix.

The findings come from Electric Insights, a quarterly report commissioned by Drax and written by researchers from Imperial College London.

The report found electricity’s average carbon intensity fell 8% to 217 grams of carbon dioxide per kilowatt-hour of electricity generated (g/kWh), and while this continues an ongoing decline that keeps the country on track to meet the Committee on Climate Change’s target of 100 g/kWh by 2030, it was, however, the slowest rate of decline since 2013.

It also highlights that while Britain can continue to decarbonise in 2019, the challenges of the years ahead will make it tougher to continue to break the records it has over the past few years.

The highs and lows of 2018

Last year, every type of renewable record that could be broken, was broken. Wind, solar and biomass all set new 10-year highs for respective annual, monthly and daily generation, as well as records for instantaneous output (generation over a half-hour period) and share of the electricity mix. The result was a new instantaneous generation high of 21 gigawatts (GW) for renewables, 58% of total output.

Wind had a particularly good year of renewable record-setting. It broke the 15 GW barrier for instantaneous output for the first time and accounted for 48% of total generation during a half hour period at 5am on 18 December.

Overall low carbon generation, which takes into account renewables and nuclear (both that generated in Britain and imported from French reactors), had an equally record-breaking year with an average of almost 18 GW across the full year and a new record for instantaneous output of 30 GW at 1pm on 14 June – nearly 90% of total generation over the half hour period.

While low carbon and individual renewable electricity sources hit record highs, there were also some milestone lows. Coal accounted for an average of just 5% of electricity output over the year, hitting a record low in June, when it made up just 1% of that month’s total generation. Fossil fuel output overall had a similarly significant decline, hitting a decade-low of 15 GW on average for 2018 – 44% of total generation over the year.

One fossil fuel that bucked the trend, however, was gas, which hit an all-time output of 27 GW for instantaneous generation on the night of 26 January. There was low wind on that day last year, plus much of the nuclear fleet was out of action for reactor maintenance. In one case, with seaweed clogging a cooling system.

This was all aided by an ongoing decline in overall demand as ever smarter and more efficient devices helped the country reach the decade’s lowest annual average demand of 33.5 GW. More impressive when considering how much the country’s electricity system has changed over the last decade, however, is the record low demand net of wind and solar. Only 9.9 GW was needed from other energy technologies at 4am on 14 June.

How the generation mix has changed

The most remarkable change in Britain’s electricity mix has been how far out of favour coal has fallen. From its position as the primary source from 2012 to 2014, in the space of four years it has crashed down to sixth in the mix with nuclear, wind, imports, biomass and gas all playing bigger roles in the system.


This sudden decline in 2015 was the result of the carbon price nearly doubling from £9.54 to £18.08 per tonne of carbon dioxide (CO2) in April, making profitable coal power stations loss-making overnight. With coal continuing to crash out of the mix, biomass has become the most-used solid fuel in Britain’s electricity system.

Interconnectors are also playing a more significant part in Britain’s electricity mix since their introduction to the capacity market in 2015. Thanks to increased interconnection to Europe, Britain is now a net importer of electricity, with 22 TWh brought in from Europe in 2018 – nine times more than it exported.

While more of Britain’s electricity comes from underwater power lines, less of it is being generated by water itself. Hydro’s decline from the fifth largest source of electricity to the eighth is the most noticeable shift outside coal’s slide. New large-scale hydro installations are expensive and a secondary focus for the government compared with cheaper renewables.

Hydro’s role in the electricity mix is also affected by drier, hotter summers, which means lower water levels. For solar, by contrast, the warmer weather will see it play a bigger role and it’s expected to overtake coal in either 2019 or 2020.

What is unlikely to change in the near-future, however, is the position at the top. In 2018 gas generated 115 TWh – more than nuclear and wind combined. But this is just one constant in a future of multiple moving and uncertain parts.

2019: a year of unpredictability

Britain is on course to leave the EU on 29 March. The effects this will have on the electricity system are still unknown, but one influential factor could be Britain’s exit from the Emissions Trading Scheme (ETS), the EU-wide market which sets prices of carbon emitted by generators. This may mean that rather than paying a carbon price on top of the ETS, as is currently the case, Britain’s generators will only have to pay the new, fixed carbon tax of £16 per tonne the UK government says will come into play in April, topped up by the carbon price support (CPS) of £18/tonne.

Lower prices for carbon relative to the fluctuating ETS + CPS, could make coal suddenly economically viable again. The black stuff could potentially become cheaper than other power sources. This about-turn could cause the carbon intensity of electricity generation to bounce up again in one or more years between 2019 and 2025, the date all coal power units will have been decommissioned.

The knock-on effect of lower carbon prices, combined with fluctuations in the Pound against the Euro, could see a reverse from imports to exports as Britain pumps its cheap, potentially coal-generated, electricity over to its European neighbours. That’s if the interconnectors can continue to function as efficiently as they do at present, which some parties believe won’t be the case if human traders have to replace the automatic trading systems currently in place.

Sizewell B Nuclear Power Station

A reversal of importing to exporting could also reduce the amount of nuclear electricity coming into the country from France. Future nuclear generation in Britain also looks in doubt with Toshiba and Hitachi’s decisions to shelve their respective plans for new nuclear reactors, which could leave a 9 GW hole in the low-carbon base capacity that nuclear normally provides.

Renewables have the potential to fill the gap and become an even bigger part of the electricity system, but this will require a push for new installations. 2018 saw a 60% drop in new wind and solar installations and less than 2 GW of new renewable capacity came onto the system, making it the slowest year for renewable growth since 2010.

Britain’s electricity has seen significant change over the last decade and 2018 once again saw the country take significant strides towards a low carbon future, but challenges lie ahead. Records might be harder to break, but it is important the momentum continues to move towards renewable, sustainable electricity.

Explore the quarter’s data in detail by visiting ElectricInsights.co.ukRead the full report.

Commissioned by Drax, Electric Insights is produced, independently, by a team of academics from Imperial College London, led by Dr Iain Staffell and facilitated by the College’s consultancy company – Imperial Consultants.

Three things last summer tells us about Great Britain’s electric future

Great Britain’s electricity system has had its robustness tested at both ends of the thermometer in 2018. First, the once-in-a-decade low temperatures of the ‘Beast from the East’ saw electricity demand reach its highest peak in three years on 1 March as the country turned on electric heaters and extra lighting.

Following fast on its heels was an unusually hot, dry and still summer that pushed demand up by the equivalent of adding a second Scotland to the system, and required solar generation to make up for a ‘wind drought’. And all of this happened in the first half of the year.

So far the second half of the year has seen fewer instances of freak weather, which has meant fewer peaks in the power system. While uneventful in this sense, the last quarter of Great Britain’s power does go some way towards showing us what we might expect from the system in the future.

The findings come from Electric Insights, an independent report written by researchers at Imperial College London and commissioned by Drax, that analyses the country’s power and hints at what we might expect in the future.

  1. Breaking renewable records will get boring

Quarter after quarter Great Britain breaks new renewable records and Q3 2018 was no exception. The three-month period from July through September saw total capacity of renewable sources exceed fossil fuels for the first time. Great Britain now has 40.6 gigawatts (GW) of gas, coal, diesel and oil-fired power generation capacity, compared to 41.9 GW of capacity from wind, solar, biomass, hydro and waste sources. To put this into perspective, at the start of the decade fossil fuel capacity was seven times that of renewables.

Since 2010 renewables have grown six-fold. Wind passed 20 GW of installed capacity in September and is now the country’s largest renewable source. Solar has slowed in growth but remains the second biggest renewable, with 13 GW of capacity.

Biomass is now the third largest source of renewable electricity thanks to the coal-to-biomass conversions of Lynemouth power station and Drax’s Unit 4, which together added 1 GW more renewable electricity to the system. Along with these conversions, a quarter of the country’s coal capacity retired in the last year, leaving just six generators in operation.

While this shift to renewables is helping decarbonise Great Britain’s power system, the increasing intermittency that comes with it means balancing the grid is becoming more complicated.

Read the full article, co-authored by Luke Clark at RenewableUK: Renewables leapfrog fossil capacity


  1. As balancing the network becomes more complex, it could grow more expensive

The daily cost of running the transmission system – which manages the flow of electricity from generators to consumers – has doubled over the last four years. This growth has been steady since 2010, but Q3 2018 saw the cost reach one-sixth higher than the previous record in Q3 2017. Over this quarter, balancing the system on average cost £3.8 million per day, with three days seeing costs exceed £10 million, in turn adding 6% to the overall wholesale price of electricity.

Part of the reason for the increased costs is that need for balancing services such as voltage control, reserve power and frequency response spike when there are high levels of intermittent renewables (such as wind and solar) on the system. As this type of generation can’t be perfectly calculated it is important for National Grid to ensure there are flexible reserve sources running to plug gaps and help move electricity around the grid, both of which incur balancing costs. For example, in September balancing costs spiked several times as a result of increases in wind power.

The rising price highlights that for the grid to function it’s not just a matter of generating enough electricity to meet demand. Where and when it is generated is as important to maintain its stability, and with ever-increasing levels of intermittent renewables the need for stabilising services will grow.

Read the full article: The cost of staying in balance


  1. The cost of generating electricity may rise, which will have knock on effects

It’s not just balancing costs, however, that are driving up the cost of electricity. Day-ahead market prices have risen by 50% over the last year – from an average of £42/MWh in Q3 2017 to £60/MWh last quarter.

This was not the result of spikes caused by events such as the ‘Beast from the East’ or the summer’s World Cup final, but by a gradual creeping up of prices caused by a combination of increasing gas prices and carbon emissions costs, as well as a weaker pound in the wake of ongoing Brexit negotiations.

Gas power stations are six times more influential on power price than any other generation technology, but with global gas prices rising 50%, the country’s primary source of flexible generation is becoming costlier.

The knock on effect of this 10-year high gas price was not only an impact on consumers’ pockets but also a resurgence in coal, which became cheaper than gas and led to a 15% increase in carbon emissions from electricity generation for a period during the quarter. Adding to this, the European Emissions Trading Scheme (ETS) increased the price of carbon dioxide (CO2) emissions by a factor of four over the past 12 months, pushing up the cost of wholesale electricity even further.

The international nature of the electricity system also makes prices vulnerable to currency fluctuations and a weakening pound made the impact greater. The currency devaluations following the EU referendum are continuing to contribute to this and Ofgem found it caused an 18% increase in electricity prices. This isn’t the referendum’s only effect.

If the UK leaves the EU next year under a no-deal scenario the country would also exit the ETS, removing a component of the current total carbon price. There are plans to replace this with a new tax, adding to the existing UK carbon price support (CPS), but this would only come into effect from April 2019, leaving Q1 with just the CPS – effectively making it cheaper to emit carbon during that three-month period, which in turn adds a risk of more carbon-intensive sources becoming more economically viable than renewable sources.

While there is little Great Britain can do to influence international fuel prices, it can alter domestic policies to influence the price for consumers. Making heavily emitting fuels economically prohibitive and incentivising more lower carbon and renewable sources onto the system, can reduce dependency on imported fuels and cut carbon costs.

Read the full article: Wholesale power prices hit a 10-year high


Explore the quarter’s data in detail by visiting ElectricInsights.co.ukRead the full report.

Commissioned by Drax, Electric Insights is produced, independently, by a team of academics from Imperial College London, led by Dr Iain Staffell and facilitated by the College’s consultancy company – Imperial Consultants.

Coal comeback pushes up UK’s carbon emissions

UK coal production

10-year high gas prices1 have prompted a resurgence in coal-fired power across Britain – and with it a 15% increase in carbon emissions from electricity generation.

If coal-fired electricity remains cheaper than gas-fired (as analysts predict), we could see the first year-on-year rise in carbon emissions from Britain’s power sector in six years. This highlights the importance of retaining a strong carbon price if we are to ensure the successful decarbonisation of the power system is not reversed.

After dropping to a historic low of just 0.2 GW during June and July, Britain’s coal power generation doubled in August, and has shot up to 2 GW during the first week of September.  The last time coal output was this high was during the Beast from the East, when temperatures plummeted in March.

With these coal power stations running instead of more efficient gas plants, Britain is producing an extra 1,000 tonnes of carbon dioxide (CO2) every hour.2  Carbon emissions from electricity generation are up 15% as a result.  These coal plants are not running solely because they are needed to meet peak demand, but because gas prices have risen sharply and carbon prices have not kept up, making coal power stations more economic to run than gas-fired ones.

It became cheaper to generate power from coal than from gas (see thick lines, chart below) in late August.  Even though carbon prices now double the cost of generating electricity from coal,3 coal plants are consistently “in the money” at the moment, meaning they can generate power profitably all day and night.

Estimated cost of generating electricity from coal and gas in Quarter 3 (thick lines), and the output from coal power stations in Britain (thin line)

Estimated cost of generating electricity from coal and gas in Quarter 3 (thick lines), and the output from coal power stations in Britain (thin line)

The cost of emitting CO2 has increased sharply, up 45% so far this year due to the ongoing rally in European Emissions Trading Scheme (EU ETS) prices.  Rising carbon prices should make gas more economical to burn as it emits less than half the CO2 of coal.

However, wholesale gas prices have also risen 40% since the start of the year, as supplies and storage are squeezed in the run up to winter.  Gas prices are at a ten-year high, currently 14% above their previous quarterly-average peak back in 2013 (see chart below).  These rising costs are feeding through into wholesale power prices, which have risen by a third over the past year to hit £60/MWh.

The cost of generating electricity and carbon cost

The estimated cost of generating electricity from fossil fuels over the last 20 years, along with the cost of emitting CO2.

Britain’s carbon price strengthened dramatically through 2014–15 due to the government implementing a Carbon Price Support scheme.  This caused gas to become competitive against coal for power generation, leading to carbon emissions from the power sector halving.  Unless Britain’s carbon price can once again make up the gap between coal and gas prices, we risk rolling back some of the world-leading gains made on cleaning up our electricity system.

The Committee on Climate Change has made it clear that power is the only sector that is pulling its weight when it comes to decarbonising the UK.  Clean electricity could power low-carbon vehicles and heating, but this opportunity will be wasted if the electricity comes from high-carbon coal.

UK electricity system

So what can be done?  The sharp rise in gas prices hints at a lack of flexibility in the energy system.  Britain came uncomfortably close to gas shortages in March, in part due to the closure of the country’s largest gas storage site.  With nearly half of the electricity generated in Britain coming from gas, plus five-sixths of household heat, diversifying into other – cleaner – energy sources would help insulate consumers and businesses from price spikes.

No one country has the power to determine international fuel prices.  Several factors have come together to push up gas prices, including a lack of transmission capacity, depleted stores of gas after the long hot summer and a lack of wind power increased output from gas-fired stations. Suppliers which don’t wish to be caught short after the Beast from the East, are also stocking up on gas.

Any knee-jerk reaction to try and lower the cost of electricity (for example, slashing the cost of carbon emissions) may only have a short-term impact, and could easily lead to longer-term damage (such as the resurgence of coal) which would require further interventions in the future.

Britain does have control over its carbon price. Its power stations and industry currently pay the Emissions Trading System price (determined on the Europe-wide market) which has fluctuated wildly over the past week between €25 (£22) and €19 (£17) per tonne, plus £18 per tonne in Carbon Price Support which goes to the Treasury.  This needs to be maintained or strengthened further to save the power system from backsliding, and to show strong climate leadership on the international stage.

Explore this data live on the Electric Insights website

View Drax Power CEO Andy Koss’ comment

Commissioned by Drax, Electric Insights is produced independently by a team of academics from Imperial College London, led by Dr Iain Staffell and facilitated by the College’s consultancy company – Imperial Consultants.


[1] The three-month average cost of generating electricity from gas exceeded £60/MWh for the first time since 2009.  Short-term price spikes have been higher than this, such as the first week of March during the Beast from the East.

[2] Extra generation from coal reduces the output from gas plants, which are their main competitors, as nuclear, wind and solar already run as much as possible.  Calculation based on 1934 MW of coal generation (the average during the first week of September) emitting 937 gCO2 per kWh (1812 tonnes per hour) instead of gas generation which would have emitted 394 gCO2 per kWh (762 tonnes per hour).

[3] The coal that must be burnt to produce 1 MWh of electricity now costs around £31, and the CO2 pollution costs an extra £31 on top.  For comparison, producing 1 MWh of electricity from gas costs £50 for the fuel and £15 for the CO2.

Great Britain is almost ready for coal-free summers

Every summer Great Britain uses less and less coal. This June the fossil fuel’s share of the electricity mix dipped below 1% for the first time ever – for 12 days it dropped all the way to zero.

Spurred on by the beginnings of an uncharacteristically dry, hot summer and a jump in solar generation, the possibility of the country going entirely coal-free for a full summer now looks more achievable than ever in modern times.

This is one of the key findings from Electric Insights, a quarterly report commissioned by Drax and written, independently, by researchers from Imperial College London. It found that across Q2 2018, there were as many coal-free hours as in the whole of 2016 and 2017 combined.

And while the report’s findings are hugely positive, they also hint at where development is still needed. What else does the performance of this quarter tell us about what we can expect in the power sector – in Great Britain and around the world?

Great Britain is slashing coal generation, the rest of the world needs to catch up

Great Britain has reduced its coal-fired power generation by four-fifths over the last five years. Last quarter the country’s coal fleet ran at just 3% of its 12.9 gigawatt (GW) capacity. Coal capacity is now lower than the capacity of solar PV panels (13.1 GW) installed nationwide, with the most recent decline resulting from Drax’s conversion of a fourth unit from coal to biomass.

When coal generation was running, it primarily provided system balancing services overnight in May and June rather than baseload electricity. However, this positive trend is not seen around the world.

The share of coal in national power systems during 2017

Globally, coal still provides 38% of the world’s electricity – the same amount it did 30 years ago. This comes despite efforts in Europe and North America to move away from coal, and growing investment into renewable generation and technologies.

Overall, Europe’s coal generation dropped from 39% to 22% over the last 30 years, despite some countries – such as Poland and Serbia – still drawing significant generation from the fossil fuel. The US has also reduced its coal generation from 57% to 31% over the past 30 years, as natural gas proves more economical, even in an era of pro-coal policies.

Coal train at rail station in India.

However, in the Middle East and Africa (which draw significant generation from their oil and gas reserves) and South America (where coal accounts for less than 3% of generation), total coal generation is growing. In fact, globally, only seven countries use less coal today than 30 years ago: Germany, Poland, Spain, Ukraine, the US, Great Britain and Canada.

Electric Insights attributes part of this global growth to the continued increase in demand for electricity, particularly in Asia. China, South Korea and Indonesia collectively burn 10 times more coal than they did 30 years ago. India’s coal habit has also increased over the past decade to account for 76% of its electricity generation, while Japan’s usage has grown from 15% to 34% in the same period.

As well as the stresses created by growing demand, this highlights a global disparity in the approach to decarbonising electricity systems, and a need for longer-term, environmentally and socially-conscious market-based initiatives that encourage meaningful movement to lower-carbon electricity sources, such as the UK and Canada’s Powering Past Coal Alliance.

Read the full articles here:

(Lack of) progress in global electricity generation

Britain edges closer to zero coal

Solar farm in South Wales

Decarbonisation is growing, but it’s going to get harder

Great Britain’s decline in coal use has rapidly accelerated its decarbonisation efforts. Annual coal power station emissions have shrunk over the past five years from 129 to 19 million tonnes of CO2 and helped reduce the average carbon intensity of electricity generation to a record low of 195 g/kWh last quarter.

However, this rapid pace of decarbonisation is unlikely to be sustained as growth in renewables faces a plateau, the country’s current nuclear capacity reaches retirement and the target of moving beyond coal by 2025 is completed.

Renewable sources now account for a steady 25% of annual electricity generation. These sources largely came onto the system through policies such as the government’s Renewables Obligation, which is now closed to entrants; Contracts for Differences, the future of which is uncertain for mature technologies like onshore wind and solar; and Feed-in Tariffs for roof-top solar installations which will close in April 2019. The end of these initiative paints a hazy picture of how future renewable capacity will be brought into the system.

Nuclear capacity also looks unlikely to expand at the rate needed to plug gaps in demand, with half of the country’s fleet expected to close for safety reasons by 2025. The Hinkley Point C nuclear power station, meanwhile, is only expected to come online at the end of that year.

Read the full article here:

Has Britain’s power sector decarbonisation stalled?

Ramsgate, Kent during summer 2018 heatwave

Weather will continue to play a major part in renewable generation

If the first quarter of 2018 was defined by low temperatures and heavy snowfall, the second quarter saw the impact of the opposite in weather conditions. From 23 June a heatwave set in around the country that saw temperatures increase by 3.3oC in a week, driving demand to jump 860 MW – the equivalent of an extra 2.5 million households, or an area the size of Scotland.

The increase in demand isn’t as drastic as when cold fronts hit, but if summers continue to get hotter this could change. Today, winter-time demand increases by 750 MW for every degree it drops below 14oC as electric heaters are plugged in to aid largely gas-based central-heating systems. When the mercury rises, however, demand increases by 350 MW for every degree rise over 20oC as businesses turn on air conditioning and the country’s refrigerators work harder.

These heatwave spikes are, at the moment, more easily dealt with than winter storms. While the Beast from the East saw demand reaching a peak of 53.3 GW, June’s topped out at 32.5 GW. The clear skies and long days of June also meant solar PV generation soared, making up for the ‘wind drought’ caused by the high-pressure weather. Wind output floated between 0.3 GW and 4.3 GW in June, far below its quarter peak to 13 GW. However, solar made up for this by peaking past 8 GW for 13 days in June and setting a new record of 9.39 GW at lunchtime on 27 June.

Read the full articles:

How the heat wave affects electricity demand

The summer wind drought and smashing solar

Explore the data in detail by visiting ElectricInsights.co.ukRead the full report.

Commissioned by Drax, Electric Insights is produced, independently, by a team of academics from Imperial College London, led by Dr Iain Staffell and facilitated by the College’s consultancy company – Imperial Consultants.

How the heatwave affects electricity demand

16.5 degrees is the Goldilocks temperature for the Brits – not hot enough for air-con, not too cold to put the heating on. In March we saw how the Beast from the East caused a surge in demand, now the long summer heatwave is doing the same.

June 23rd marked the start of the heatwave, with daytime temperatures surpassing 30°C in Scotland and Wales. The last week of June was 3.3°C warmer than the previous week, and demand was 860 MW higher (see chart below). This rise is equivalent to power demand from an extra 2.5 million households.

This reflects the growing role of air conditioning and refrigeration in shops, and cooling for data centres. Global electricity demand from cooling is rising dramatically, and is seen as a ‘blind spot’ in the global energy system.  This will become more important as global temperatures, and more importantly, global incomes rise. However, it is easier to deal with than cold spells during winter because demand is low and solar PV output is high.

Below 14°C, demand increases by 750 MW for every degree it gets colder as buildings need more heating. Around a tenth of British homes have electric heating, as do half of commercial and public buildings. And while the UK is not synonymous with air conditioners, demand rises by 350 MW for each degree that temperature rises above 20°C.

This effect may well grow stronger in the coming years. National Grid expect that the peak load from air conditioners will triple in the coming decade. Perhaps events such as the current prolonged heatwave may spur more households to invest in air conditioning.

Read the press release

Explore power grid data during the heatwave beginning 23rd June

Commissioned by Drax, Electric Insights is produced independently by a team of academics from Imperial College London, led by Dr Iain Staffell and facilitated by the College’s consultancy company – Imperial Consultants.

The quarter when weather dictated Great Britain’s electricity

As summer arrives in Great Britain, bringing the hottest May Day Bank Holiday on record, it’s hard to believe March saw the coldest spring day since records began. But that’s exactly what happened during the six days the ‘Beast from the East’ hit Europe.

From 26 February to 3 March Great Britain’s weather sunk to a once-in-a-decade level of cold, dipping on 1 March when thermometers dropped to an average of -3.8 degrees Celsius across central England. These extreme conditions drove electricity demand up 10%, as darker days required extra lighting and more people plugged in energy-intensive electric heaters to keep warm.

After successive years of milder winters, January to March made for a period in which the weather played a pivotal role in dictating how the country’s electricity was generated, according to Electric Insights, a quarterly report commissioned by Drax and written by researchers from Imperial College London.

The report highlights how despite the storm disrupting power transmission in parts of the country, and sensationalist headlines suggesting lights could go out at any moment, the electricity system held up well in the adverse conditions.

The Beast from the East tests energy security

The sub-zero temperatures, brutal wind and Siberian-level snow blizzards that hit Great Britain for six days between February and March proved a real test for the electricity system. The evening of 1 March saw demand reach 53.3 GW – its highest peak in three years. This had a knock-on effect on the hour-ahead price of electricity, which was 50% higher during March than the same period in 2017.

The weather had a notable impact on the types of generation needed to power the county, with fossil fuels playing an important role at the expense of carbon emission levels. Over the six-day cold spell, fossil fuels averaged between 20-25 GW of electricity generation.

Coal accounted for almost 10% of the total electricity mix across the quarter, in part because of rising gas prices, which made it a more economical fuel. Gas, however, remained the biggest power source accounting for just shy of 40% of all electricity.

What is most significant about this Q1 2018 fossil fuel usage, is that even in such extreme weather, coal and gas generation was still 16% and 2% lower, respectively, than the same quarter in 2017.

This drop is the result of increased renewable capacity allowing wind generation to grow by almost 40% and make up just short of 20% of the electricity mix.

Read the full articles here: 

Rampant wind leads renewable generation

The conditions brought by the storm where particularly favourable to wind generation, which hit new peak-generation levels of 13 GW on 17 January and then 14 GW on 17 March. Over the full quarter wind power production reached 15,560 GWh, 30 GWh more than nuclear, the nearest low carbon source. This increase comes in part as a result of a 19% increase in installed capacity around the country since Q1 2017, but also thanks to the grid getting better at making use of it.

During the six sub-zero days of the quarter, wind contributed a minimum of 4.4 GW, crucial at a time when other power sources appeared vulnerable. For example, heavy snowfall blocked solar panels from the sun leaving it contributing just 2% of the electricity mix over the quarter.

Nuclear power fared better and made up just shy of 20% of generation, but was held back by two routine reactor maintenances while a third shut on the quarter’s coldest day due to seaweed clogging a plant’s cooling system. Biomass ran solidly throughout the cold spell, contributing 4% of the total electricity generation mix.

The opening of a new 2.2 GW cable connecting Scotland – where there is 7.7 GW of installed capacity – to North Wales saved National Grid some £9 million a month in constraint payments across the first quarter.

Read the full articles:

Did the country almost run out of gas?

One of the most headline-grabbing events from the cold spell was National Grid’s decision to issue a ‘Gas Deficit Warning’ on the morning of 1 March, suggesting supplies could run out before the end of the day.

With 83% of British households depending on gas for heating and gas turbines accounting for a significant portion of the country’s electricity generation, the announcement drew considerable press attention.

However, National Grid explained domestic gas users would unlikely be impacted and it would work with industrial partners to make more gas available to meet demand. This clearly had the desired effect, with as much as 19 GW of spare gas capacity ending up available that day. The warning was withdrawn the following morning and gas generation averaged 11 GW, more than any other source, between 26 February and 3 March.

Nevertheless, European-wide demand for gas sent prices soaring and making it more economical to burn coal, which generated roughly 10 GW a day on average over the six-day period of 26 February to 3 March.

Read the full article: Running low on gas

The extreme weather of Q1 2018 highlighted the stability of Great Britain’s overall power system. But even as the country continues to move towards greater renewable generation, fossil fuels continue to play an important part of electricity mix when demand peaks.

Explore the data in detail by visiting ElectricInsights.co.uk. Read the full report.

Commissioned by Drax, Electric Insights is produced independently by a team of academics from Imperial College London, led by Dr Iain Staffell and facilitated by the College’s consultancy company – Imperial Consultants.

The Beast from the East

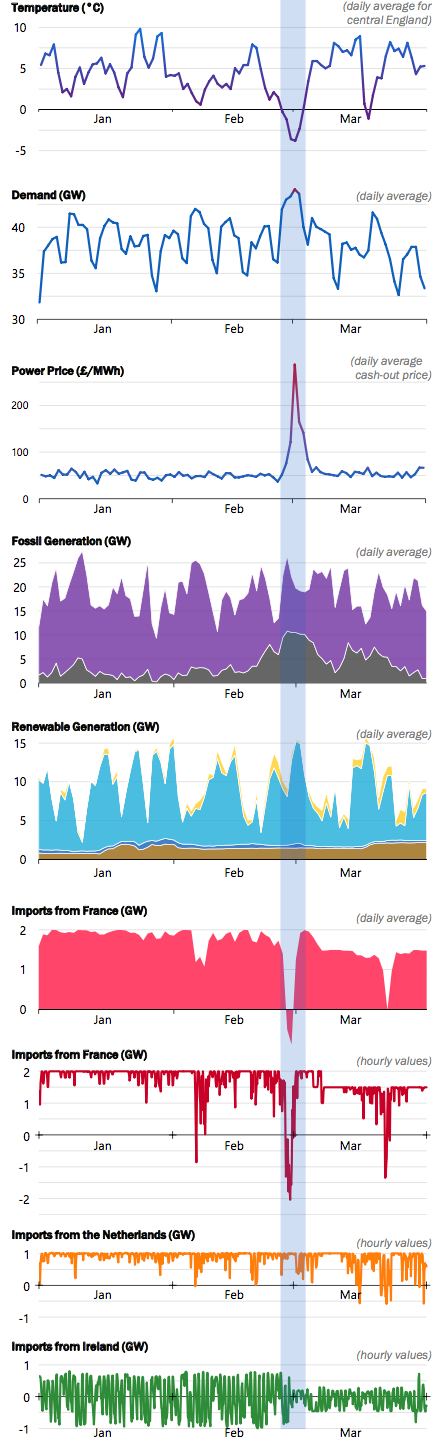
Thursday 1 March was the coldest spring day on record, averaging –3.8°C. The six days from 26 February to 3 March (highlighted in blue) were the coldest Britain has been since Christmas 2010.

This pushed electricity demand up 10%, as people used more electric heating to keep warm. The evening peak demand on 1 March was the highest in three years, and so was not stretching the system to its limits.

Electricity prices rose to five times the average for the quarter. They peaked at £990 per megawatt hour (MWh) for half an hour, and also fell to –£150 per MWh as the market became volatile.

Coal generation surged for the weeks surrounding the cold spell. Not because more output from conventional plants was needed, but rising gas prices made it more economical to burn than gas. Total generation from fossil fuels remained around 20–25 GW.

Biomass and hydro ran solidly throughout the cold spell. Wind output was particularly high when it was most needed, ranging from 11.8 to 13.8 GW during 1 March. Whilst wind certainly helped, the lights would not have gone off without it, as up to 19 GW of spare gas capacity was available if needed.

Britain’s links to other countries were not so helpful. We exported to France through much of the cold spell. French electricity demand is more impacted by temperature than British, as more French homes use electric heating.

Looking in more detail at the UK’s links to other countries:

  • Britain had been largely importing from France all year, but then exported solidly through 27–28 February, when power prices were higher in France.
  • Prices remained lower in the Netherlands, so Britain continued importing from them.
  • Britain and Ireland traded power back and forth to help balance their systems. On 3 March the East-West link between North Wales and Dublin was taken offline for (unrelated) maintenance.

Download the PDF version

Read the press release

Explore this data live on the Electric Insights website

Commissioned by Drax, Electric Insights is produced independently by a team of academics from Imperial College London, led by Dr Iain Staffell and facilitated by the College’s consultancy company – Imperial Consultants.

How Great Britain’s breakthrough year for renewables could have powered the past

After a year of smashing renewable records, Great Britain’s electricity system is less dependent on fossil fuels than ever before. Over the course of 2017, low-carbon energy sources, including nuclear as well as renewables, accounted for half of all electricity production.

The finding comes from Electric Insights, a quarterly research paper on Britain’s power system, commissioned by Drax and written by researchers from Imperial College London. The latest report highlights how Great Britain’s electricity system is rapidly moving away from fossil fuels, with coal and gas dropping from 80% of the electricity mix in 2010 to 50% in 2017.

It’s an impressive change for eight years, but it’s even more dramatic when compared to 60 years ago.

Powering the past with renewables

In 2017 renewable output grew 27% over 2016 and produced 96 terawatt hours (TWh) of electricity –  enough to power the entire country in 1958.

Back then Great Britain was dependent on one fuel: coal. It was the source of 92% of the country’s power and its high-carbon intensity meant emissions from electricity generation sat at 93 million tonnes of carbon dioxide (CO2). Compare that to just three million tonnes of CO2 emissions from roughly the same amount of power generated in 2017, just by renewables.     

Today the electricity system is much more diverse than in 1958. In fact, with nuclear added to renewable generation, 2017’s total low-carbon capacity produced enough power to fulfil the electricity needs of 1964’s Beatlemania Britain.

But what’s enabled this growth in renewable generation? One answer, as Bob Dylan explained a year earlier, is blowin’ in the wind.

Read the full article here: Powering the past.


Stormy weather powering Great Britain

Wind power experienced a watershed year in 2017. Thanks to blusterier weather and a wave of new wind farm installations coming online, wind generation grew 45% between 2016 and 2017.

Windfarms, both onshore and offshore, produced 15% of the entire country’s electricity output in 2017, up from 10% in 2016. The 45 TWh it generated over the course of the year was almost double that of coal – and there’s potential for this to increase in 2018 as more capacity comes online.

The 1.6 gigawatts (GW) of new offshore wind turbines installed in Great Britain last year accounted for 53% of the net 3.15 GW installed across Europe. With large offshore farms at Dudgeon and Race Bank still being commissioned, the 3.2 GW of total new operating capacity registered in 2017 across offshore as well as onshore wind is on course to grow.

Co-author of the article, RenewableUK’s Head of External Affairs Luke Clark, said:

“These figures underline that renewables are central to our changing power system. Higher wind speeds and a jump in installed capacity drove a dramatic increase in the amount of clean power generated. Alongside breaking multiple records for peak output, wind energy continued to cut costs.”

As wind power is dependent on weather conditions, it is intermittent in its generation. But in 2017, more than one storm offered ideal conditions for wind turbines. During Q4 there were three named storms as well as the remnants of a hurricane all battering the British Isles, all of which helped push average wind speeds 5% higher than in 2016. While calculating wind power based on wind speed is complex, windier weather means more power – monthly average wind speed is proportional to monthly average power output from wind farms.

While the 2017 annual average wind speed of 10.1mph, was in line with the country’s long-term average, wind generation was not consistent across the year. In Q4 wind output was close to an average of 7 GW. By contrast, between May and August it was closer to 4 GW. Thankfully these calmer months saw longer hours of daylight, allowing solar power to compensate.

Read the full article here: Wind power grows 45%


Driving down carbon emissions

The knock-on effect of an increase in renewable generation is a drop in the carbon intensity of electricity production and in 2017 this reached a new low.

Across the year, carbon emissions, including those from imported sources, totalled 72 million tonnes, down 12% from 2016. This decrease is equal to 150 kg of CO2 saved per person, or taking 4.7 million cars off the roads. The least carbon intensive period of the quarter came just after midnight in the early hours of Monday 2 October, when it measured a record low of 56 grammes per kilowatt hour (g/kWh) thanks to low fossil fuel generation and high levels of renewables.

Over the whole year there were 139 hours when carbon intensity dipped below 100 g/kWh. This generally required 50% of the electricity mix to come from renewable sources and demand to be lower than 30 GW. For carbon intensity to dip under 100 g/kWh on a more permanent basis, greater renewable capacity will be required as demand rises.

Read the full article here: Carbon emissions down 12%


Interconnectors meeting future demand

Electricity demand in Great Britain has been on the decline since 2002, primarily due to more efficient buildings and appliances, and a decline in heavy manufacturing. However, this is expected to change over the coming years as more electric vehicles are introduced and the heating system is electrified to help meet 2050 carbon emissions targets.

While installing greater renewable capacity will be crucial in meeting this demand with low-carbon power, interconnectors will also play a significant role, particularly from France, which boasts a large nuclear (and low-carbon) capacity.

However, electricity sales through interconnectors are often based on day-ahead prices rather than the live market, which can lead to trades that aren’t reflective of demand on each sides of the channel.

In Q4 there were eight half-hours when demand was very high (more than 50 GW), yet power was being exported. This occurred despite day-ahead prices suggesting traders would lose money due to lower demand in France and the cost of using the interconnector. It highlights the need for improvements in inter-network trading as Great Britain increases its intermittent renewable generation and looks to a greater reliance on importing and exporting power.

Read the full article here: Moving electricity across the channel


Great Britain’s electricity system continues to break its renewable records each year and heading into 2018 this is likely to continue. Wind and solar power will continue to grow as more installations come online and a fourth coal unit at Drax will be upgraded to sustainable biomass, which could lead to another breakthrough year. Regardless, 2017 will be a tough one to beat.

Explore the data in detail by visiting ElectricInsights.co.uk

Commissioned by Drax, Electric Insights is produced independently by a team of academics from Imperial College London, led by Dr Iain Staffell and facilitated by the College’s consultancy company – Imperial Consultants.