


For an hour over lunch on Wednesday, 7th June, more than 50% of Britain’s electricity came from renewables. It was only the second time this had ever happened – the first had come just two months earlier, in April.
The second quarter (Q2) of 2017 was a period largely made up of firsts for Britain’s electricity system. While there were only two instances of renewable power tipping the 50% mark between April and June, overall, wind, solar, biomass and hydro energy made up more than a quarter of all Britain’s electricity for the first time ever.
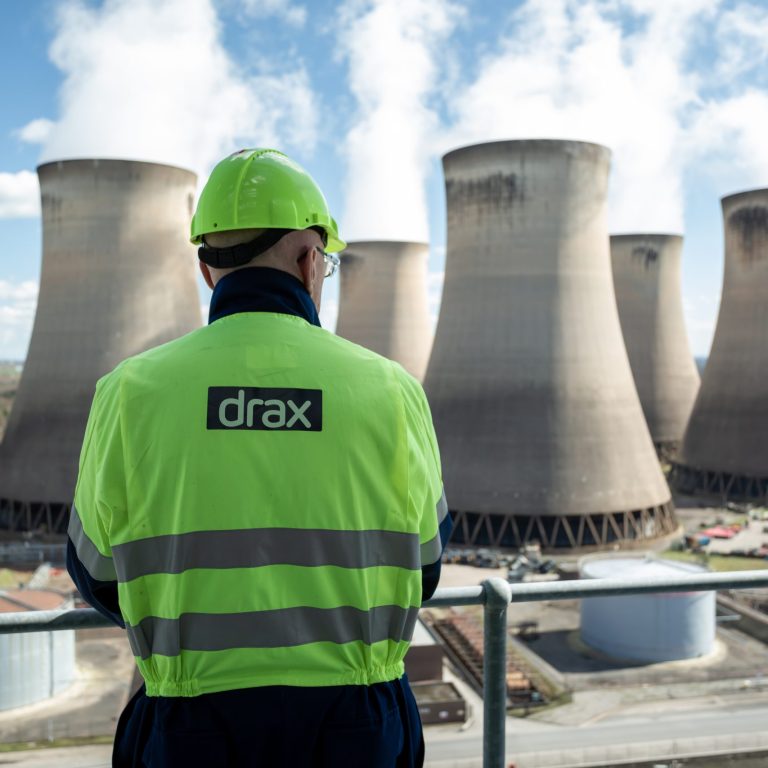
These findings come from Electric Insights, research on Britain’s power system, commissioned by Drax and written by top university academics. Over the past year, the quarterly report has shown breaking renewable records is becoming the new normal for Britain’s electricity. Last quarter was no different.
Here, we look at the key findings from Q2 2017 and what they mean for the changing nature of the energy sector.

More than half Great Britain’s electricity came from renewables. Twice
Wind, solar, biomass and hydro accounted for 51.5% of the UK’s electricity for an hour on 7th June, generating 19.1 gigawatts (GW). Combined with nuclear power and imports from France, low-carbon output was a record 28.6 GW – a massive 89% of total demand. This followed 30th April, when Britain’s electricity edged over the 50% renewable mark for a shorter, but no less significant, period.
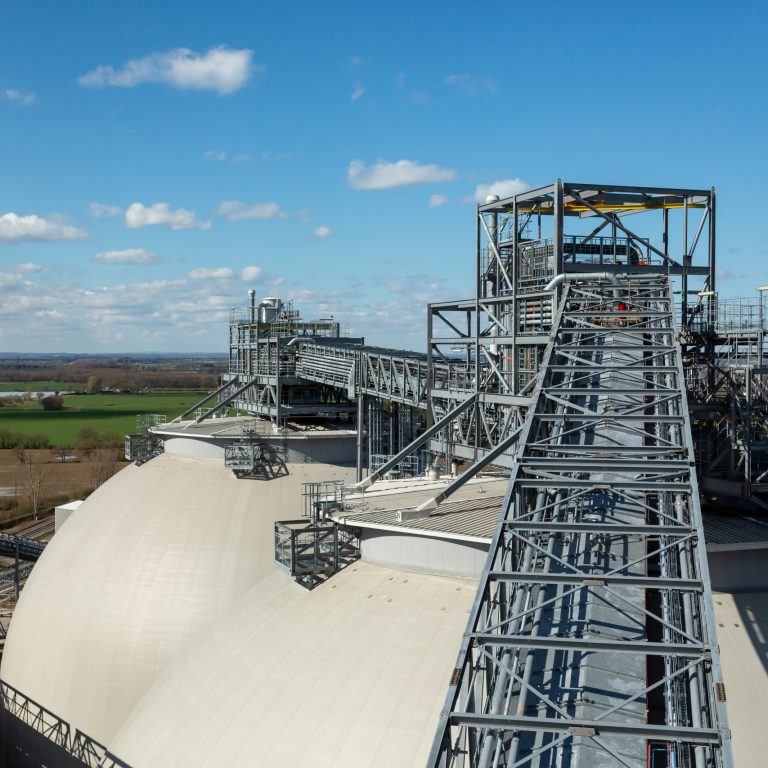
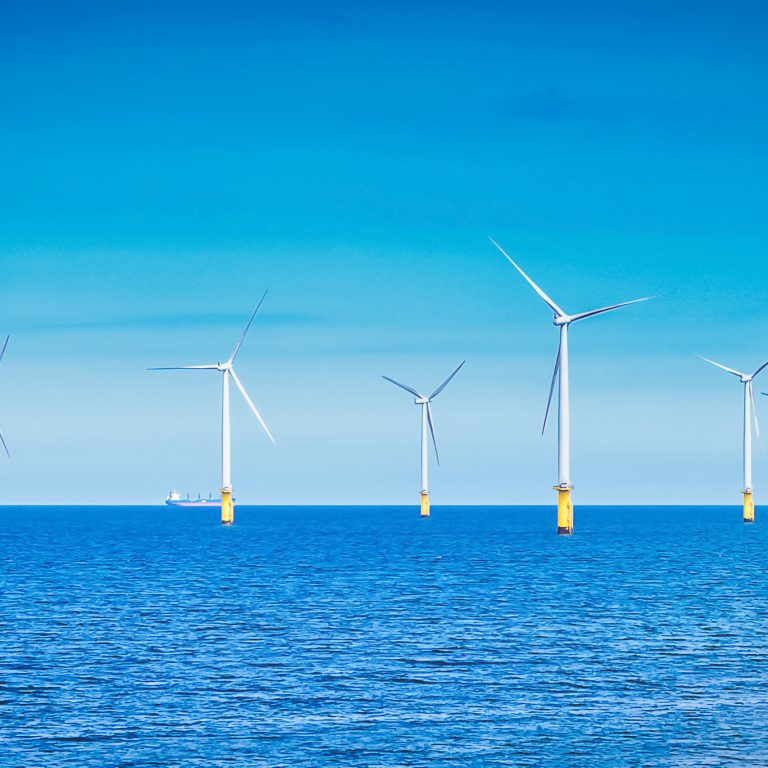
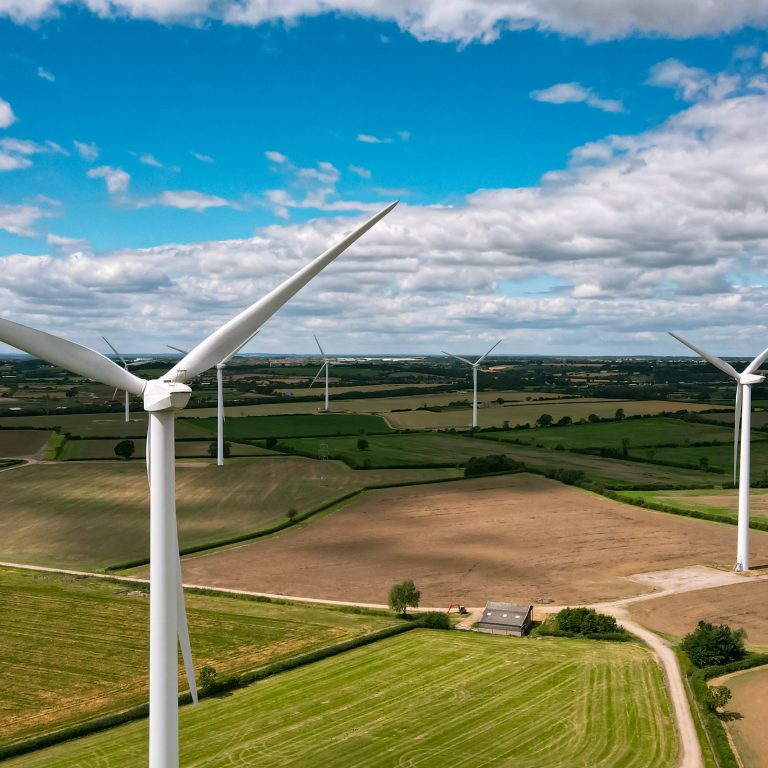
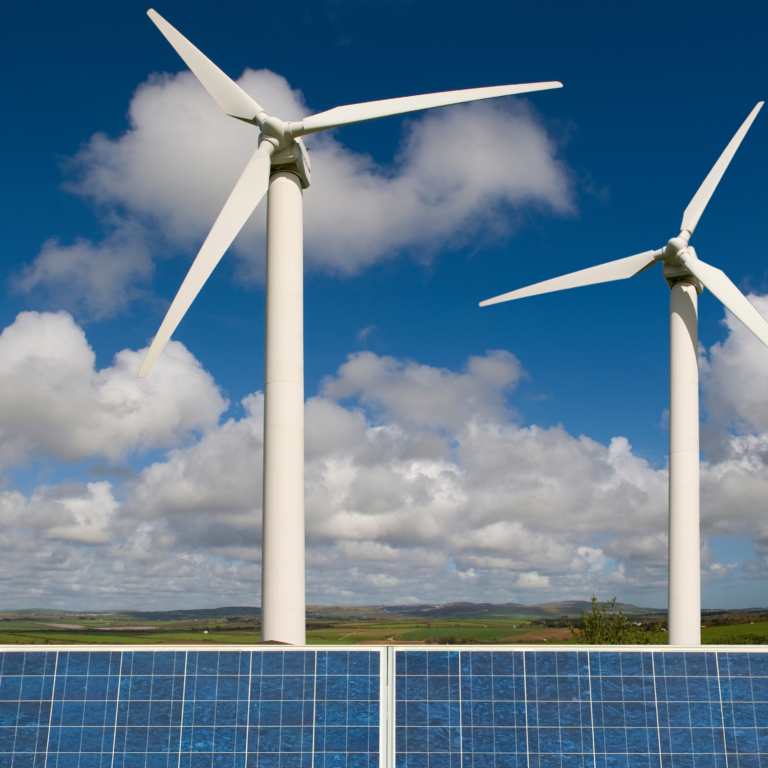
The percentage of renewables making up our power supply is set to grow as additional renewable capacity comes onto the grid. There is currently 6 GW of additional wind capacity being constructed in Britain. Solar capacity has already hit 12.4 GW – more solar panels than analysts thought would be installed by 2050. Plans to convert more of Britain’s coal units to biomass will increase the availability of renewable power further, still.
Electricity was cleaner than ever
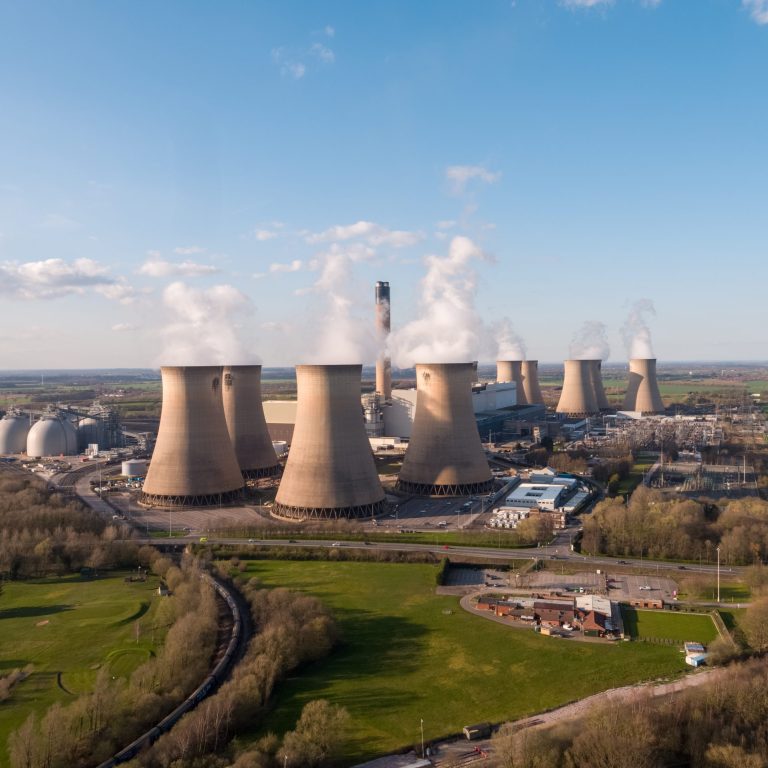
There was a key date in the history of coal during Q2. On 21st April, Britain recorded the first full day it had gone without burning any coal since 1882 – the year Holborn Viaduct power station became the world’s first coal-fired public electricity station.
While that date is symbolic of the UK’s shift away from coal, in practice, it means carbon emissions are also dropping to historically low levels. Carbon intensity reached a new low in Q2, averaging 199 g/kWh over the quarter – 10% lower than the previous minimum set last year. For context, carbon intensity averaged 740 g/kWh in the 1980s and 500 g/kWh in the 2000s.
An important indicator of this falling carbon intensity is that Britain’s electricity now regularly drops below 100 g/kWh, and reached an all-time low of 71 g/kWh on the sunny and windy Sunday of 11th June.

Electric cars are cleaner than before
One of the greatest decarbonisation challenges moving forward is how we transform transport. Electrification is the primary driver of change in this sector, and Q2 saw Britain hit a significant milestone as the total number of electric vehicles (EVs) in the country surpassed 100,000.
The potential of EVs in cleaning up transport is significant, but there are also concerns they could, in some cases, increase CO2 levels due to pollution from power stations. However, as the last quarter’s data shows, EVs are in fact twice as carbon efficient as conventional cars thanks to the amount of renewable and low carbon electricity on the system.
“According to our analysis, looking at a few of the most popular models, EVs weren’t as green as you might think up until quite recently,” says Dr Iain Staffell From Imperial College London. “But now, thanks to the rapid decarbonisation of electricity generation in the UK they are delivering much better results.”
The most solar power a quarter has ever seen
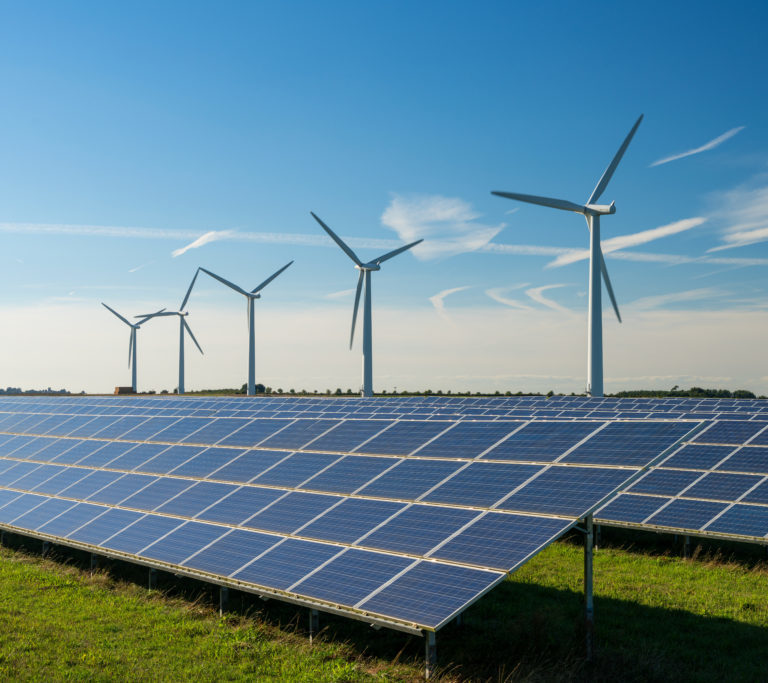
The longer days in Q2 enabled solar power to become a key source of electricity, and for eight hours over the quarter it generated more than all fossil fuels combined. It also set output records by supplying 25% of total demand on 8th April, and producing 8.91 GW on 26th May.
While wind remains the largest source of renewable energy generation in the UK, solar’s influence is growing – especially as decentralisation of the power system continues to proliferate.
Of Britain’s 12.4 GW solar capacity, 57% is concentrated in 1,400 solar farms of around 5 MW each, while the rest is distributed across almost one million rooftop arrays in homes, businesses and other institutions. In fact, during June, 10% of all Britain’s electricity came from these sorts of decentralised sources – sources of power not on the national grid.
This is unlikely to spell a fundamental shift to an entirely decentralised power grid in the short term, but it does hint at the changes the sector is seeing. From its carbon profile, to its variety, to its flexibility, Britain’s power system is changing – and that’s a good thing.
Explore the data in detail by visiting ElectricInsights.co.uk
Commissioned by Drax, Electric Insights is produced independently by a team of academics from Imperial College London, led by Dr Iain Staffell and facilitated by the College’s consultancy company – Imperial Consultants.