


Electric Insights Quarterly
We believe investing in our people goes hand-in-hand with enabling the green energy transformation and positive future growth.
Information about our business, partnerships and campaigns, as well as photos, graphics and multimedia assets for journalists, and educational materials for schools.
We believe investing in our people goes hand-in-hand with enabling the green energy transformation and positive future growth.
Information about our business, partnerships and campaigns, as well as photos, graphics and multimedia assets for journalists, and educational materials for schools.
We’re committed to enabling a zero carbon, lower cost energy future through engineering, technology and innovation.
We’re building for a sustainable future in how we source our biomass, generate energy, remove carbon dioxide and function as a business.
Read our carbon capture, sustainable bioenergy and power generation stories, as well as thinking from Drax’s leaders and business updates.
Drax Group’s ambition is to become a carbon negative business by 2030, through innovative greenhouse gas removal technology.

https://electricinsights.co.uk/

31 August 2020

Emissions are at their lowest in modern times, having fallen by three-quarters compared to the same period ten years ago. The average carbon emissions fell to a new low of 153 grams per kWh of electricity consumed over the quarter.
The carbon intensity also plummeted to a new low of just 18 g/kWh in the middle of the Spring Bank Holiday. Clear skies with a strong breeze meant wind and solar power dominated the generation mix.
Together, nuclear and renewables produced 90% of Britain’s electricity, leaving just 2.8 GW to come from fossil fuels.
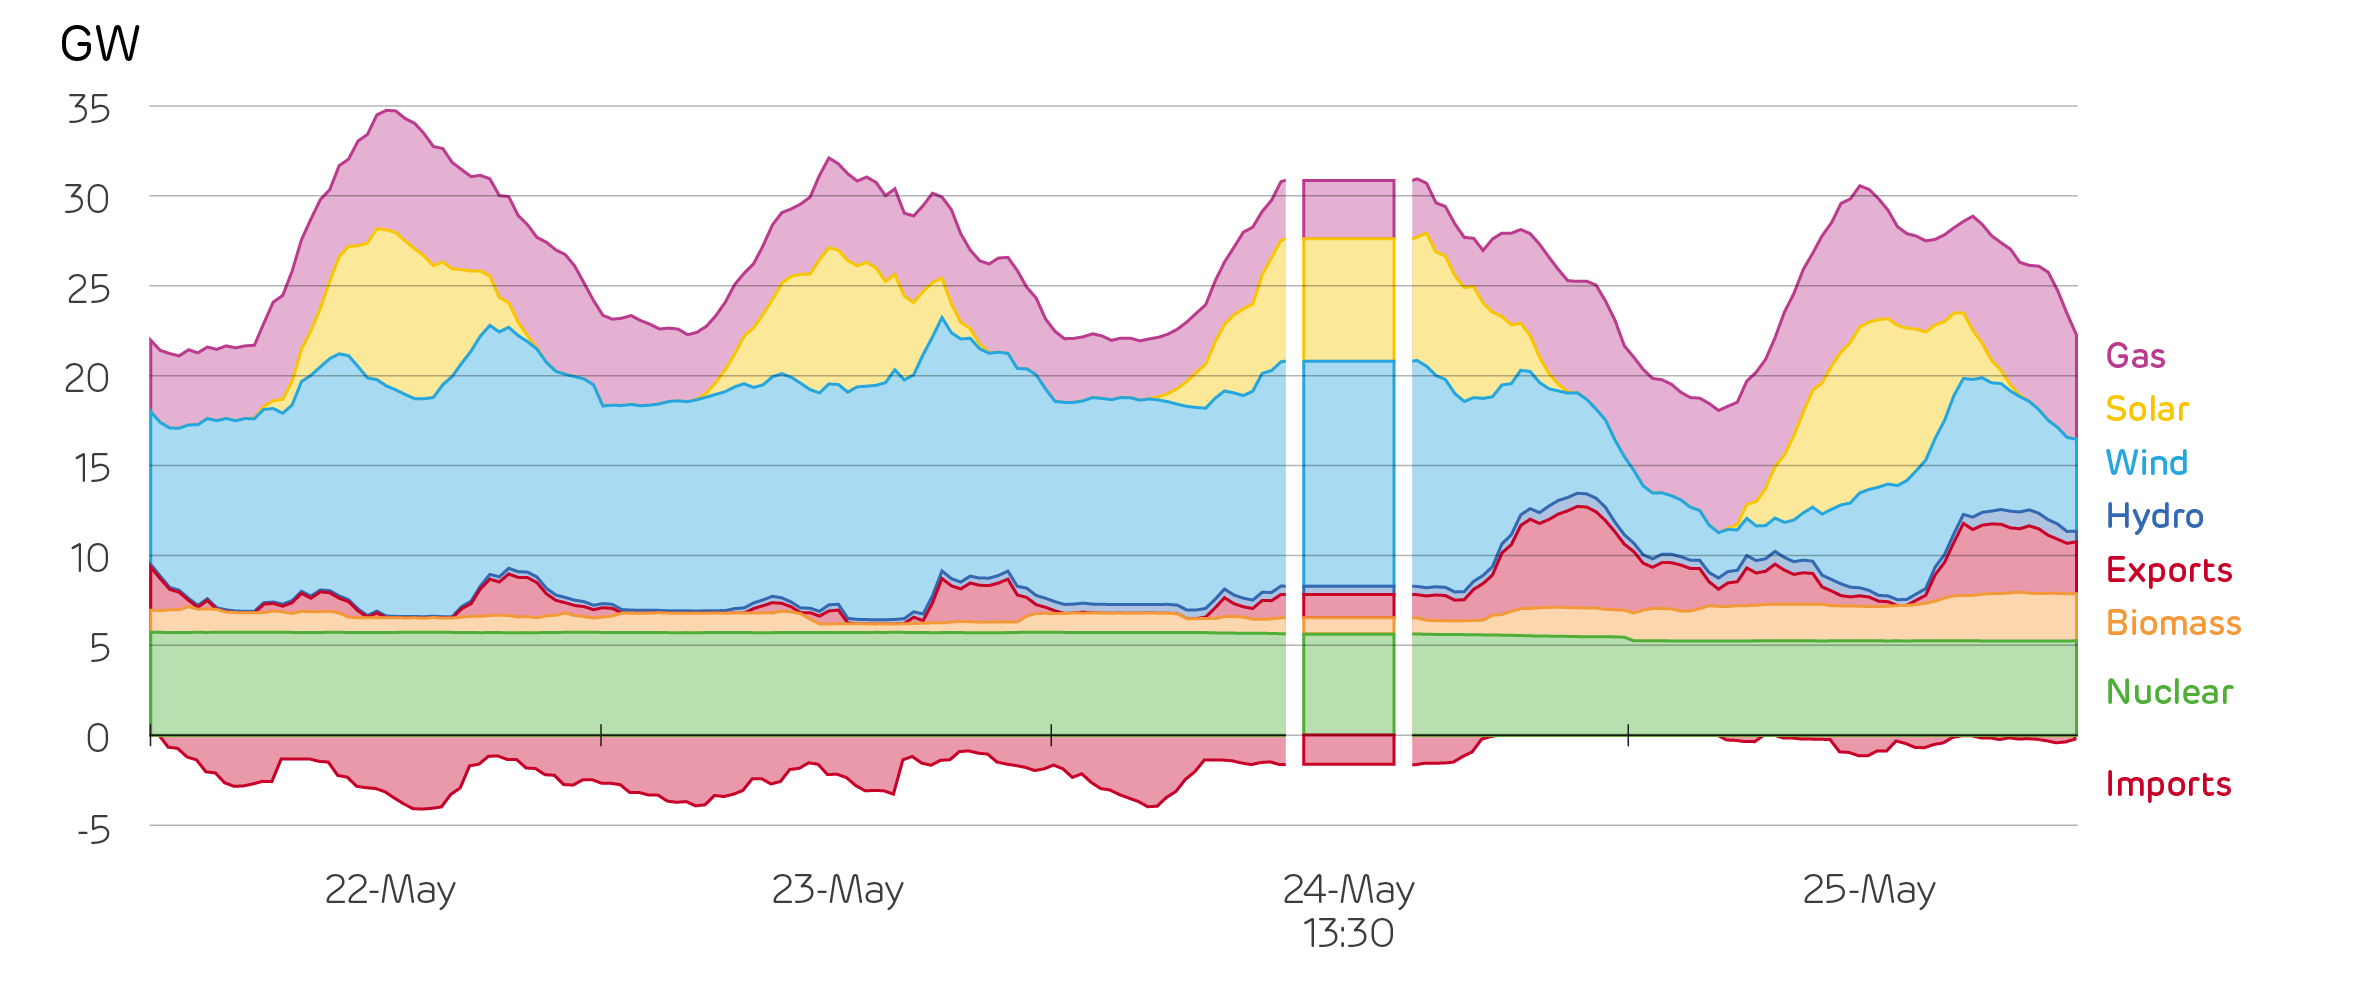
The generation mix over the Spring Bank Holiday weekend, highlighting the mix on the Sunday afternoon with the lowest carbon intensity on record
National Grid and other grid-monitoring websites reported the carbon intensity as being 46 g/kWh at that time. That was still a record low, but very different from the Electric Insights numbers. So why the discrepancy?
These sites report the carbon intensity of electricity generation, as opposed to consumption. Not all the electricity we consume is generated in Britain, and not all the electricity generated in Britain is consumed here.
Should the emissions from power stations in the Netherlands ‘count’ towards our carbon footprint, if they are generating power consumed in our homes? Earth’s atmosphere would say yes, as unlike air pollutants which affect our cities, CO2 has the same effect on global warming regardless of where it is produced.
On that Bank Holiday afternoon, Britain was importing 2 GW of electricity from France and Belgium, which are mostly powered by low-carbon nuclear. We were exporting three-quarters of this (1.5 GW) to the Netherlands and Ireland. While they do have sizeable shares of renewables, they also rely on coal power.
Britain’s exports prevented more fossil fuels from being burnt, whereas the imports did not as they came predominantly from clean sources. So, the average unit of electricity we were consuming at that point in time was cleaner than the proportion of it that was generated within our borders. We estimate that 1190 tonnes of CO2 were produced here, 165 were emitted in producing our imports, and 730 avoided through our exports.
In the long-term it does not particularly matter which of these measures gets used, as the mix of imports and exports gets averaged out. Over the whole quarter, carbon emissions would be 153g/kWh with our measure, or 151 g/kWh with production-based accounting. But, it does matter on the hourly timescale, consumption based accounting swings more widely.
Imports and exports helped make the electricity we consume lower carbon on the 24th, but the very next day they increased our carbon intensity from 176 to 196 g/kWh.
When renewable output is high in Britain we typically export the excess to our neighbours as they are willing to pay more for it, and this helps to clean their power systems. When renewables are low, Britain will import if power from Ireland and the continent is lower cost, but it may well be higher carbon.
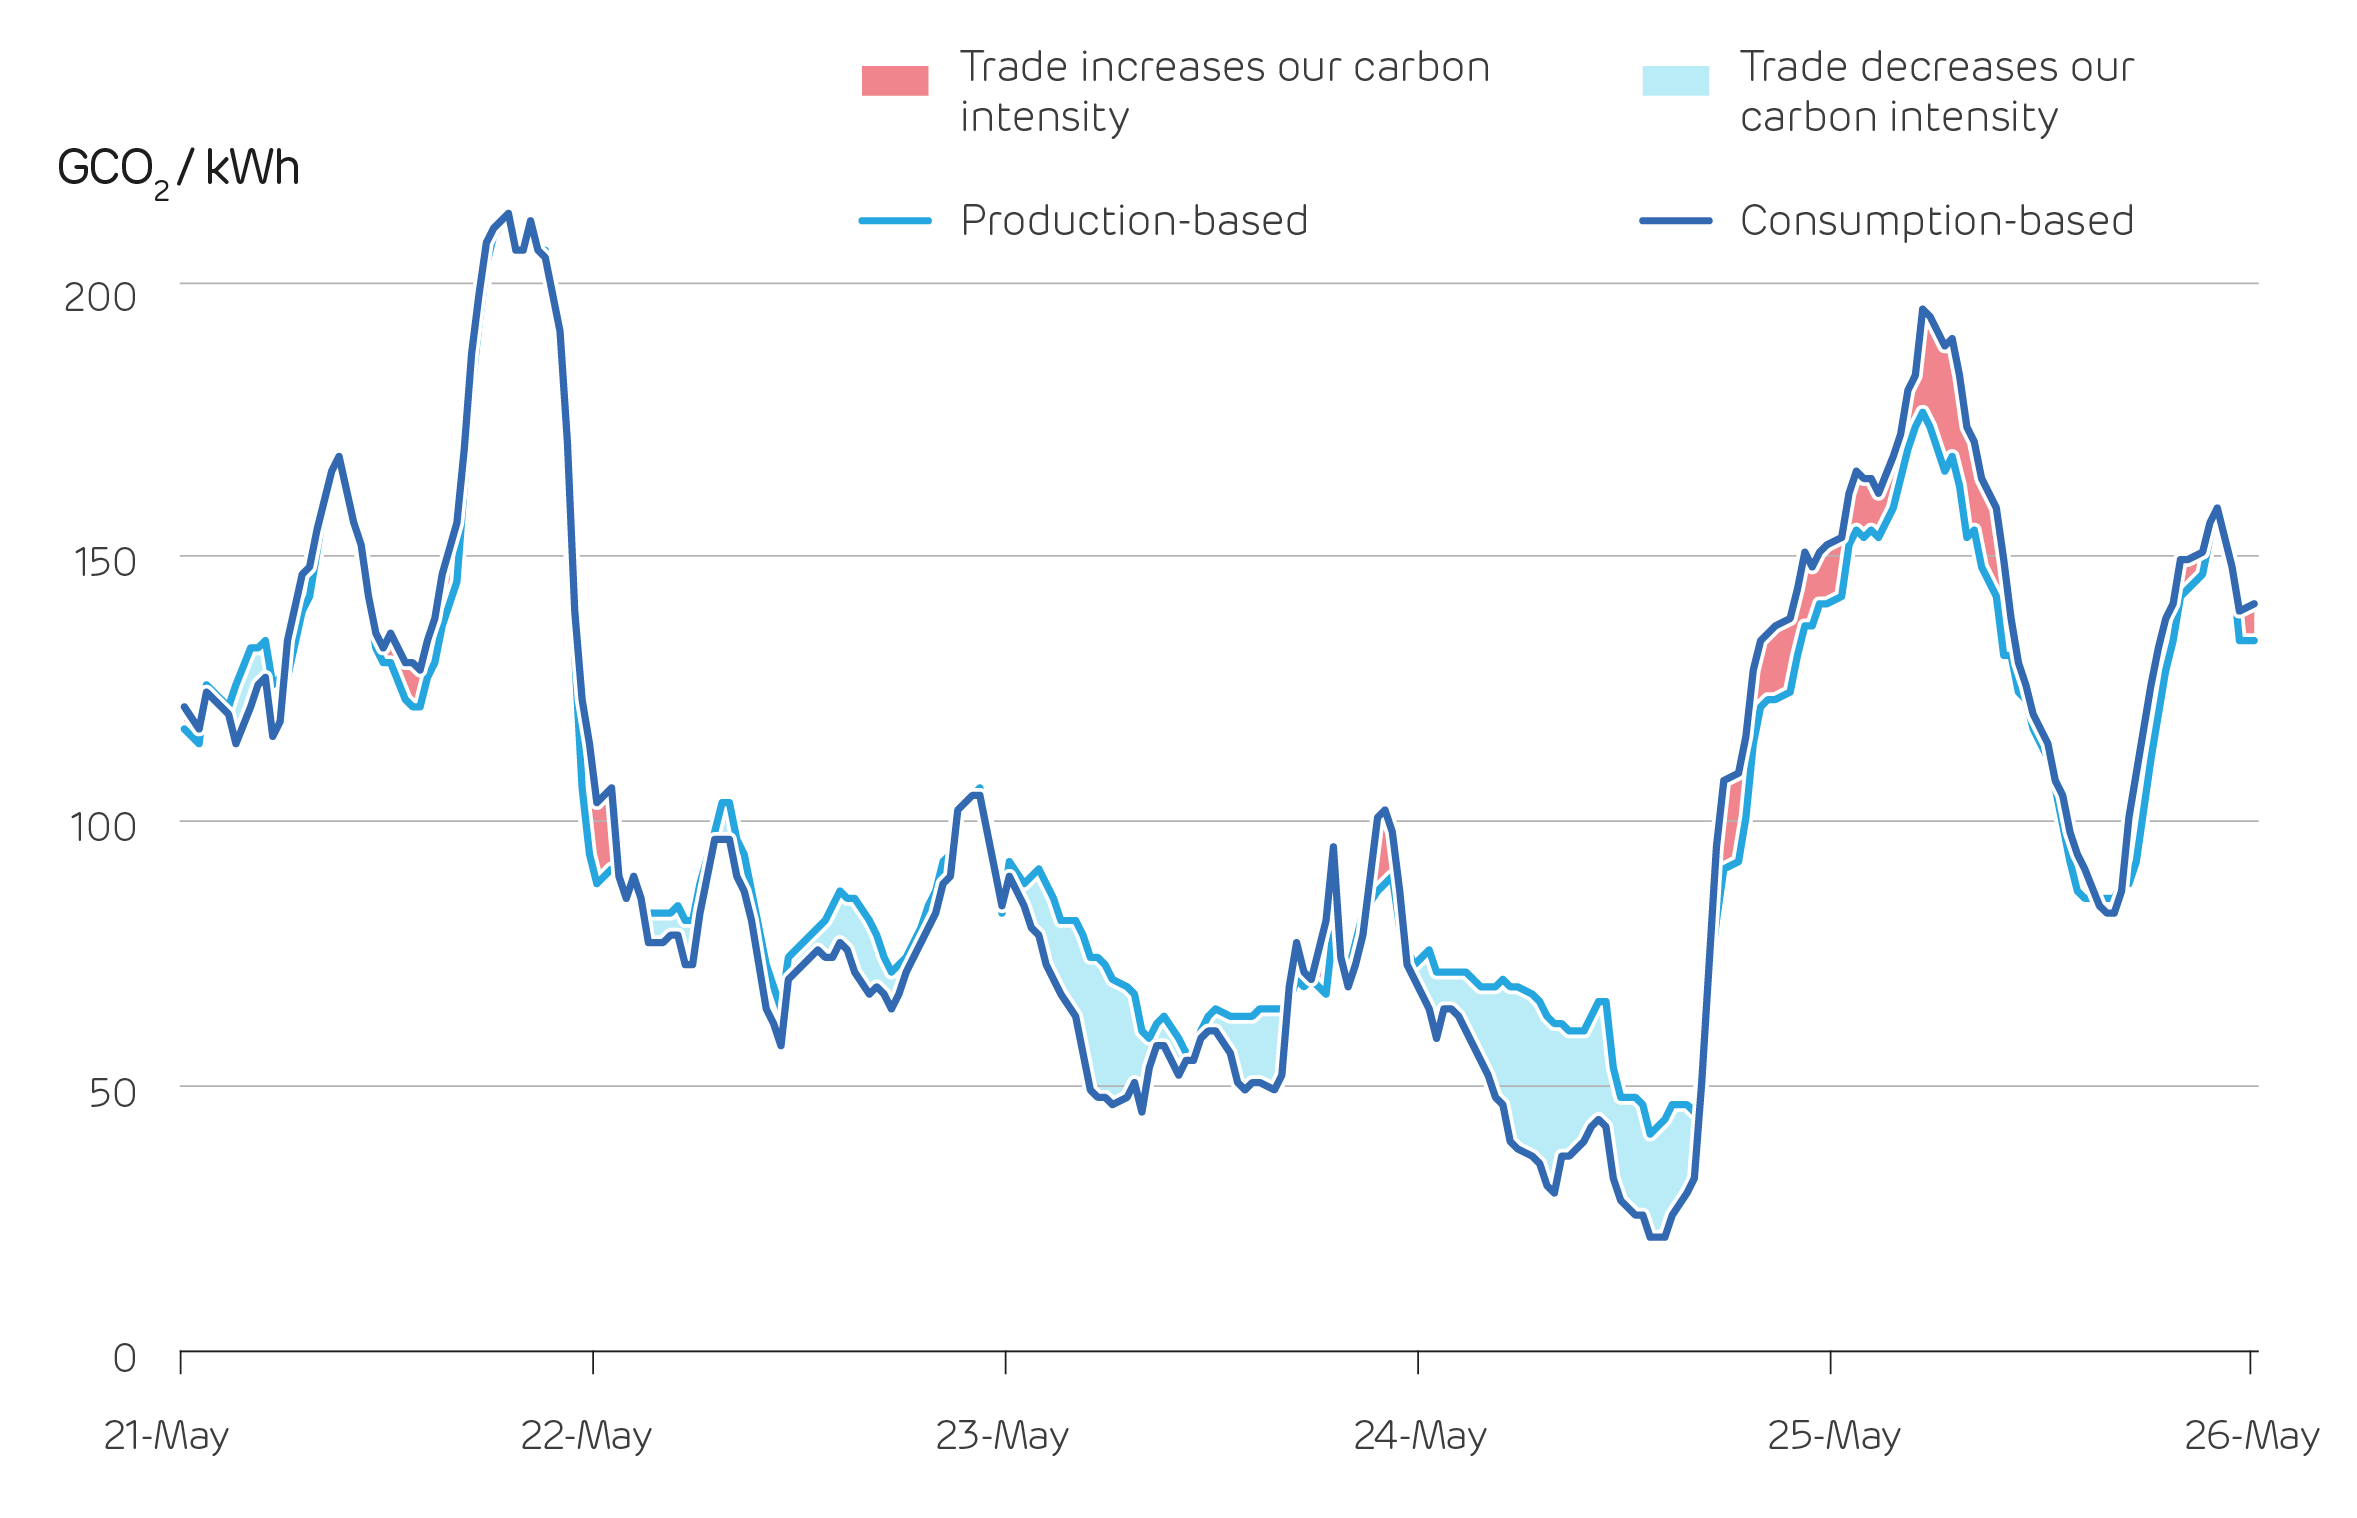
Two measures for the carbon intensity of British electricity over the Bank Holiday weekend and surrounding days
This speaks to the wider question of decarbonising the whole economy.
Should we use production or consumption based accounting? With production (by far the most common measure), the UK is doing very well, and overall emissions are down 32% so far this century. With consumption-based accounting it’s a very different story, and they’re only down 13%*.
This is because we import more from abroad, everything from manufactured goods to food, to data when streaming music and films online.
Either option would allow us to claim we are zero carbon through accounting conventions. On the one hand (production-based accounting), Britain could be producing 100% clean power, but relying on dirty imports to meet its entire demand – that should not be classed as zero carbon as it’s pushing the problem elsewhere. On the other hand (consumption-based accounting), it would be possible to get to zero carbon emissions from electricity consumed even with unabated gas power stations running. If we got to 96% low carbon (1300 MW of gas running), we would be down at 25 g/kWh. Then if we imported fully from France and sent it to the Netherlands and Ireland, we’d get down to 0 g/kWh.
Regardless of how you measure carbon intensity, it is important to recognise that Britain’s electricity is cleaner than ever.
The hard task ahead is to make these times the norm rather than the exception, by continuing to expand renewable generation, preparing the grid for their integration, and introducing negative emissions technologies such as BECCS (bioenergy with carbon capture and storage).
Read full Report (PDF) | Read full Report | Read press release
Electric Insights Q2 2020 report [click to view/download]
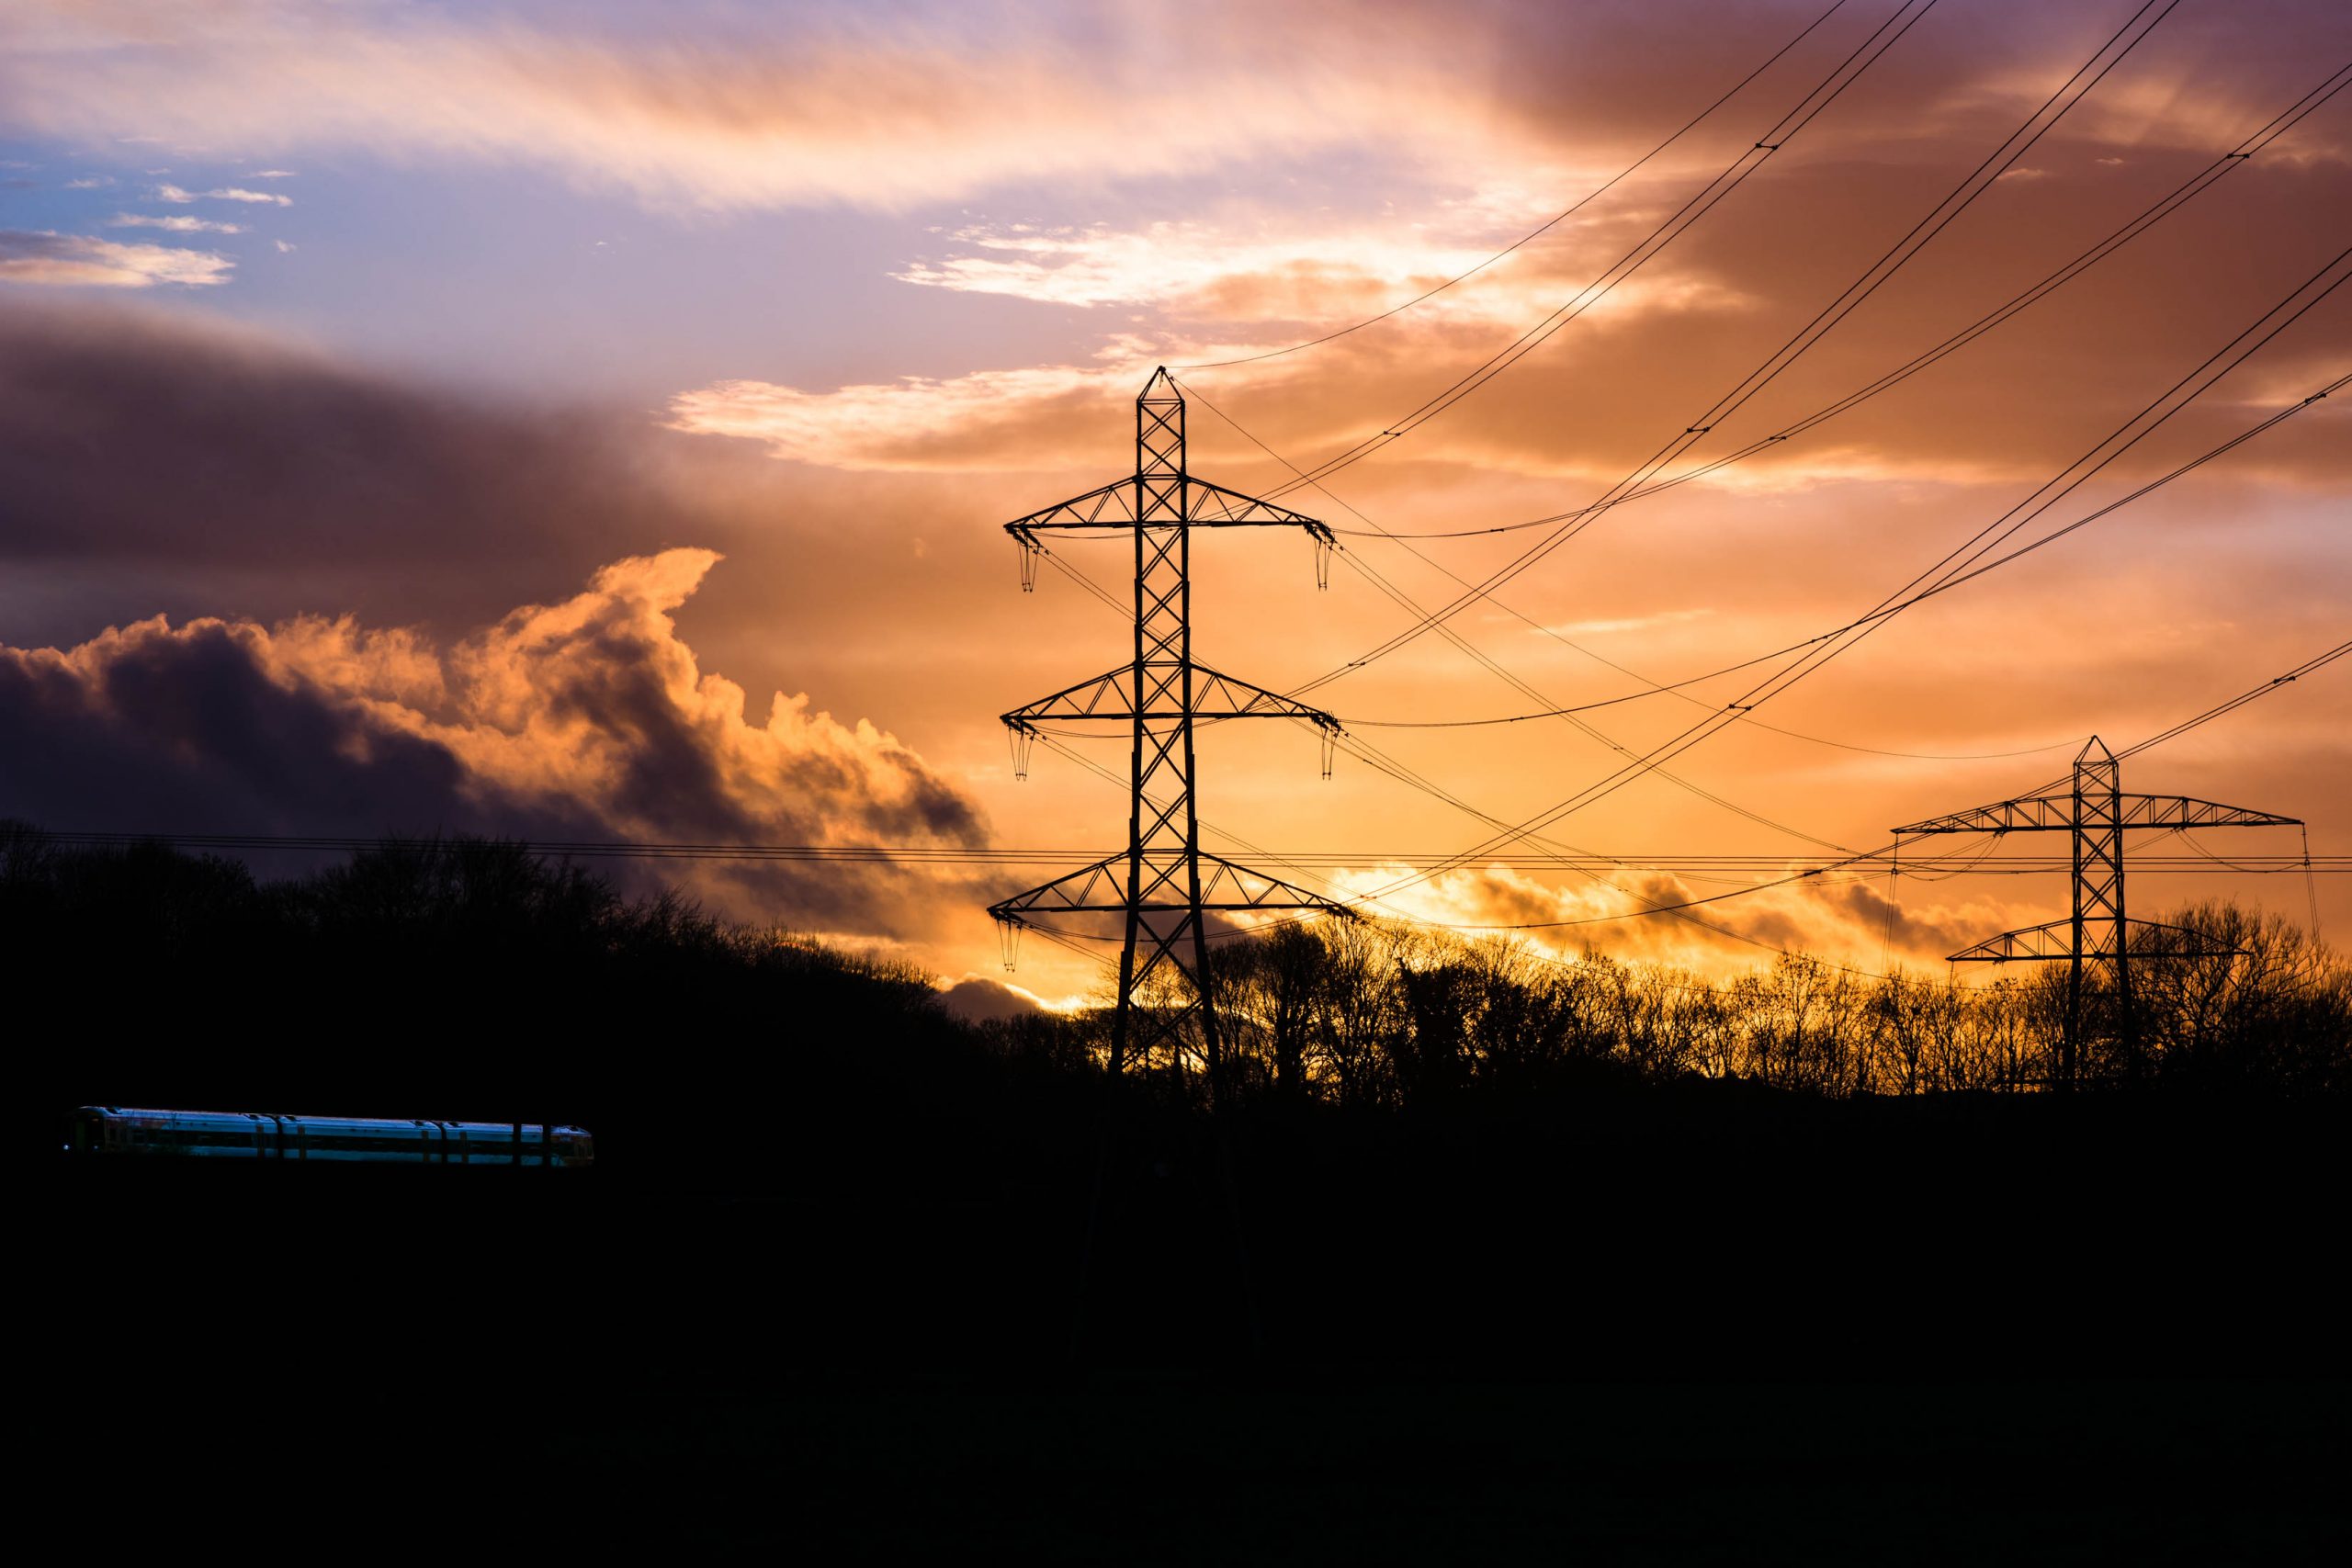
The actions that National Grid takes to manage the power system have typically amounted to 5% of generation costs over the last decade, but this share has quadrupled over the last two years. In the first half of 2020, the cost of these actions averaged £100 million per month.
Supplying electricity to our homes and workplaces needs more than just power stations generating electricity.
Supply and demand must be kept perfectly in balance, and flows of electricity around the country must be actively managed to keep all the interconnected components stable and prevent blackouts. National Grid’s costs for taking these actions have been on the rise, as we reported over the previous two summers; but recently they have skyrocketed.
At the start of the decade, balancing added about £1/MWh to the cost of electricity, but last quarter it surpassed £5/MWh for the first time (see below).
Balancing prices have risen in step with the share of variable renewables. The dashed line below shows that for every extra percent of electricity supplied by wind and solar adds 10 pence per MWh to the balancing price. Last quarter really bucks this trend though, and balancing prices have risen 35% above the level expected from this trend. The UK Energy Research Centre predicted that wind and solar would add up to £5/MWh to the cost of electricity due to their intermittency, and Britain has now reached this point, albeit a few years earlier than expected.
This is partly because keeping the power system stable is requiring more interventions than ever before. With low demand and high renewable generation, National Grid is having to order more wind farms to reduce their output, at a cost of around £20 million per month. They even had to take out a £50+ million contract to reduce the output from the Sizewell B nuclear reactor at times of system stress.
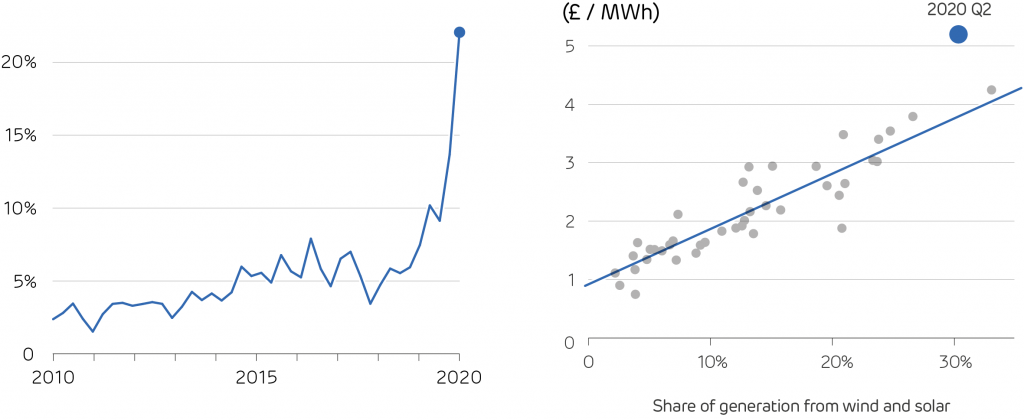
[Left] The quarterly-average cost of balancing the power system, expressed as a percentage of the cost of generation. [Right] Balancing price shown against share of variable renewables, with dots showing the average over each quarter
For a quarter of a century, the electricity demand in GB ranged from 19 to 58 GW*. Historically, demand minus the intermittent output of wind and solar farms never fell below 14 GW. However, in each month from April to June this year, this ‘net demand’ fell below 7 GW.
Just as a McLaren sports car is happier going at 70 than 20 mph, the national grid is now being forced to operate well outside its comfort zone.
This highlights the importance of the work that National Grid must do towards their ambition to be ready for a zero-carbon system by 2025. The fact we are hitting these limits now, rather than in a few years’ time is a direct result of COVID. Running the system right at its limits is having a short-term financial impact, and is teaching us lessons for the long-term about how to run a leaner and highly-renewable power system.
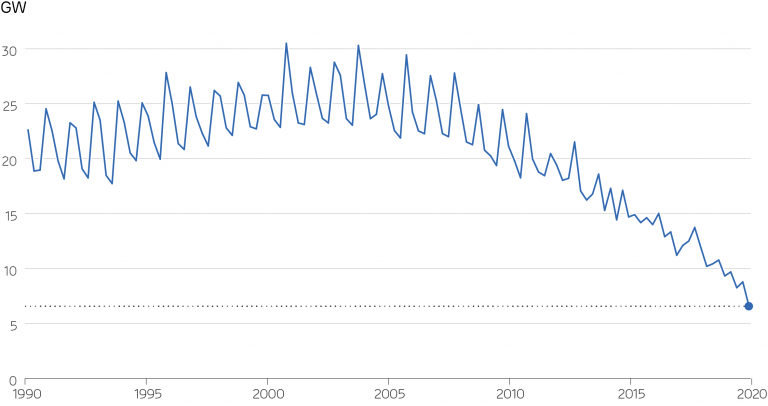
Minimum net demand (demand minus wind and solar output) in each quarter since 1990
Read full Report (PDF) | Read full Report | Read press release
Electric Insights Q2 2020 report [click to view/download]
21 May 2020

On March 23rd the UK took an unprecedented move to tackle the coronavirus. Most business that had not already closed moved online, with millions of people now working from home. This had a huge impact on electricity demand: consumption on weekdays fell by 13% to its lowest levels since 1982 – a time when there were 10 million fewer people in the country, and GDP was a third lower than today.
Other regions have seen a similar collapse in electricity demand. Spain, Italy and France have all seen electricity demand fall by 10-15% according to analysis by Ember. Across the Atlantic, New York City has seen similar reductions.
Demand has fallen for a simple reason: with schools and workplaces now closed or running with a greatly reduced staff – machinery, computers, lights and heaters are not drawing power. Electric rail, tram and tube systems are also running a reduced service. On the contrary, with more people at home, household electricity consumption has increased. Octopus Energy estimate that during social distancing (before the stricter lockdown came into effect) homes were consuming up to a third more electricity, adding £20 per month to the typical bill.
The impact of lockdown on Britain’s electricity demand is much like living through a month of Sundays. The average profile for a March weekend day in previous years looks very similar to the daily profile for weekdays since lockdown begun – both in the amount of electricity consumed and the structure. Post-lockdown weekends have even lower demand, tracking 11% below weekday demand.
People no longer have to get up at the crack of dawn for work. On a typical weekday morning, demand would rise by 10 GW over two hours from 5:30 to 7:30 AM. Now it takes more than twice as long – until midday – for this rise to occur. At the other end of the day, there would normally be a small peak in demand around 8 PM from people gathering in pubs and restaurants up and down the country. Both on weekdays and weekends, demand begins falling earlier in the evening as the sofa has become the only available social venue.

With lower demand comes lower power prices. Wholesale electricity prices are typically 7% lower on Sundays than on weekdays for this reason. March saw the lowest monthly-average power price in 12 years, down one-third on this month last year. Prices were already heading downwards because of the falling price of gas, but the lockdown has amplified this, and negative prices have become commonplace during the middle of the day. There was not a visible impact on carbon emissions during the first quarter of the year, as only the last week of March was affected. However, as lockdown continued into April and May, emissions from power production in Britain have fallen by 35% on the same period last year. The effect is slightly stronger across Europe, with carbon emissions falling almost 40% as dirtier coal and lignite power stations are being turned down.
Will some of these effects persist after lockdown restrictions are eased? It is too early to tell, as it depends on what long-lasting economic and behavioural changes occur. Electricity demand is linked with the country’s GDP, which is set to face the largest downturn in three centuries. Whether the economy bounces back, or is afflicted with a lasting depression will be key to future electricity demand. It will also depend on behavioural shifts. People are of course craving their lost freedoms, many may appreciate not going back to a lengthy daily commute – and the rise of video conferencing and collaboration apps has shown that remote working may finally have come of age. With even a small share of the population continuing to work from home on some days, there could be a lasting impact on electricity demand for years to come.
Read full Report (PDF) | Read full Report | Read press release

How reliable is Great Britain’s electricity system? Across the country electricity is accessible and safe to use for just about everyone, every day. Wide-scale blackouts are very rare, but they do happen.
On 9 August 2019 a power cut saw more than 1 million people and services lose power for just under an hour. It was the first large-scale blackout since 2013. Although this proves the network is not infallible, the fact it was such an outlier in the normal performance of the grid highlights its otherwise exemplary stability and reliability.
But what is it exactly that makes an electricity system stable and reliable?
At its core, system stability comes down to two key factors: a country or region’s ability to generate enough electricity, and its ability to then transport it through a transmission system to where it’s needed.
When everything is running smoothly an electricity system is described as being ‘balanced’. In this state supply meets demand exactly and all necessary conditions – such as voltage and frequency – are right for the safe and efficient transport of electricity. Any slight deviation or mismatch across any of these factors can cause power stations or infrastructure to trip and cut off power.
A recent report by Electric Insights identified the countries around the world with most reliable power systems, in which the UK was fourth. It offers an insight into what factors contribute to building a stable system, as well as those that hold some countries back.

According to the report, France has the most reliable electricity system of any country with a population of more than five million people, having gone a decade without a power outage. One reason for this is the country’s fleet of 58 state-controlled nuclear power stations which generate huge amounts of consistent baseload power.
In 2017 nuclear power made up more than 70% of France’s electricity generation while hydropower accounted for another 10% of the 475 Terawatt hours (TWh) consumed across the county that year.

Penly Nuclear Power Station near Dieppe, France.
Now, as its nuclear stations age, France is increasing its renewable power generation. As these sources are often weather dependent, imports from and exports to its neighbours are expected to become a more important part of keeping the French network stable at times when there is little sunlight or wind – or too much.
Importing and exporting electricity is also key to Switzerland’s power system (third most reliable network on the list), with 41 border-crossing power lines allowing the country to serve as a crossroads for power flowing between Italy and Germany. It means its total imports and exports can often exceed electricity production within the country.
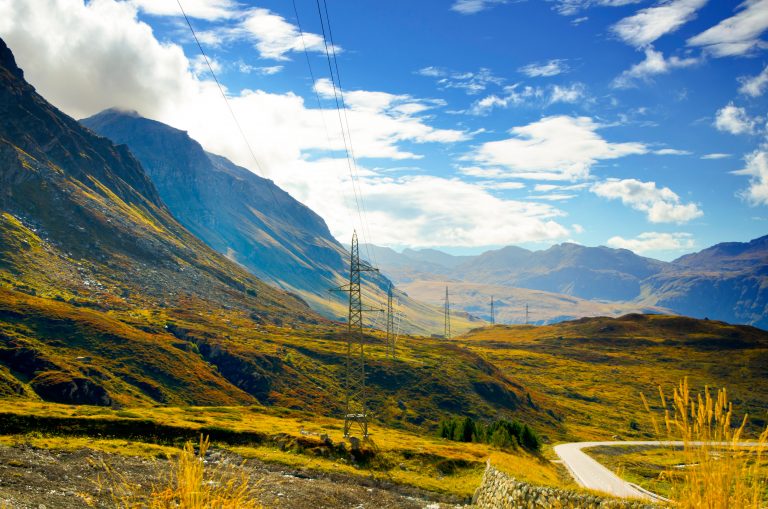
Electricity pylons in Switzerland.
Switzerland’s mountainous landscape also means ensuring a reliable electricity system requires a carefully maintained transmissions system. The Swiss grid is 6,700 kilometres long and uses 40,000 hi-tech metering points along it to record and process around 10,000 data points in seconds.
The key to the stability of South Korea – the second most stable network on the list – is also its imports, but rather than actual megawatts it comes in the form of oil, gas and coal. The country is the world’s fourth biggest coal importer and its coal power stations account for 42% of its total generation.

Seoul, South Korea.
However, in the face of urban smog issues and global decarbonisation goals it is pursuing a switch to renewables. This can come with repercussions to stability, so South Korea is also investing in transmission infrastructure, including a new interconnector from the east of the country to Seoul, its main source of electricity consumption.
It highlights that if decarbonisation is going to accelerate at the pace needed to meet Paris Agreement targets, then many of the world’s most stable and reliable electricity systems need to go through significant change. Balance will be needed between meeting decarbonisation targets with overall system stability.
However, there are many countries around the world that focus less on ensuring consistent stability through decarbonisation and are instead more focused on how to achieve stability in the first place.
The Democratic Republic of Congo is the eleventh-largest country on earth. It is rich with minerals and resources, yet it is the least electrified nation. Just 9% of people have access to power (in rural areas that number drops to just 1%) and the country suffers blackouts more than once a month as a result of ‘load shedding’, when there isn’t enough power to meet demand so parts of the grid are deliberately shut down to prevent the entire system failing.
Currently, the country has just 2.7 GW of installed electricity capacity, 2.5 GW of which comes from hydropower. The country’s Inga dam facility on the Congo river has the potential to generate more electricity than any other single source of power on the planet (it’s thought the proposed Grand Inga site could produce as much as 40 GW, twice that of China’s Three Gorges Dam) and provide electricity to a massive part of southern Africa. A legacy of political instability in the country, however, has so far made securing financing difficult.

Congo River, Democratic Republic of Congo.
Nigeria is one of the world’s fastest growing economies, and with that comes rapidly rising demand for electricity. However, just 45% of the country is currently electrified, and of these areas, many still suffer outages at least once a month. The country has 12.5 GW of installed capacity, most of which comes from thermal gas stations, but technical problems in power stations and infrastructure, mean it is often only capable of generating as much as 5 GW to transmit on to end consumers.
This limited production capability means it often fails to meet demand, resulting in outages. The problem has been prolonged by struggling utility companies that are unable to make the investments needed to stabilise electricity supply.
Keen to resolve what it has referenced as an ‘energy supply crisis’, the Nigerian government recently secured a $1 billion credit line from the World Bank to improve access to electricity across the country.
The investment will focus in part on securing the transmission system from theft, thus allowing the private utility companies to generate the revenue needed to improve generation.
Balancing transmissions systems is a crucial part of stable electricity networks. Maintaining a steady frequency that delivers safe, usable electricity into homes and businesses is at the crux of reliability. Even countries that can generate enough electricity are held back if they can’t efficiently get the electricity to where it is needed.
Brazil has an abundance of hydropower installed. Its 97 GW of hydro accounts for more than 70% of the country’s electricity mix. However, the country’s dams are largely concentrated around the Amazon basin in the North West, whereas demand comes from cities in the south and eastern coastline. Transporting electricity across long distances between generator and consumer makes it difficult to maintain the correct voltage and frequency needed to keep a stable and reliable flow of electricity. As a result, Brazil suffers a blackout every one-to-three months.

Hydropower plant Henry Borden in the Serra do Mar, Brazil.
The country is tackling its transmissions problems by diversifying its electricity mix to include greater levels of solar and wind off its east coast – closer to many of its major cities. The country has also looked to new technology for solutions.
At the start of the decade as much as 8% of all electricity being generated in Brazil was being stolen, reaching as high as 40% in some areas. These illegal hookups both damage infrastructure, making it less reliable, as well as blur the true demand, making grid management challenging.
Brazil has since deployed smart meters to measure electricity’s journey from power stations to end users more accurately, allowing operators to spot anomalies sooner. Electricity theft is a major problem in many developing regions, with as much as $10 billion worth of power lost each year in India, which suffers blackouts as often as Brazil.
It highlights that even when there is generation to meet demand, maintaining stability at a large scale requires constant attention and innovation as new challenges arise.

This looks different around the world. Some countries might face challenges in shifting from stable thermal-based systems to renewables, others are attempting to build stability into newly connected networks. But no matter where in the world electricity is being used, ensuring reliability is an ever-ongoing task.
Electric Insights is commissioned by Drax and delivered by a team of independent academics from Imperial College London, facilitated by the college’s consultancy company – Imperial Consultants. The quarterly report analyses raw data made publicly available by National Grid and Elexon, which run the electricity and balancing market respectively, and Sheffield Solar. Read the full Q3 2019 Electric Insights report or download the PDF version.
4 December 2019

29 August 2019

Electric vehicles are fast becoming mainstream. There are now well over 200,000 on Britain’s roads, and this number is growing by 30% per year. 1 in 40 cars sold in Britain is now electric, around one third of which are pure battery models, and two thirds are plug-in hybrid.[1]
This radical shift is just beginning though. Britain’s electric vehicle fleet is expected to expand ten-fold over the next five to ten years. In more optimistic scenarios, half of all vehicles on the road could be electric just fifteen years from now.[2]
While many see EVs as the cleanest way to drive, they are still the subject of much speculation. Recent criticisms range from a UK government report saying they won’t end air pollution[3] to a string of studies (often debunked) claiming they emit more CO2 than diesel equivalents.[4]
The arguments are simple: how can it be cleaner to swap a petrol car for electric if it is recharged using electricity from dirty coal or gas? Secondly, how can electric vehicles ‘repay’ the energy needed for mining lithium and to assemble the huge batteries that power them?
We review academic studies of battery manufacture and use data from Electric Insights to answer these questions. On average Britain’s EVs emit just one quarter the CO2 of conventional petrol and diesel vehicles. If the carbon emitted in making their battery is included, this rises to only half the CO2 of a conventional vehicle. Electric vehicles bought today could be emitting just a tenth that of a petrol car in five years’ time, as the electricity system is widely expected to continue moving towards low-carbon sources.
Manufacturing each kWh of battery emits a similar amount of carbon as burning through one full tank of petrol.[5] Electric vehicles typically have a battery capacity ranging from 30 kWh for small city hatchbacks up to 100 kWh for top-end models – manufacturing the latter emits as much carbon as three round-the-world flights. More CO2 is emitted in building the battery for premium EV model than from the recharging it over a 15-year lifetime.[6]
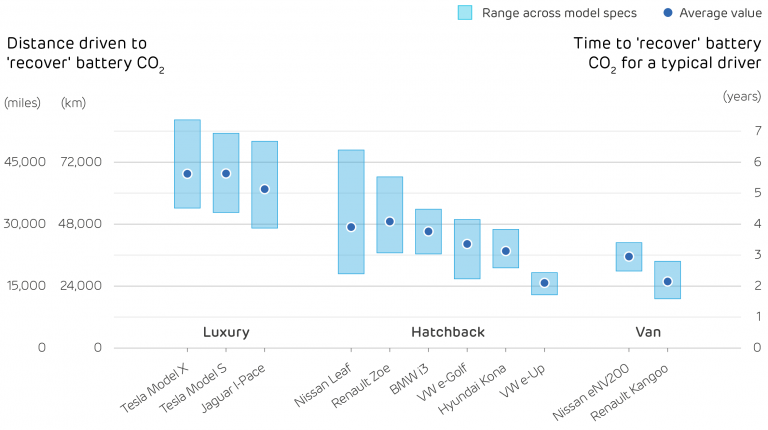
However, the most efficient EV models could need just two to three years of driving to save the amount of carbon emitted in producing their batteries. Smaller EVs with modest battery sizes are better for the environment; whereas the largest luxury EV models could need three times longer to pay back their carbon cost.
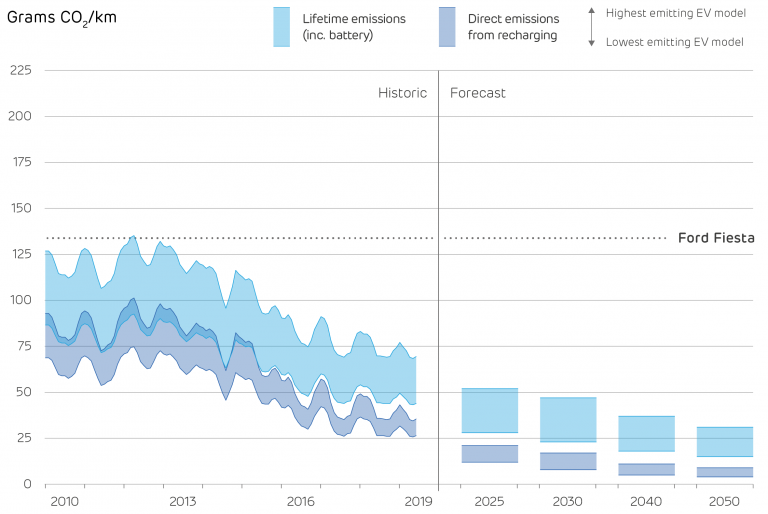
Small hatchbacks are the best-selling type of electric vehicles, led by the Nissan Leaf. They are also the cleanest to drive as they are small and light. Electric models currently emit around 33 grams of CO2 per km driven, which is one quarter that of the most popular conventional vehicle, a 2019 Ford Fiesta.

Volkwagen e-up! electric car showcased at the Frankfurt IAA Motor Show 2017.
These electric models typically come with a 30-45 kWh battery, which pushes their lifetime emissions up around 60 g/km. This is still less than half the emissions of a petrol or diesel car. With the projected changes to the grid mix, this will fall to less than one third of a standard car in just five years’ time.
 EV models: Nissan Leaf, Renault Zoe, Volkswagen e-Golf and e-Up, Hyundai Kona and BMW i3
Battery size: 39 kWh on average (31–46 kWh central range)
Lifetime carbon content of the battery: 26 g/km driven on average (18–34 g/km central range)
Emissions with 2018/19 grid mix: 28–38 g/km from recharging, 45–72 g/km including battery
Emissions with 2025 grid mix: 12–20 g/km from recharging, 28–52 g/km including battery
Luxury saloons and SUV models include the iconic Tesla Models S and X, and the new Jaguar i-Pace. These are much larger and need more energy to move, meaning they have higher emissions than hatchbacks, at 44-54 g/km. This is still just a quarter of the emissions from a comparable conventional car (a top of the range Mercedes S-Class).
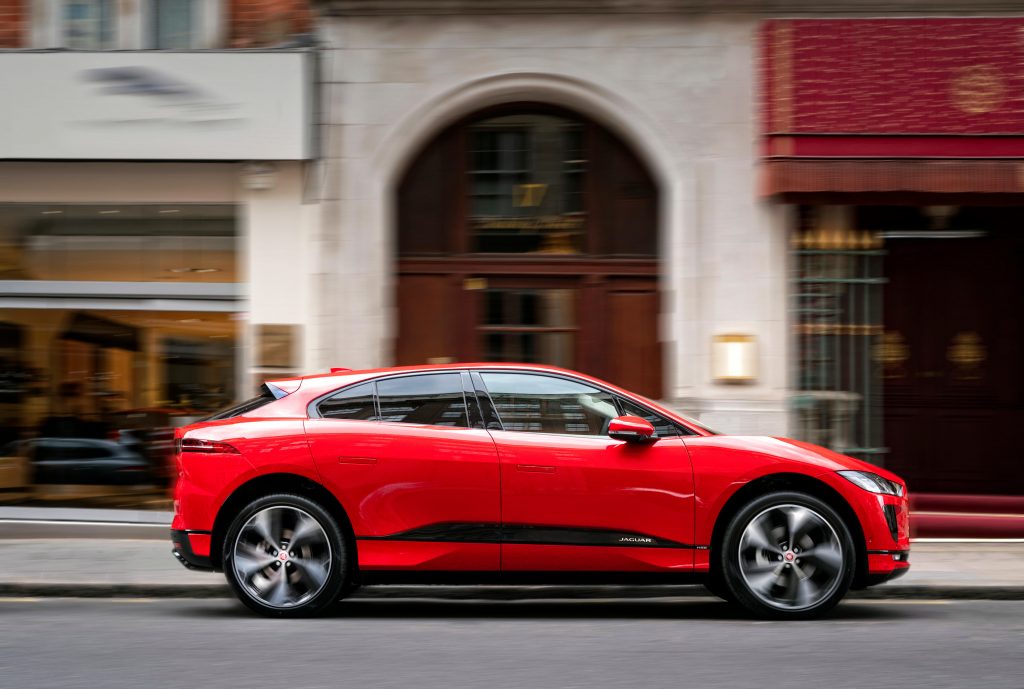
Jaguar I Pace EV
The lifetime emissions of these luxury EVs are notably higher though, pushed up by the enormous 90-100 kWh batteries they use to provide a driving range of over 250 miles. These batteries are responsible for more CO2 emissions than driving the car over its entire lifetime.
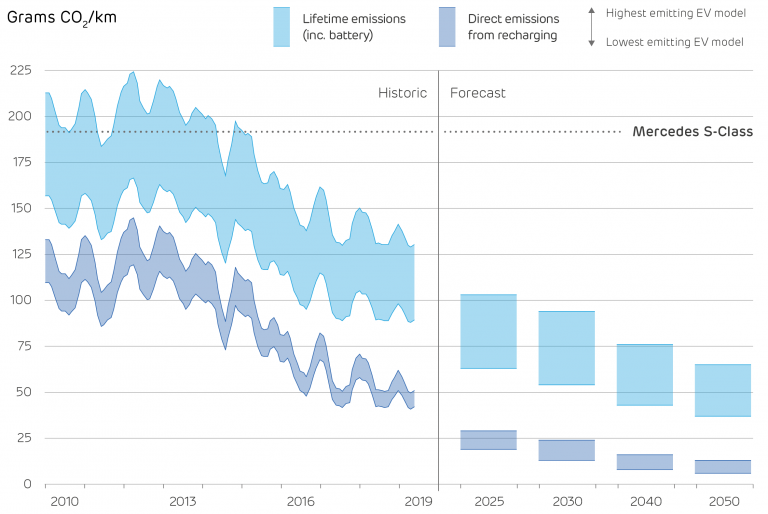 Models considered: Jaguar i-Pace, Tesla Model S and Model X
Battery size: 97 kWh on average (90–100 kWh central range)
Lifetime carbon content of the battery: 63 g/km driven on average (47–80 g/km central range)
Emissions with 2018/19 grid mix: 44–54 g/km from recharging, 92–133 g/km including battery
Emissions with 2025 grid mix: 19–29 g/km from recharging, 63–103 g/km including battery
Electric vans are quickly taking off, with over 8,000 sold in Britain to date. Their performance is comparable to small hatchbacks, and they also currently emit around a quarter of the CO2 of the most popular conventional van, with around 40 g/km.
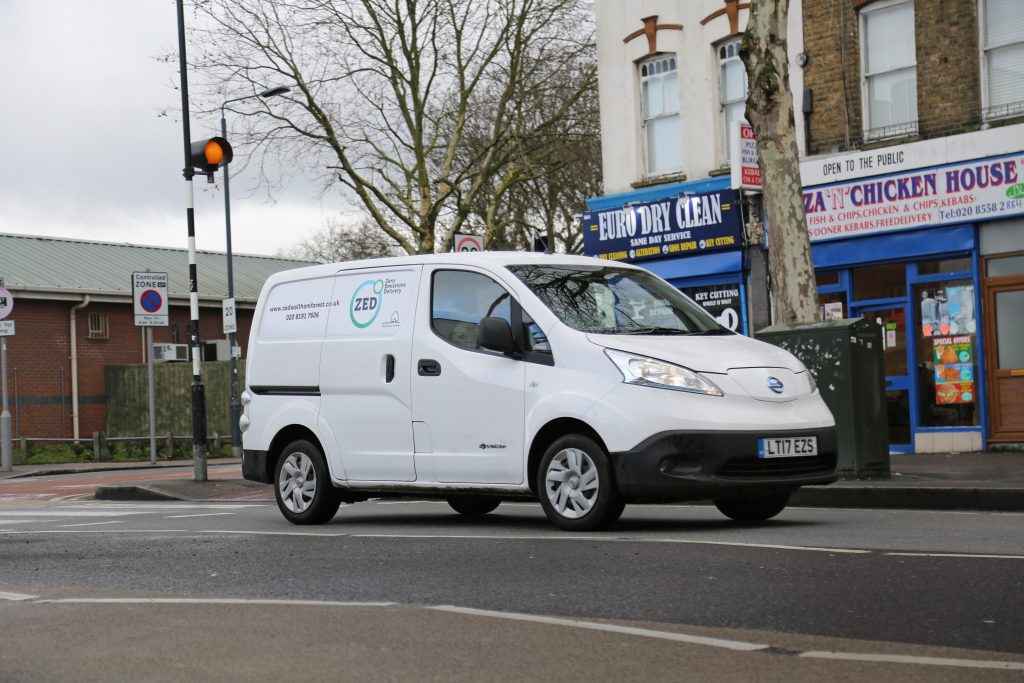
A white Nissan e-NV200 electric van makes deliveries in London.
With their 30–40 kWh battery pack included, this rises to just below half the CO2 of a small Ford Transit.
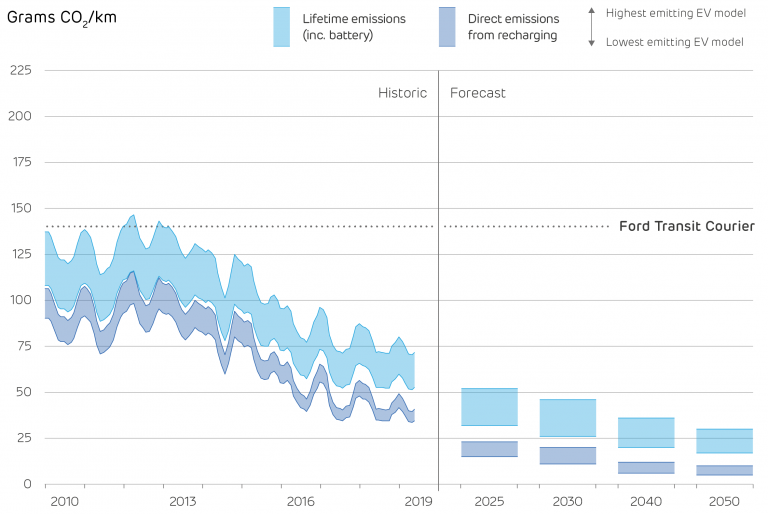 Models considered: Nissan e-NV200 and Renault Kangoo
Battery size: 37 kWh on average (33–40 kWh central range)
Lifetime carbon content of the battery: 24 g/km driven on average (18–31 g/km central range)
Emissions with 2018/19 grid mix: 37–43 g/km from recharging, 54–74 g/km including battery
Emissions with 2025 grid mix: 15–23 g/km from recharging, 32–52 g/km including battery
A typical driver filling their car up once a month and driving around 7,500 miles per year will produce one and a half tonnes of CO2 per year in a modern petrol or diesel hatchback. An electric vehicle doing the same mileage would take 4 years to produce this amount.

With a conventional vehicle, there is no scope for reducing emissions over its lifetime, as petrol and diesel fuels cannot become carbon-free. On the contrary, National Grid expect the carbon content of Britain’s electricity to continue falling, so that an electric vehicle bought now will be emitting half as much CO2 in 2025 as it does today.
It is inconceivable that an electric vehicle in the UK could be more polluting than its conventional equivalent. This would require electricity to have a carbon intensity of around 850–950 g/kWh, values not seen since the 1960s.[7]
Electric vehicles can be thought of as having an upfront ‘carbon cost’ for manufacturing the battery, which can then be ‘repaid’ through lower emissions as they are driven. With Britain’s current grid electricity (producing 205 g/kWh), smaller electric cars and vans will take between 2 and 4 years to have saved the amount of CO2 than was emitted in making their batteries. For the larger luxury models, it will take more like 5–6 years of driving to pay back that carbon.
With each passing year as the electricity mix gets cleaner, this payback time will continue to fall, and the environmental credentials of electric vehicles will keep growing stronger.
The fuel economy and climate impact of vehicles are measured by the government through the amount of CO2 they release for every kilometre driven. The UK’s most popular car, the Ford Fiesta, emits around 120 g/km in its cleanest models and 160 g/km in the sportier versions.[9] Electric vehicles don’t emit any CO2 while driving, but the power system does when producing the electricity needed to recharge them.
Britain’s power system has changed dramatically over the last five years, with carbon emissions halving and the share of coal generation falling from 36% to just 3%. One kWh of electricity in Britain is now contains 204 grams[10] of CO2, less than the carbon released from burning one kWh of petrol. An electric vehicle can drive up to four times further on 1 kWh than a petrol or diesel car could, because electric motors are so much more efficient.
The charts above look at three categories of vehicle – small hatchbacks, luxury saloons and SUVs, and small commercial vans. Each chart shows how the carbon emissions from an electric vehicle have fallen over the past decade, and how they are expected to continue falling in the years to come. The charts consider changes to the electricity generation mix used for recharging,[11] and a gradual reduction in emissions from battery manufacture as the electricity mix changes in other countries.[12]
The range in direct emissions from recharging (the dark blue bands) covers the main EV models currently on sale in each segment, and variants on each model available. The top of each band (highest emissions) shows the least efficient EV model, the bottom of each band (lowest emissions) shows the most efficient. In the forecast, these bands also include the range of emissions factors for electricity production coming from National Grid’s scenarios.
There is a larger range in the estimated whole-lifecycle emissions (the lighter blue bands) due to the additional uncertainty in the emissions caused by manufacturing 1 kWh of battery capacity, and the range of battery sizes seen across EV models.
Studies have estimated a wide range of emissions, depending on the type of battery type, its design, where it is manufactured and how old the study is. Current estimates range from 40 up to 200 kg of CO2 emitted per kWh of battery capacity.[13] We take the average across eight studies and assume 75–125 kgCO2 per kWh. The true value may be less than this, as end-of-life batteries could be recycled,[14] or could be repurposed as a second-life home or grid storage batteries. It will also reduce in future as the electricity used to make batteries is decarbonised, or as more factories switch to 100% renewable energy (as has the US Tesla Gigafactory).
Read full Report (PDF) | Read full Report | Read press release
23 July 2019

Electricity generation is decarbonising faster in Britain than anywhere else in the world.[1] Changes to the way we produce power over the last six years have reduced carbon emissions by 100 million tonnes per year.[2]
The carbon savings made in Britain’s power sector are equivalent to having taken every single car and van off our roads.[3]
This puts Britain at the forefront of the wider trend towards clean electricity. Coal generation is collapsing in Germany, having fallen 20% in the last year due to rising carbon prices. Renewables have beaten fossil fuels as the largest source of generation in Europe. A third of America’s coal power stations have retired over the last decade as they switch to cleaner natural gas.
Britain’s coal power stations made international headlines in May for sitting completely idle for two full weeks. But coal is only part of the story.
100 grams of CO2 per kWh is an important number. Two years ago the Committee on Climate Change recommended it as the target for 2030 that would mean our electricity system is in line with the national commitment to decarbonise.
Britain’s electricity has dipped below 100 grams for single hours at a time, but until now it had never done so for a full day.
June 30th was a sunny Sunday with a good breeze that brought a 33°C heatwave to an end. Electricity demand was among the lowest seen all year while wind output was at a three-month high. The carbon intensity of electricity sat below 100 g/kWh for half of the day, falling to a minimum of just 73 g/kWh in the mid-afternoon. Carbon emissions averaged over the day were 97 g/kWh, beating the previous record of 104 g/kWh set a year ago.
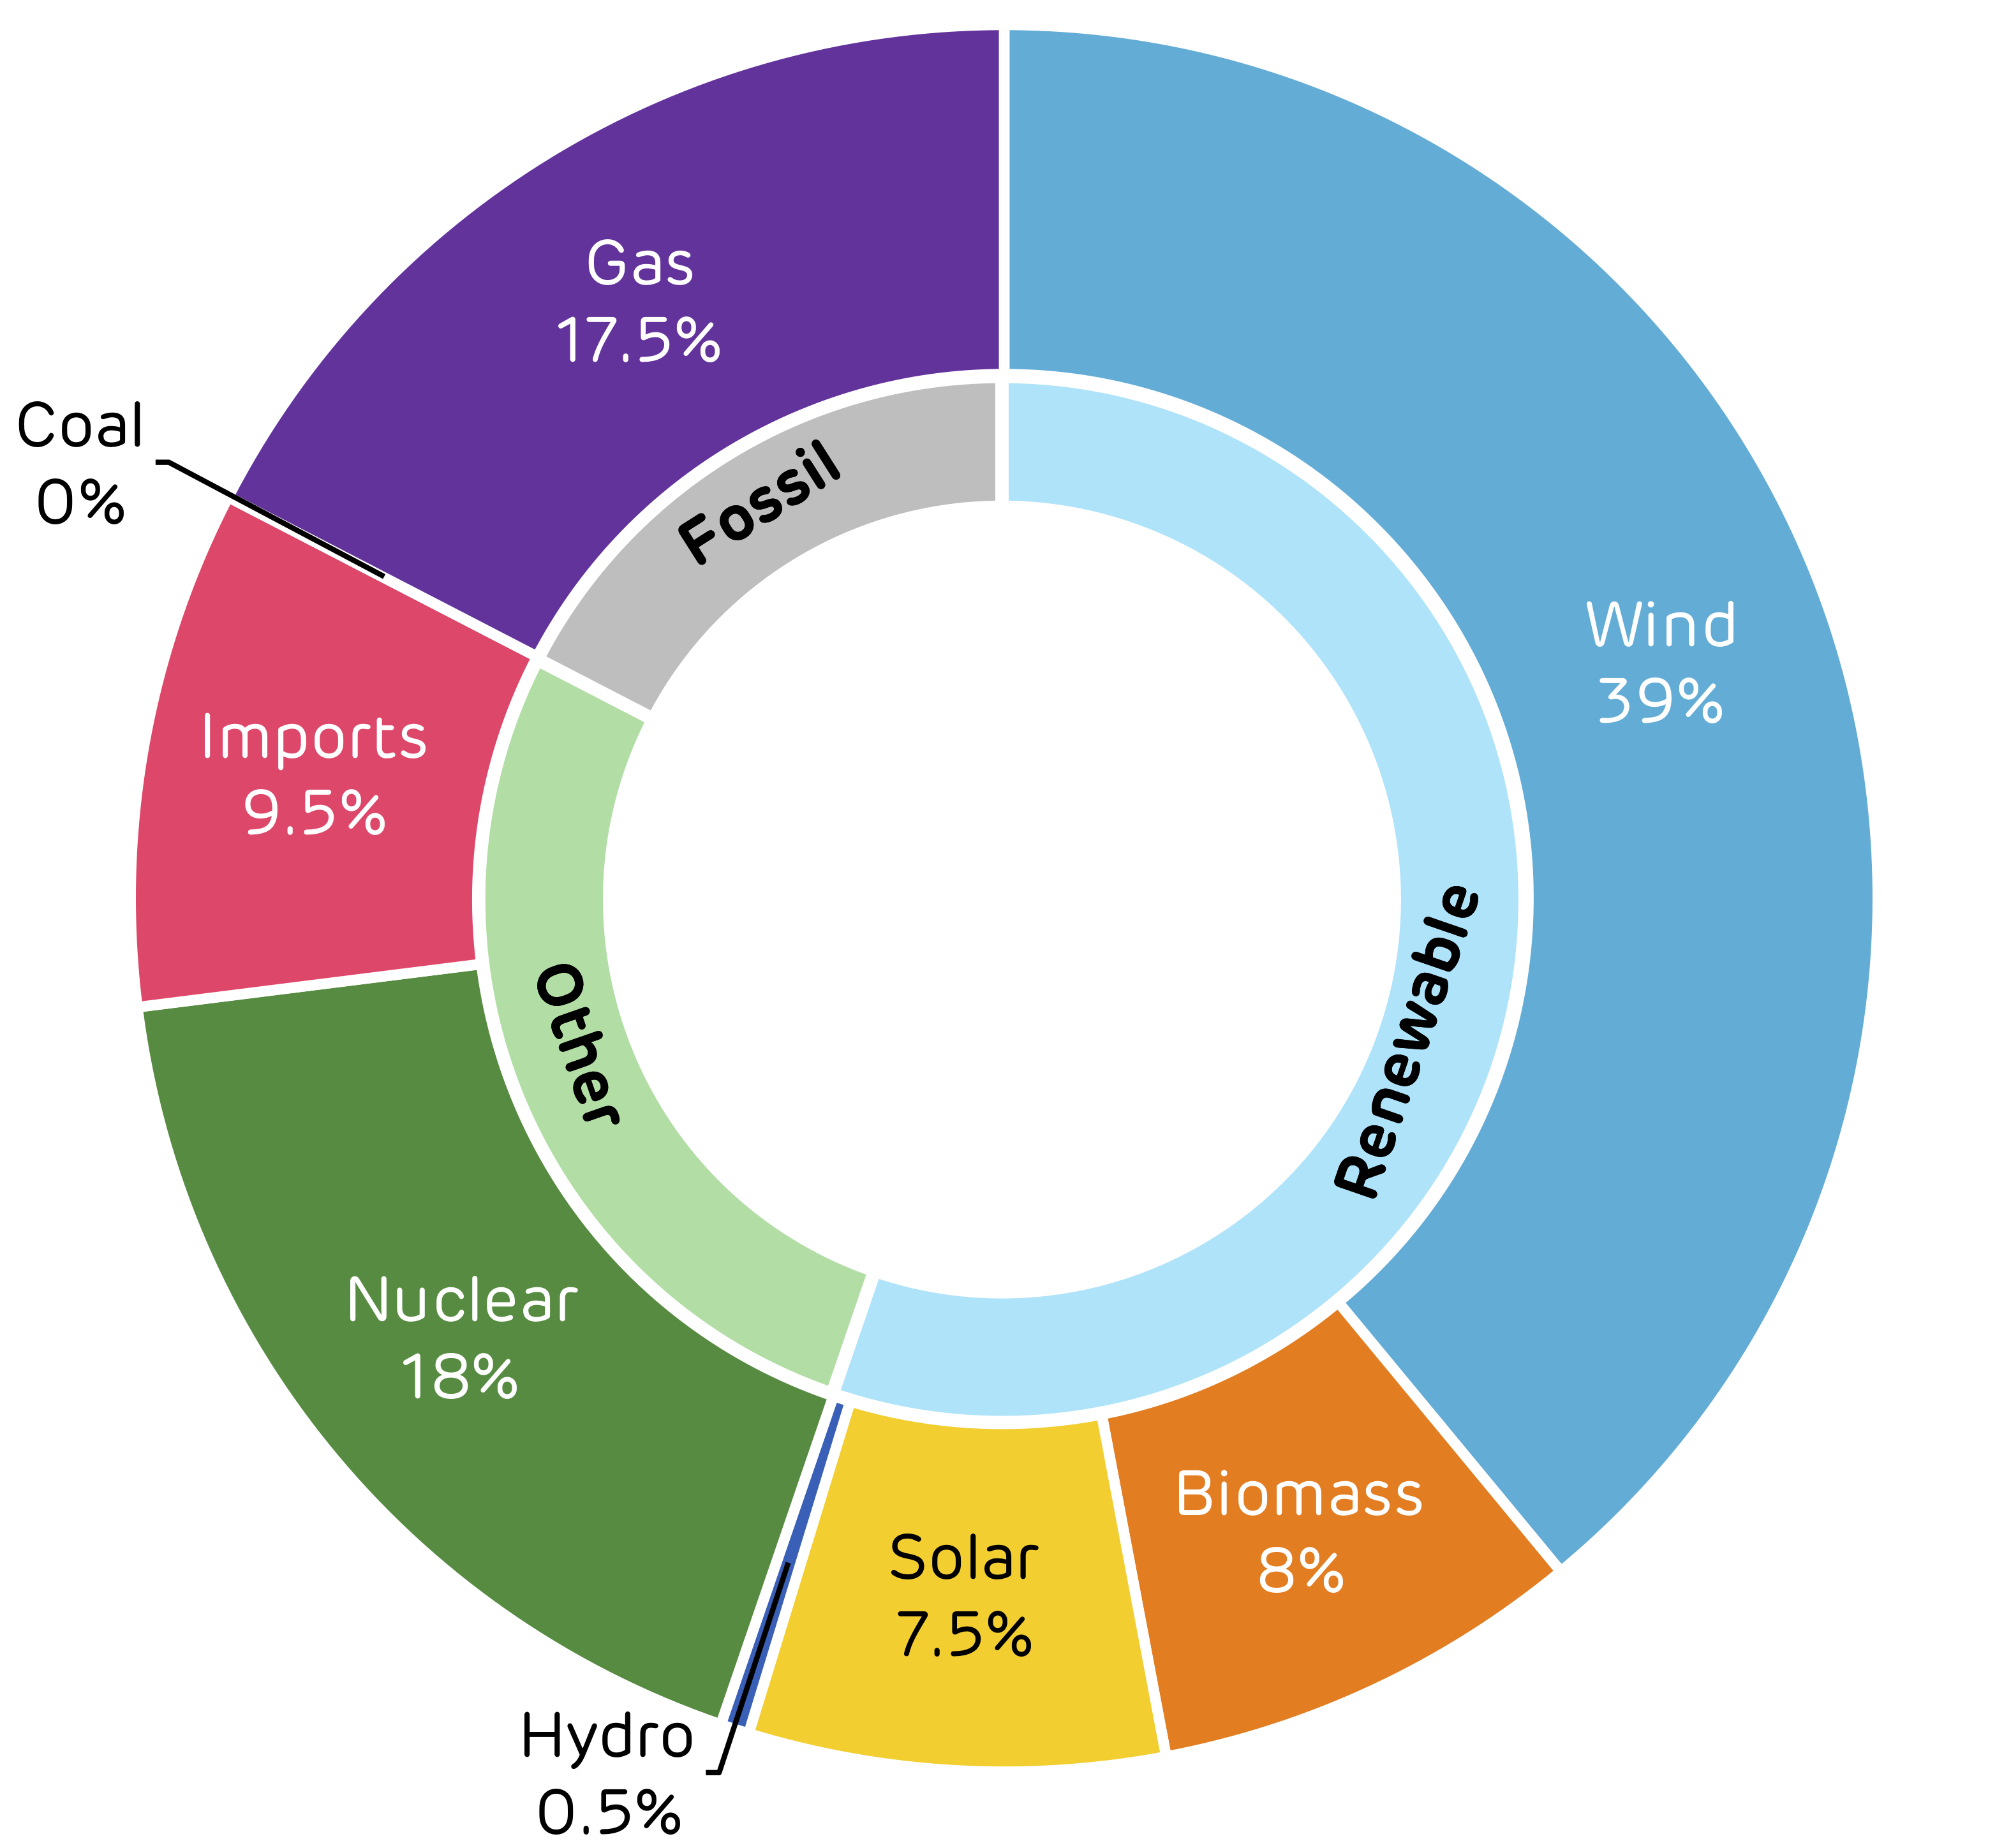
Fig 1 – Britain’s generation mix during June 30th that delivered electricity for less than 100g of carbon per kWh. Click to view/download.
June 30th was a record-breaker in a second way. Wind, solar, biomass and hydro supplied 55% of electricity demand over the day – smashing the previous daily record of 49% set last summer.

For the first day in the national grid’s history, more electricity came from renewables than any other source.
That day, Britain’s wind farms produced twice as much electricity as all fossil fuels combined. A quarter of the country’s electricity demand was met by onshore wind farms, and 15% from offshore.[4]
Despite several reactors being offline for maintenance, nuclear power provided nearly a fifth of electricity; again, more than was supplied by all fossil fuels.

The rise of renewable energy has been a major factor in decarbonising Britain’s electricity, complemented by the incredible fall in coal generation.
Every single coal plant in Britain has sat idle for at least two days a week since the start of spring.
It has been three years since Britain’s first zero-coal hour. A year later came the first full day, and earlier this year we saw the longest coal-free run in history, lasting 18 days. This summer could see the first full month of no coal output if this trend continues.
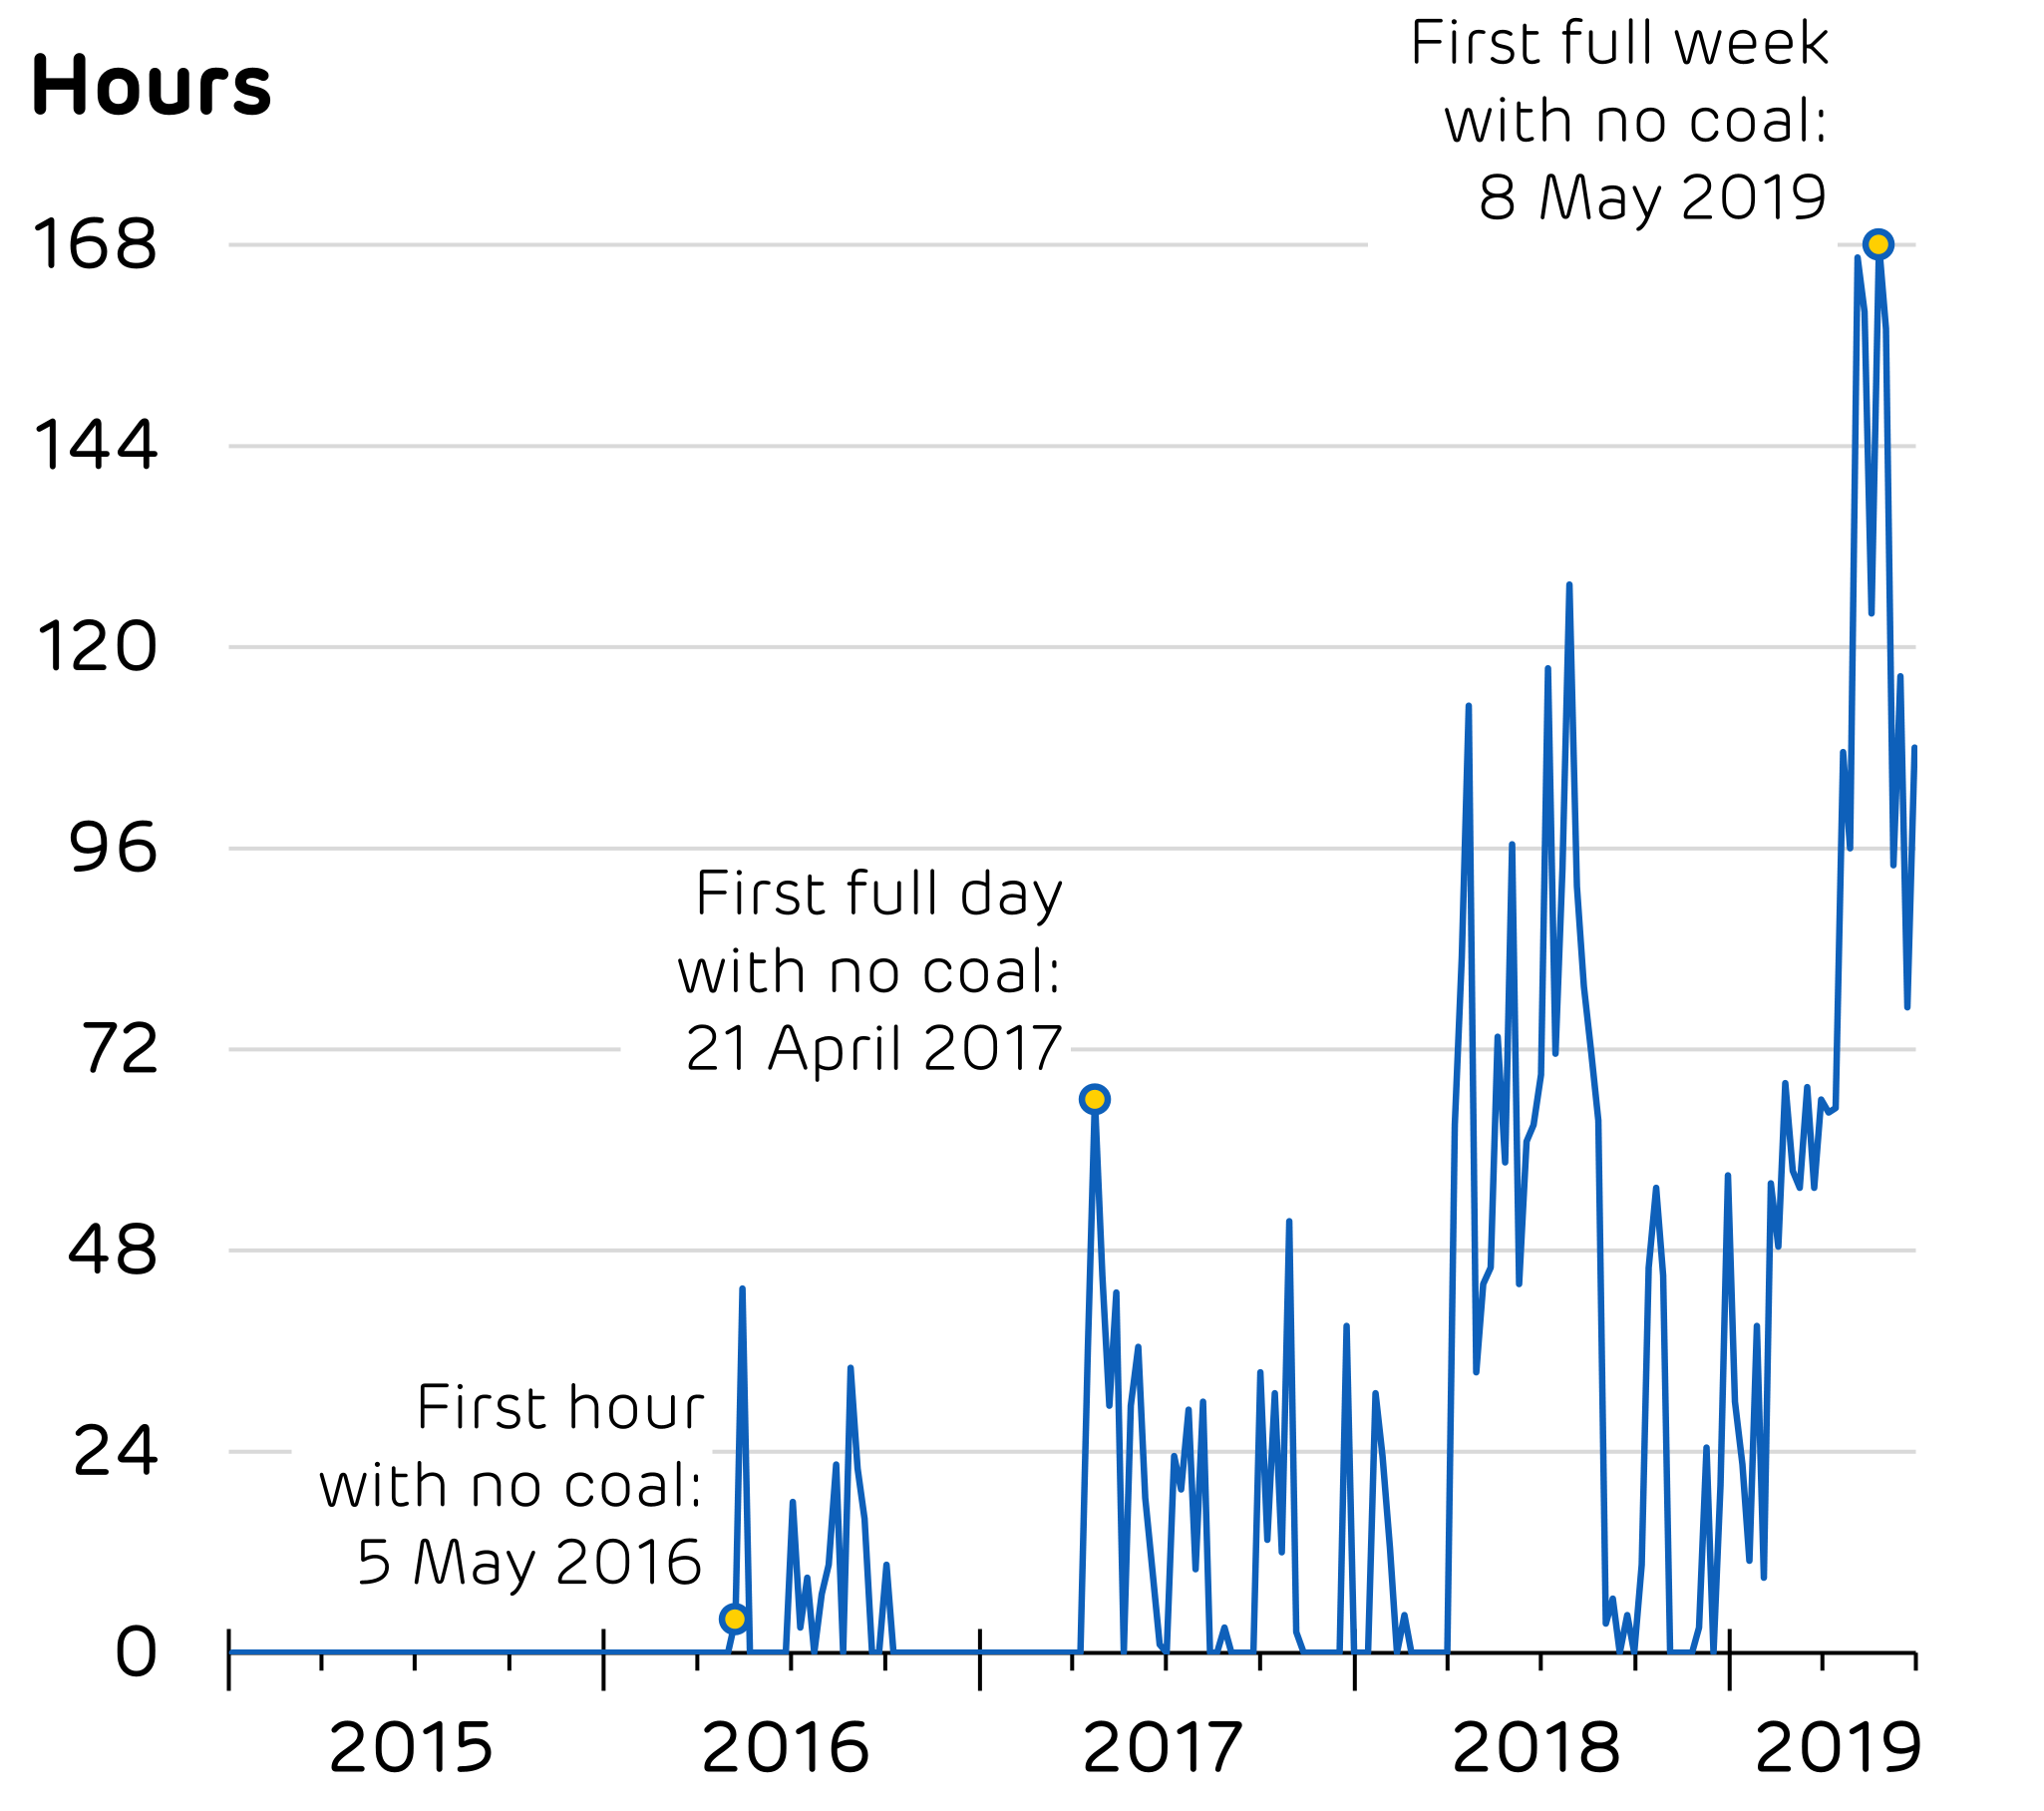
Fig 2 – Number of hours per week with zero generation from Britain’s coal power stations. Click to view/download.
Attention must now shift from ‘zero coal’ to ‘fossil free’.
Unabated natural gas (without carbon capture and storage) needs to be removed from the grid mix by 2050 to tackle the climate crisis and ensure the UK hits net-zero emissions across the whole economy.
At the start of this decade, Britain’s power system had never operated with less than half of electricity coming from fossil fuels.
As renewables were rolled out across the country the share of fossil fuels has fallen dramatically. By 2014, the grid was able to operate with less than one-third from fossil fuels, and by 2016 it had gone below one-fifth.
On May 26th, the share of fossil fuels in Britain’s electricity fell below 10% for the first time ever.
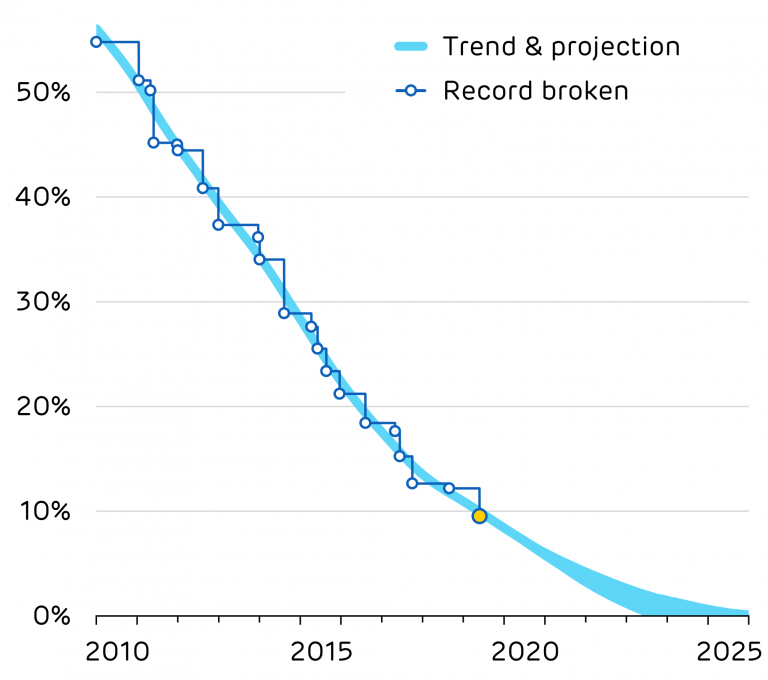
Fig 3 – The record minimum share of fossil fuels in Britain’s electricity mix over the last decade, with projections of the current trend to 2025. Click to view/download.
This record could have gone further though. During the afternoon, 600 MW of wind power was shed – enough to power half a million homes.
National Grid had to turn off a tenth of Scotland’s wind farms to keep the system stable and secure.
This wind power had to be replaced by gas, biomass and hydro plants elsewhere in the country, as these were located closer to demand centres, and could be fully controlled at short notice. This turn-down coincides with ten straight hours where power prices were zero or negative, going down to a minimum of –£71/MWh in the afternoon. National Grid’s bill for balancing the system that day alone came to £6.6m.
If the power system could have coped with all the renewable energy being generated, fossil fuels would have been pushed down to just 8% of the generation mix.
This highlights the challenges that National Grid face in their ambition to run a zero carbon power system by 2025 – and the tangible benefits that could already be realised today. If the trend of the last decade continues, Britain could be on course for its first ‘fossil-free’ hour as early as 2023. This will only be possible if the technical issues around voltage and inertia at times of high wind output can be tackled with new low-carbon technologies.
Other countries are grappling with questions about whether renewables can be relied on to replace coal and gas. Britain is proof that renewables can achieve things that weren’t imaginable just a decade ago.
Zero carbon electricity is “the job that can’t wait”. Britain only has a few more years to wait before the first “fossil-free” hours become a reality.
[1] Over the last decade, the carbon intensity of electricity generation in Britain has fallen faster than in any other major economy. Source: Energy Revolution: Global Outlook.
[2] In the 12 months to July 2019 carbon dioxide emissions from electricity generation totalled 60.5 million tonnes. In the 12 months to July 2013 these emissions were 160.2 million tonnes. Both figures include emissions from imported electricity, and from producing and transporting biomass. See Electric Insights and our peer-reviewed methodology paper for details of the calculation.
[3] In 2017 the UK’s cars emitted 70 million tonnes of CO2 and light-duty vehicles emitted 19 million tonnes. Source: BEIS Final greenhouse gas emissions statistics.
[4] Electric Insights now provides data on the split between onshore and offshore wind farms. Typically, around 2/3 of the country’s wind power comes from its onshore wind farms.