


Since the Paris Agreement came into effect in November 2016, it’s fair to say many countries have taken up the vital challenge of decarbonisation in earnest.
However, not all are making progress at the same rate. Many are not implementing the agreement at the pace needed to mitigate climate change, and keep the average global temperature increase well below 2oC of pre-industrial levels. Certainly not enough to limit the increase to 1.5oC by 2050, which the majority of climate scientists believe is necessary for the planet is to avoid dire consequences.
Last year even saw renewable energy investment fall 7%, while the money going into fossil fuels grew for the first time since 2014. And data released by the International Energy Agency (IEA) at the beginning of this month’s UN Climate Change Conference (COP24) in Katowice, Poland, found that 2017 was also the first for five years seeing an increase in advanced economies’ carbon emissions.
Despite this, there is much positive work towards decarbonisation.
A new report, Energy Revolution: A Global Outlook, by academics from Imperial College London and E4tech, commissioned by Drax, looks into the core areas and activities required to decarbonise the global energy system – and which countries are performing them to good effect. In doing this, the report also looks at how the UK stands in comparison and what steps countries need to take to truly decarbonise.
Here are the key indicators of decarbonisation and how countries around the world are performing towards them.

Dam in Hardangervidda, Norway
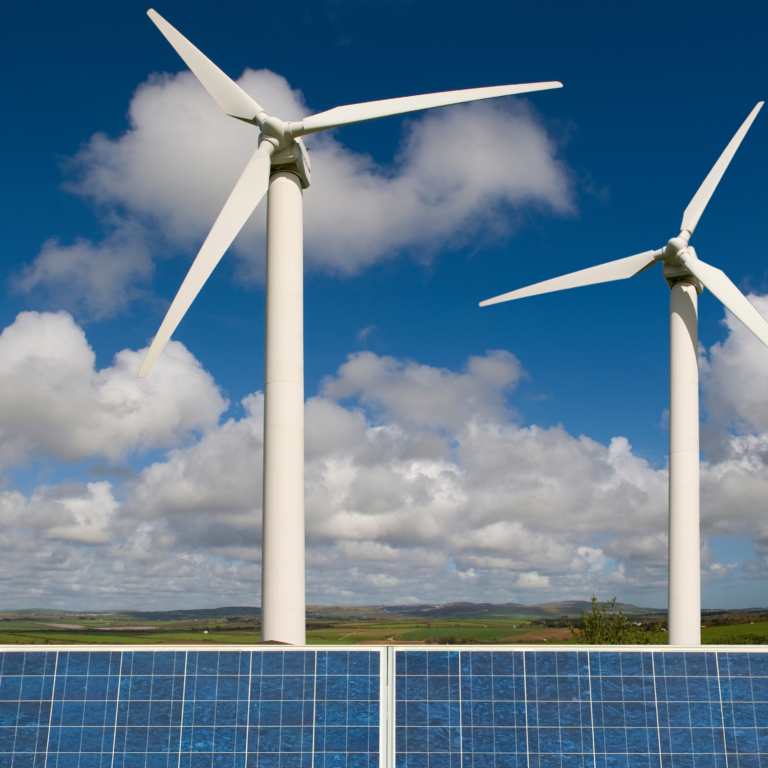
Clean power
At the forefront of reducing emissions and curbing climate change is the need to decarbonise electricity generation and move towards renewable sources.
Last year the global average carbon intensity was 440 grams of carbon dioxide (CO2) per kilowatt-hour (g/kWh). Out of the 25 major countries the report tracks, 16 came in below average, with seven of these falling under the long-term 50 g/kWh goal.
Leading the rankings are Norway, France and New Zealand, which have a near-zero carbon intensity for electricity generation, thanks to extensive hydro and nuclear power capacity.
At the other end of the table, China, India, Poland and South Africa remain wedded to coal, producing up to twice the global average CO2 for electricity generation. This comes despite China having installed two and a half times more renewables than any other country – it now boasts 600 gigawatts (GW) of renewable capacity.
Per person, Germany is leading the renewablesdrive with almost 1 kW of wind and solar capacity installed per person over the last decade. Despite this, as much as 40% of its electricity still comes from coal.
Part of the challenge in moving away from coal to renewables is economic, as many countries continue to subsidise their coal industries to keep electricity affordable. Phasing out these subsidies is therefore key to switching to a low-carbon generation system. Doing this works, as demonstrated by the example of Denmark, which cut its fossil fuel subsidies by 90% over the past decade, in turn successfully cutting its coal generation by 25%.

The UK’s carbon pricing strategy, which adds £16 per tonne of CO2emitted on top of the price set by the European emissions trading system (EU ETS), has led the carbon intensity of Great Britain’s electricity to more than halve in a decade. It highlights how quickly and effectively these kinds of fees can make fossil fuels uneconomical. Since 2008 the UK has removed more than 250 g/kWh from its electricity production.
Carbon capture and storage
In many future looking climate scenarios, keeping the earth’s temperature below a 2oC increase depends on extensive deployment of carbon capture technology – capturing as much as 100 billion tonnes of CO2 per year. Storing and using carbon is clearly forecast to be a major part of any attempt to meet the Paris Agreement, but at present there are few facilities carrying it out at scale.
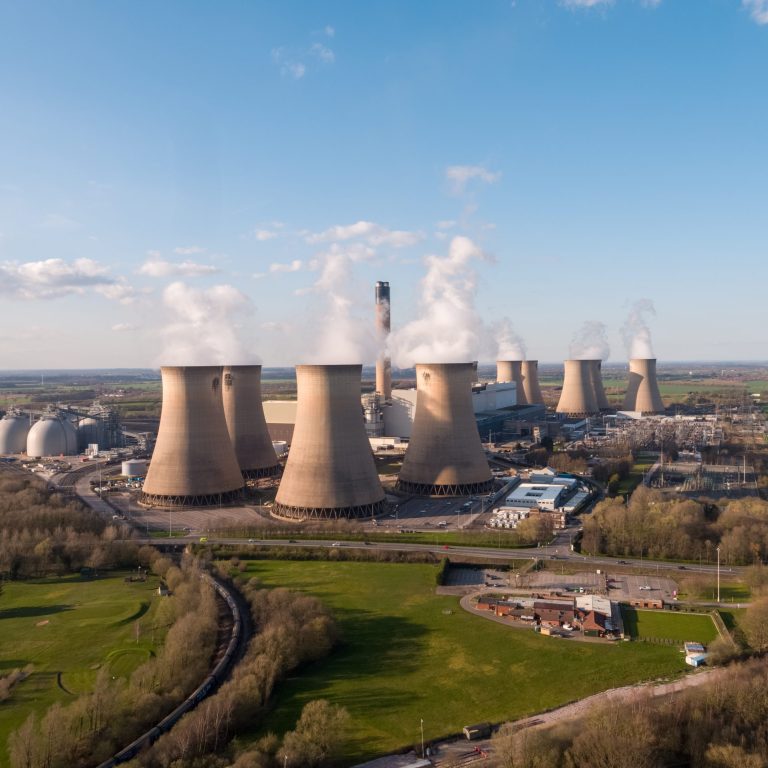
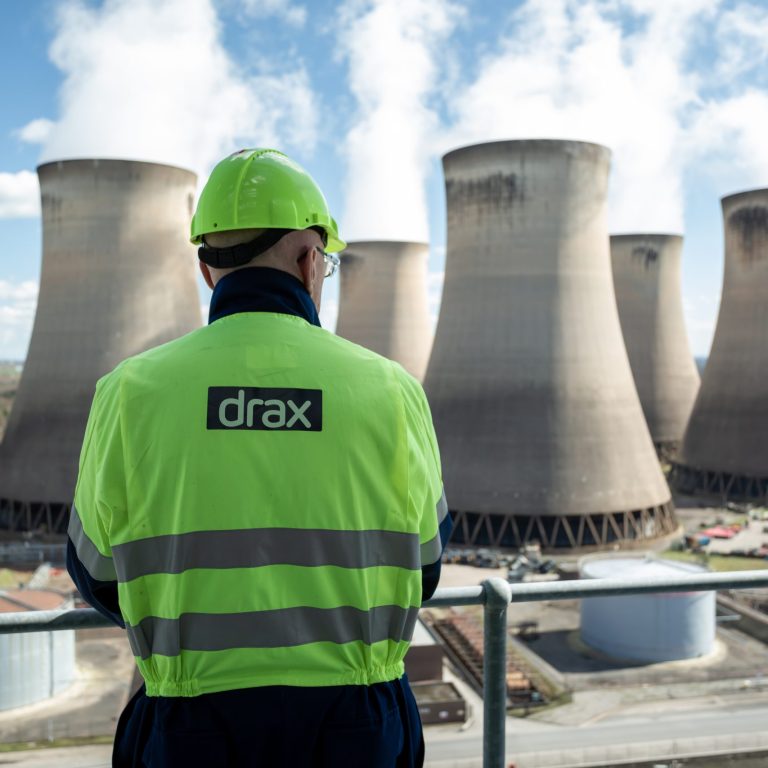
Around the world today there are 18 large-scale carbon capture and storage (CCS) units running across six countries with a total capacity to capture 32 million tonnes of CO2 per year (MtCO2p.a). Another five facilities are under construction in three countries to add another 7 MtCO2p.a of global capacity. In the UK, Drax Power Station is piloting a bioenergy carbon capture and storage programme that could make it the world’s first negative emissions power station.
The USA has the greatest total installed capacity at 20 MtCO2p.a., but per person it ranks behind Norway, Canada and Australia. Their smaller populations give them more than 200 kg of carbon capture capacity per person per year.

Oil platform off the coast of Australia
These figures are well below the 100 billion tonnes the IEA estimates need to be stored by 2060 to prevent temperatures reaching 2oC more. However, considering the US alone has a potential storage capacity of more than 10 trillion tonnes of CO2, the potential of storage is not expected to be a problem.
Using depleted oil or natural gas fields as storage for captured carbon is being explored in a number of regions, with the US establishing several projects with more than 1 million tonnes in capacity. In 2019, Australia will open the world’s largest CO2store with the capacity to capture between 3.4 million and 4 million tonnes a year from Chevron’s Gorgon gas facility.
Considering the storage capacity available globally, it’s a matter of deploying the necessary technology for CCS to have a significant impact on emissions and global warming. The UK is perhaps a typical example of where CCS is at present with estimated storage capacity of 70 billion tonnes, as much as half of the entire EU combined. By repurposing North Sea oil and gas fields in partnership with Norway, the UK could pool its carbon storage capacity.
Electrification
Electricity generation is one of the main targets for emissions reductions globally. As a result of the progress that’s been made in this field, many future-looking scenarios highlight the important of electrification in other sectors, such as transport, in turn making them less carbon intensive.
Transport is leading the charge globally – there are now 10 different countries where one of every 50 new vehicles sold is electric. In Norway, this ratio is almost one in two, thanks in part to generous tax exemptions as well as non-financial incentives like access to bus lanes and half-price ferries.

Perhaps surprisingly, China is the world’s largest electric vehicle (EV) market. It may still use significant amounts of coal, but its commitment to reducing urban air pollution has seen it push EVs heavily, and it now accounts for 50% of the global battery EV market on its own.

Chinese electric car charging stations
Of course, adoption of EVs requires the supporting infrastructure to be truly successful. In conjunction with its high sales, Norway leads the way in charging points per capita, with one for every 500 people. This compares to one charger for every 5,000 people in the UK and one for every 10,000 people in China.
Electrification also affects the energy intensity of country’s transport systems and while it may be the largest EV market, China’s rise in private vehicles has been largely driven by petrol and diesel models. The result is the largest increases in transport energy intensity and emissions has taken place in China, Indonesia and India, respectively.
Domestic energy intensity is also rising in China, Indonesia and South Africa, as greater numbers of people gain access to appliances and home comforts. Conversely in Europe, Portugal, Germany and the Netherlands have all seen their domestic energy intensity drop in the last decade. However, this may be the lingering effect of the 2008 recession rather than long-term efficiency improvements.
The efficiency of industrial processes is also an important barometer in decarbonisation. Activities like mining and manufacturing require heavy-duty diesel-powered machinery and often coal-powered generators, especially in BRIC nations. The exception is China, where plans to get the 1,000 most energy-intensive companies to reduce their energy consumption per unit of GDP produced by 20% over the last five years, has proved fruitful.
Norway’s heavily-electrified industries, however, are still energy intensive and its level of carbon intensity is vulnerable to fluctuations in power generation prices.

Electrification and reduced emissions require government policies to put in motion behavioural changes that can lead to lasting decarbonisation. “Robust carbon pricing is one of the most effective tools to enabling a zero carbon, lower cost energy future,” Drax Group CEO Will Gardiner commented recently.
Welcoming a November report by the Energy Transitions Commission, Gardiner said:
“The cost of inaction far outweighs the cost of doing something now.”
Explore the full report: Energy Revolution: A Global Outlook.

I. Staffell, M. Jansen, A. Chase, E. Cotton and C. Lewis (2018). Energy Revolution: Global Outlook. Drax: Selby.