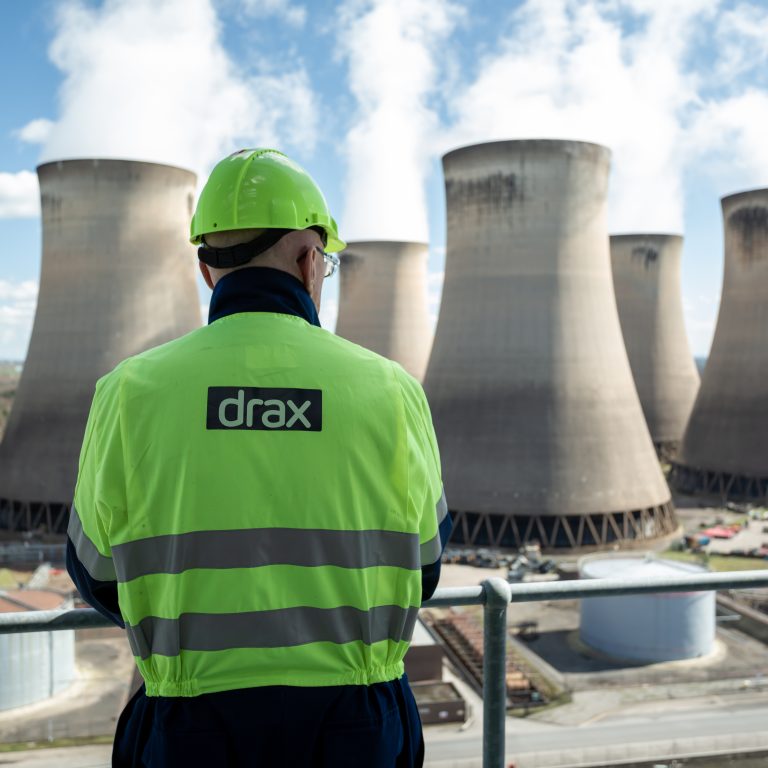


Britain’s Blackout
Chapter 1:
Introduction
On the 9th of August, Britain experienced its worst blackout for a decade.
Over 1 million people went without power, a sharp reminder that life is very difficult if the grid doesn’t manage to “keep the lights on”. That common phrase fails to capture the deep disruption caused in workplaces, hospitals and transport links. Ordinary lights going off was not the issue. Two aspects of this are worrying: three sources of generation failed very shortly after a lightning strike, and critical pieces of the country’s infrastructure lost power when they shouldn’t have. Both of these reveal a mix of technical and administrative problems, along with a good measure of bad luck.
National Grid has published its technical report to Ofgem on the incident, and BEIS is conducting a comprehensive review, including the economic damage caused. Here, we summarise what happened, discuss the broader implications for the power system, and ask whether we should spend more on trying to prevent this happening again.
Chapter 2:
What happened?
Three sources of power generation failed within half a second of one another. 6% of generation, or 1.9 GW, was lost. The grid is only designed to cope with the sudden loss of the largest single component in the power system (normally Sizewell B at 1.2 GW). That could have covered two of these failures, but not all three simultaneously. Not enough power could be supplied to meet demand, and so 5% of customers were automatically disconnected to prevent the grid from complete collapse. While this was painful for those involved, it saved the whole country from losing power, which could have taken days to recover from.
The problems began when lightning struck a power line just before the Friday rush-hour. This sounds dramatic, but it happens thousands of times a year. Circuit breakers automatically disconnected the line in less than a tenth of a second to isolate the current surge from the lightning bolt. About 20 seconds later they reconnected the line, and normally this would have been the end of the story.
The large wind farm at Hornsea (100 km out in the North Sea) disconnected itself from the grid 0.3 seconds after the lightning strike. It detected a voltage disturbance when the power line was disconnected, and attempted to help correct it by injecting ‘reactive power’. Something went wrong and two banks of wind turbines disconnected to protect themselves.1 737 MW of generation was lost.
Within half a second of the lightning strike, a steam-turbine shut down at Little Barford gas power station, which is connected to the affected power line. The turbine had reacted to abnormal speed readings, which were probably not true because the control systems were disrupted when its power supply switched over to battery back-up.1 This is unusual, and looks like an equipment failure of some kind. A further 244 MW of generation was lost.
The voltage disturbance caused by the power line and generators disconnecting then rippled out through the grid. Lots of small distributed generators2 saw this and the resulting drop in frequency as a loss of mains power, and so disconnected for safety reasons.3 These systems were still using outdated forms of ‘Loss of Mains’ protection which are banned in new installations, as it is known they can be outwitted by grid disturbances. Another 500 MW was lost.
With over 1,480 MW of generation suddenly disconnected, more power was being taken out of the grid by consumers than was being put in by generators. This caused all generators across the country to start slowing down, and their speed – the grid’s frequency – fell from 50 Hz down to 49.1 Hz over the next 20 seconds. While this fall of 1.5% might not sound like much, National Grid has an obligation to keep frequency within 1% of its normal value, its “statutory limit” of between 49.5 and 50.5 Hz.
While the frequency was dropping, the first line of defence started coming to the rescue. National Grid keeps “response and reserve” to cover certain types of failure, and was holding 1,338 MW of frequency response made up of batteries, automatic demand response and part-loaded generators. Over the coming seconds 1,080 MW was delivered, which arrested the fall in frequency. A second gas turbine then failed at Little Barford and a further 210 MW was lost.
This sent the system frequency below the critical threshold of 48.8 Hz (2.4% below normal). At this point, National Grid ordered the second line of defence, “Low-Frequency Demand Disconnect” (LFDD). Like a surgeon deciding to amputate a limb to save the patient, around 5% of demand was disconnected from the grid. This helped to bring demand back in line with supply and allow frequency to be restored, but it meant cutting power to over a million customers.

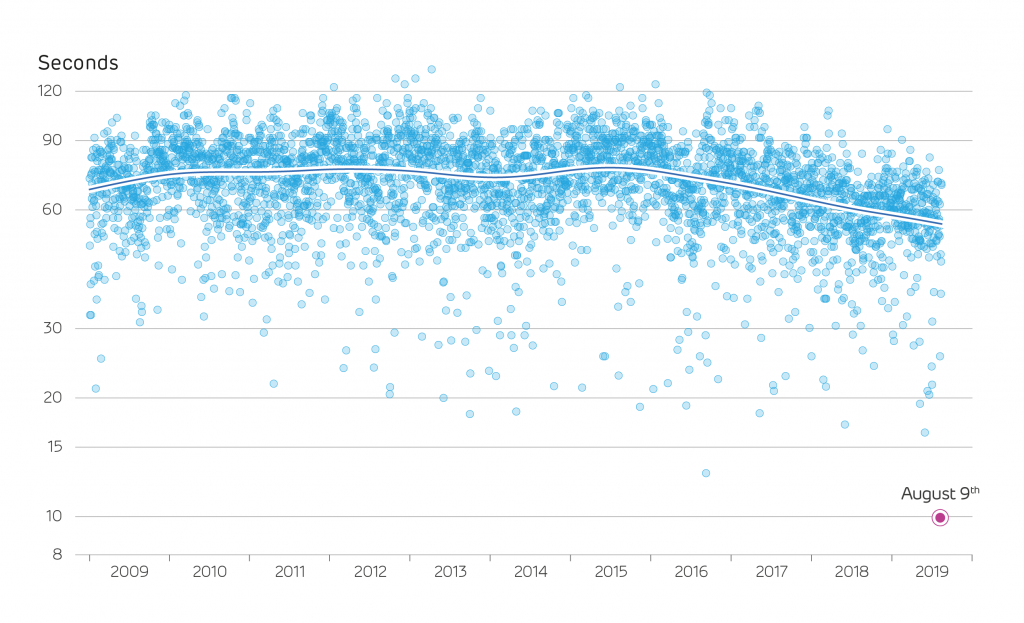
THE MINIMUM SYSTEM FREQUENCY EXPERIENCED EACH DAY SINCE 2009
Chapter 3:
Who was affected?

So, who got disconnected and why them? The frequency drop affected the whole country equally, so it was not just those close to the original lightning strike that were affected. The disconnections were made by the regional distribution network operators (DNOs) who run the local wires, and were automatic and pre-programmed. In total, 1.15 million customers were disconnected across England, Wales and Scotland. National Grid gave the green light to start reconnecting customers about 15 minutes after the power cuts happened and all customers were back on supply with 50 minutes.
Losing power for an hour can be very inconvenient for a household, but for some larger customers it can cause chaos. Large customers can declare under the Electricity Supply Emergency Code that they shouldn’t be disconnected because they have critical functions, and the pre-programming will take account of this. Newcastle Airport lost power because they had not opted to be a Protected Site and so their contract permitted disconnection.1 The airport did at least have standby generators and batteries to keep essential safety systems running, although not the rest of their services.
Ipswich Hospital also lost power. It was not disconnected by the network operator, but by its own protection systems over-reacting to the problems on the grid.1 Again, it had standby generators to cover some, if not all, of its services.
The railways were also badly affected. Major signalling centres and the supplies for electric trains are Protected Sites, so what went wrong? Two substations feeding DC power to railway lines reacted to the low frequency by disconnecting, which stopped some trains temporarily. The most significant problems were caused by the trains themselves. A class of trains operated by Thameslink running north of London shut down because they were programmed to do so if the frequency was abnormal.1 It is not clear why 49.0 Hz was chosen as the trigger point for these trains to shut down, and that will need to be reviewed and possibly changed. Some drivers were able to ‘reboot’ their trains and get going again but others found they could not because of a software update. Technicians had to be sent to the trains to get these trains restarted, which caused severe delays.
Chapter 4:
Are wind farms making things worse?
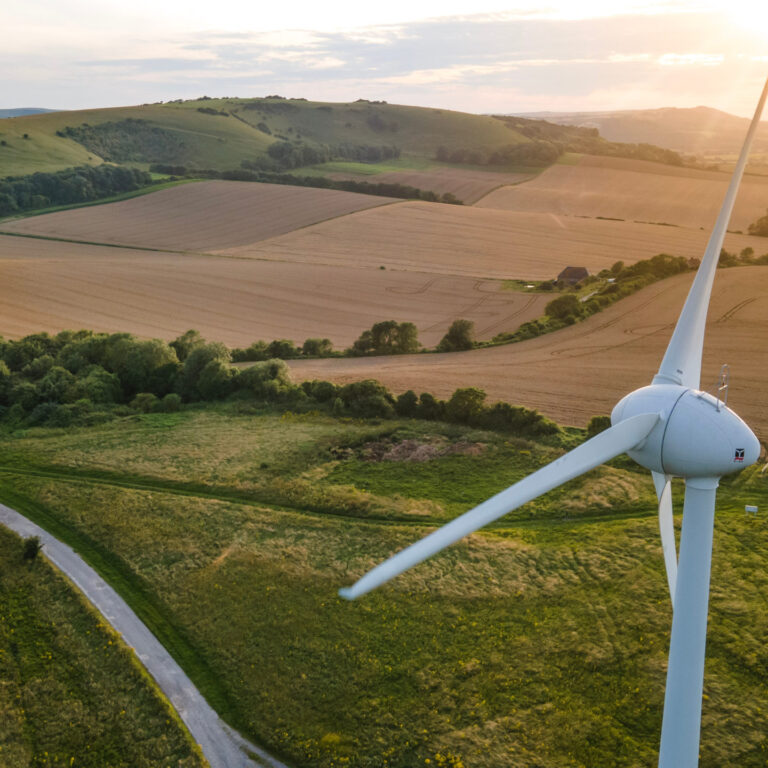
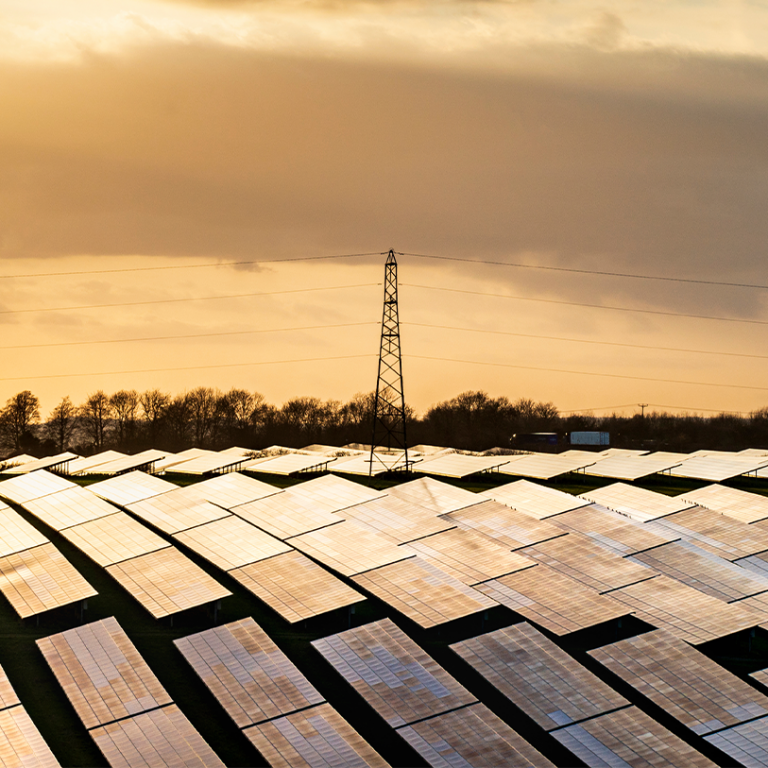
Nothing in the August power cut was a result of wind being intermittent or variable.4 While wind output was high that day, supplying nearly a third of demand, there was no sudden reduction of wind speed leading to loss of wind power.
There was a sudden loss of one wind farm but others in the region carried on operating as normal. Hornsea was only partially built, and not all wind turbines had been commissioned. Two 400 MW modules were running under some temporary arrangements with the grid, and not in their final configuration. This is a pragmatic arrangement as it allows partly-built wind farms to generate clean electricity rather than keeping their turbines idle, but this may need reviewing in future.
There is a broader question around the move to higher shares of renewable generation. Wind and solar farms do not have heavy spinning metal turbines which provide ‘inertia’, the shock-absorbers of the power system. As we move to less conventional generation, the power system is seeing higher rates of change of frequency. This is giving National Grid less time to react to problems on the system.
How much time we have to correct a problem before system frequency has fallen by 1%
On August 9th, the frequency drop was the fastest we have ever experienced, peaking at about 0.16 Hz per second. The sustained rate of change meant National Grid had less than 10 seconds to react before frequency had fallen outside of normal operating limits (below 49.5 Hz).
This ‘speeding up’ is a direct result of more wind, solar and sub-sea interconnectors. However, it is being counterbalanced by new technologies that provide response and reserve services. Nearly half of National Grid’s response came from batteries, which were exceptionally fast to reach full power. The traditional spinning generators, which would have been the only recourse a decade ago, took much longer to respond.
Chapter 5:
How common is this?
Britain has seen four large power cuts in the last twenty years. These are quite different from one another and reveal a variety of causes:
August 2003
Large parts of south London suffered a power cut, including railway and tube lines. This time it was an equipment failure. A transformer in a National Grid substation had to be taken offline; power flow redirected to other lines as normal, but a circuit breaker then tripped because of incorrect settings.
May 2008
A coal-fired power station in Scotland and the Sizewell B nuclear reactor in Suffolk failed within 3 minutes of another. This is very similar to the event this August: National Grid’s reserve and response could not keep the frequency from falling, some distributed generation also disconnected, and LFDD led to power cuts affecting half a million customers. The generator failures appear to have been unrelated though.
Christmas 2013
Heavy storm damage caused power cuts affecting more than a million people. 16,000 customers without power for more than 48 hours. Local power lines were blown over across almost the entire country, swamping the DNO repair crews. Making more use of underground cables rather than overhead lines on poles would help but that would be a vastly expensive and disruptive conversion job.
These events highlight the many challenges facing grid operators: storm damage, unexpected generator shut-downs and equipment failure in the grid. These large events seem to happen every five years. Of course, local power cuts are more common, especially in rural areas; however, each one affects fewer people.

It is important to note that limiting blackouts to once every 5 years appears to be the best that can be achieved worldwide. The national grid is among the most reliable power systems in the world – better than much of Europe or the Americas.
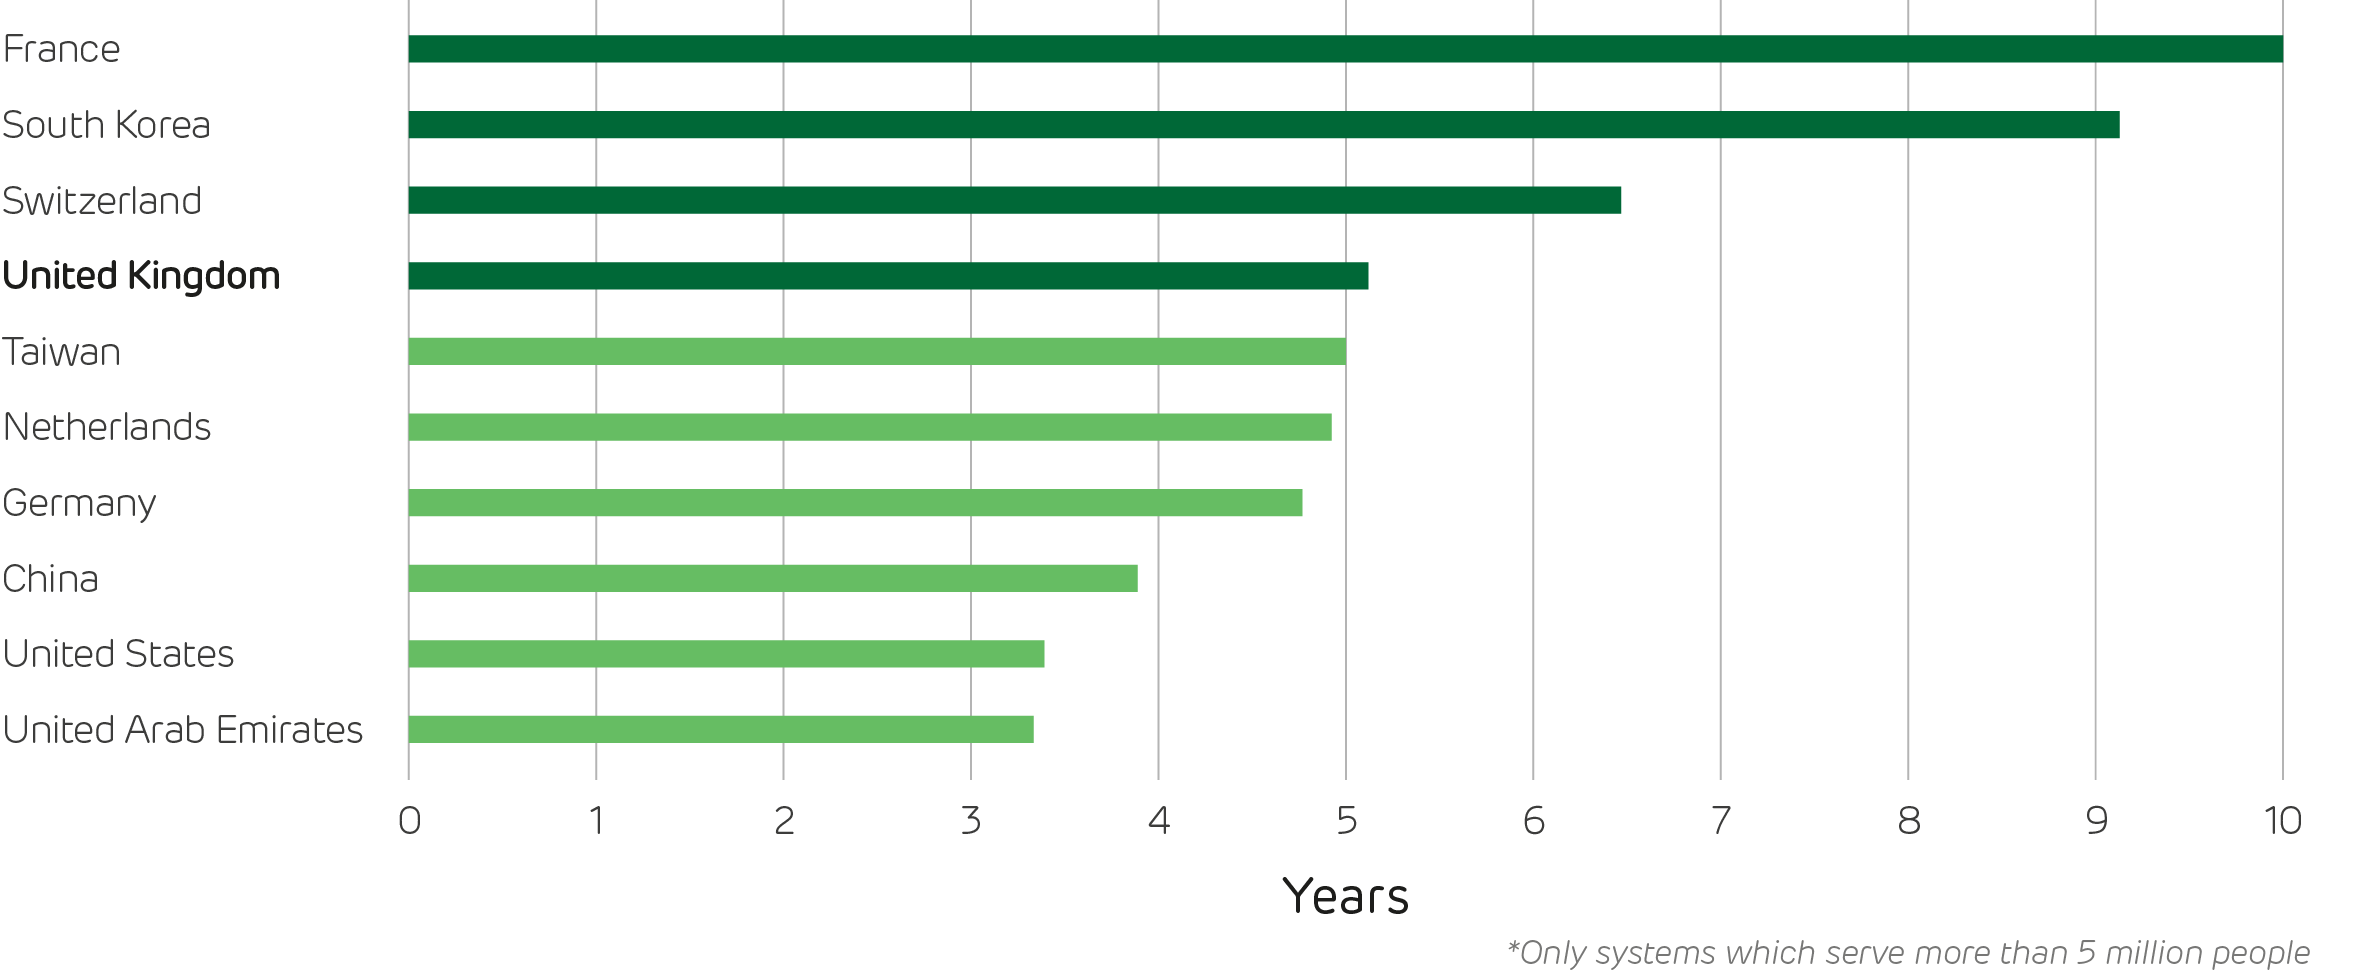
The ten most reliable power systems in the world, measured by the time between blackouts.5
Chapter 6:
Can we stop this ever happening again?
If we want to stop power cuts happening we have to think about all the causes. Focusing on sudden outages of generators, we would need to look at the regulation that defines what National Grid has to guard against: the Supply Quality and Security Standard (SQSS). This requires the grid to remain operational after the loss of a single ‘generating unit’, ‘power park’ or ‘converter station’. National Grid holds enough response and reserve to cover for losing the biggest unit in operation that day.6
The obvious question is do we want to cover for two large units suffering problems, rather than just one? Doing so would have meant that the 2008 and 2019 power cuts would have been avoided, but not the 2003 or 2013 ones. This wouldn’t cover three large units failing in quick succession. It would mean an increase in costs of procuring those response and reserve services.
Chapter 7:
Are we spending enough on security?
It is difficult to judge whether we should invest more money to prevent further black outs. The instinctive answer is ‘yes of course’, but if that extra money achieves very little over and above the current standards, it would be better spent on other ways to improve our quality of life.
Two elements of this are what might it cost to improve security, and how much money could that save from reduced blackouts? Neither are easy to estimate.
National Grid spends about £380m per year on response and reserve services to help in events like this. It passes those costs on through ‘Balancing Use of System Charges’ to generators and retailers. The share paid by domestic customers adds around £5 per household per year. It is not as simple as saying we need to double this to cover two outages but that is a rough guide. Preventing the recent blackout would have required more response but not more reserve, although doubling the amount of response held would likely be very expensive.
The harder one to estimate is what it would be worth to avoid blackouts. Would you be willing to pay an extra £15 per year to avoid a 5% chance of being stuck in the airport or on a train once every five years? Your answer may well depend on whether or not you were affected by the August power cut.
Ofgem use a ‘value of lost load’ for such questions. A kWh of demand not served by power stations is worth £17, or about 100 times the typical price consumers pay. During the blackout, about 5% of load was cut off for up to an hour – around 0.9 million kWh, valued at £15 million. If this happens every five years, perhaps we should ‘rationally’ want to spend an extra 10 pence per household per year to eliminate it. There is little evidence to suggest that £17/kWh is the correct value,7 or that people’s preference for uninterrupted electricity follows an economist’s cost-optimisation algorithm.
For international context, 50 million people across the US and Canada experienced up to four days without power in 2003, which was estimated to cost $6bn in lost productivity and damage. In the same year, 50 million people in Italy and Switzerland suffered a one-day blackout, costing upwards of €1bn.7
Chapter 8:
What lessons can we learn?
There are many issues to consider and lessons to learn. First would be to uncover the detailed technical reasons for the outages at Little Barford and Hornsea and try to ensure that both of those problems are made less likely. Hornsea was only partly complete and running under temporary grid-code arrangements. Perhaps new farms should have grid code compliance assured one module at a time, and operators should be more careful over the configurations that may be used for very large wind farms.
The second issue is that of common-cause events. The 2008 power cut was two power stations failing in unrelated events – just bad luck. Should we see this 2019 outage of two power stations and a share of distributed generators as having a common-cause? They were all unfortunate reactions to the lightning strike, but perhaps this was also in ‘bad luck’ territory It was already known that older distributed generators were prone to ‘sympathetic tripping’, disconnecting when mains electricity was not actually lost. The protection systems of older and vulnerable distributed generators are being replaced in an ‘accelerated’ industry campaign that completes in 2022. Perhaps this could be accelerated further? Perhaps National Grid should factor these devices into their largest loss of load calculation until they have been upgraded?

Finally, the ensuing power cut caused more disruption than should be expected. Newcastle Airport did not class itself as critical infrastructure. Ipswich Hospital did not cope with the switch to backup power. Some trains were set to turn off, and many could not be restarted. Organisations across the country would be well-advised to check if they can and should be Protected Sites and whether their own protection systems are appropriately configured.
Then looking beyond technical elements: perhaps there needs to be a public discussion about the appetite for paying to reduce the risk of demand disconnections (LFDD) by requiring National Grid to purchase larger volumes of reserve and response. Similarly, perhaps this event will raise awareness for critical infrastructure provides about what sort of grid conditions should be planned for and immunised against (e.g. adjusting over-sensitive internal protection, providing UPS etc)
There is nothing to suggest these events are more likely today than they were 10 years ago, so it would be difficult to justify spending more to reduce the risks in future. That said, Britain’s power system is changing rapidly and so we need to be ready for the different kinds of problems that will be faced in the future.
Both the supply and demand for electricity are going through unprecedented changes as new technologies take hold. Britain already has more renewables than fossil capacity, and the balance is set to shift further as all coal stations retire by 2025. More wind and solar will come online, backed up by batteries, more interconnectors to the continent and bigger nuclear reactors. National Grid is preparing itself to manage a zero-carbon electricity system, and must develop new tools and markets to replace the traditional steam and gas turbines it once relied upon. Put together, these not only change the size of failures that could be expected, but also the location of them, and the balance between centralised and distributed sources (the latter which could potentially be invisible or uncontrollable to the system operator).
Demand will also change dramatically, as efficiency improvements continue to shrink the traditional pattern of consumption, and new technologies like electric vehicles and heat pumps come into the mainstream. Smart systems mean consumers could be a major part of the solution, with power companies quick to offer ‘smart hot water tanks’ that will help in the event of blackouts in future.
While Britain has one of the most secure electricity systems in the world, it is worrying that events like this expose several flaws. It is little comfort to those affected to say the power system worked exactly as expected. Engineers will continue analysing the events of August 9th for years to come, but they must also be quick to develop new ways of keeping Britain’s power system under control as it moves into bold new territory.
The lead author of this special report is Professor Tim Green from Imperial College London. Dr Iain Staffell is main author of the Electric Insights Quarterly report in which it first appeared.
Electric Insights is commissioned by Drax and delivered by a team of independent academics from Imperial College London, facilitated by the college’s consultancy company – Imperial Consultants. The quarterly report analyses raw data made publicly available by National Grid and Elexon, which run the electricity and balancing market respectively, and Sheffield Solar. Read the full Q3 2019 Electric Insights report or download the PDF version.
- 1 According to National Grid’s interim and final reports on the event.
- 2 These include gas engines in factories, anaerobic digesters at farms, and small wind turbines and solar panels. Some failed before the larger transmission-connected generators and some failed after, depending on the type of Loss of Mains protection they used.
- 3 They disconnected to avoid ‘islanding’, when a small generator continues to provide power when electricity is supposed to be off for safety reasons.
- 4 Calculated from the fastest negative rate of change of frequency seen each day, based on 15-second average data from Elexon.
- 5 Data from the World Bank, CEER and EIA. The most recent data available for each country are used, typically 2012–2018.
- 6 Plus some further reserve to make sure the system is covered again 30 minutes later for a second outage.
- 7 Royal Academy of Engineering, 2014. Counting the cost: the economic and social costs of electricity shortfalls in the UK. https://www.raeng.org.uk/publications/reports/counting-the-cost