


Drax Group plc
(“Drax” or the “Group”; Symbol:DRX)
RNS Number : 2763E
| Twelve months ended 31 December | 2019 | 2018 |
|---|---|---|
| Key financial performance measures | ||
| Adjusted EBITDA (£ million) (1)(2) | 410 | 250 |
| Net cash from operating activities (£ million) | 413 | 311 |
| Net debt (£ million) (3) | 841 | 319 |
| Total dividends (pence per share) | 15.9 | 14.1 |
| Adjusted basic earnings per share (pence) (1) | 29.9 | 10.4 |
| Total financial performance measures | ||
| Operating profit (£ million) | 62 | 60 |
| Profit after tax (£ million) | 1 | 20 |
| Basic earnings per share (pence) | 0.1 | 5 |
Financial highlights
- Group Adjusted EBITDA up 64 percent to £410 million (2018: £250 million)
- Includes £114 million from acquired hydro and gas generation assets (2019 guidance of £90-110 million)
- Strong cash generation and balance sheet
- Net cash from operating activities up 33 percent to £413 million (2018: £311 million)
- 9x net debt to Adjusted EBITDA adjusted to reflect Capacity Market payments received in January 2020
- Refinancing of hydro and gas generation assets acquisition facility completed, includes ESG CO2-linked facility and infrastructure private placement extending to 2029 – interest rates below three percent
- Sustainable and growing dividend up 13 percent to 15.9 pence per share (2018: 14.1 pence per share)
- Final dividend of 9.5 pence per share (2018: 8.5 pence per share)

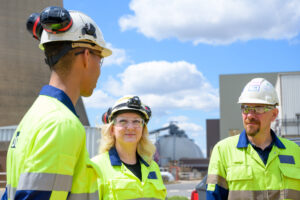
Engineer planning work near Cruachan Power Station dam and reservoir
Operational highlights
- Reduction in US self-supply pellet cost – $161/tonne(4) (2018: $166/tonne(4))
- Strong system support performance – 63 percent increase in value from flexibility(5) – £129 million (2018: £79 million)
- Integration of acquired hydro and gas generation assets complete
- 47 percent reduction in reported carbon emissions – 2.4Mt(6) (2018: 4.5Mt(6))

Engineer working at Rye House Power Station in Hertfordshire
Progress with strategic initiatives – building a long-term future for sustainable biomass
- Clear plan to reduce US costs and expand capacity – $35/t (£13/MWh(7)) saving on 1.85Mt by 2022
- Targeting five million tonnes of self-supply at £50/MWh(7) by 2027 from expanded sources of sustainable biomass
- BECCS(8) – development of technology options – proven and emerging technology options for at-scale carbon negative generation at Drax Power Station
- End of coal operations will support further reduction in CO2 emissions and lower cost operating model for biomass
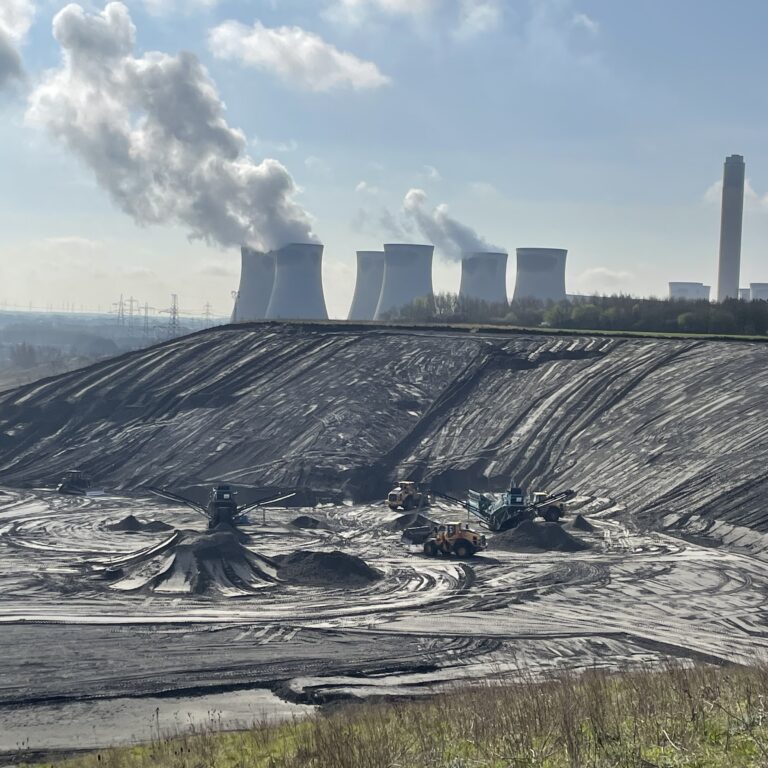
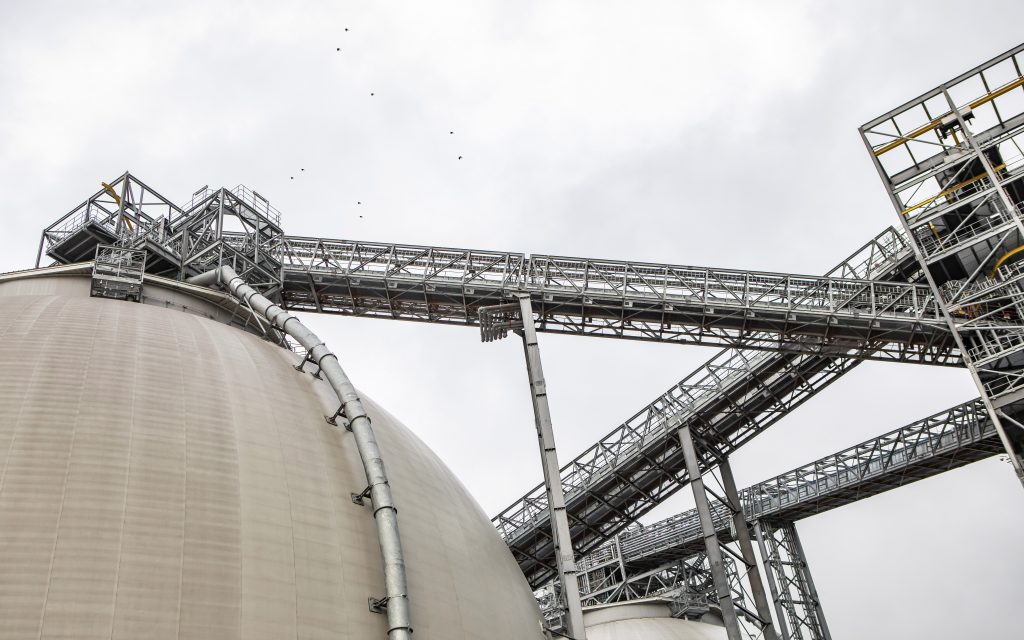
Innovation engineer inspecting CCUS incubation area BECCS pilot plant at Drax Power Station, 2019
Outlook – 2020
- Strong contracted forward power sales of 15.8TWh at £53.9/MWh and high proportion of non-commodity revenues
- Evaluating attractive investment options for growth: biomass cost reduction and capacity expansion
Will Gardiner, CEO of Drax Group said:
“Drax has delivered a strong set of full-year results following the successful integration of new hydro and gas generation assets and made good progress with its strategic initiatives to build a long-term future for sustainable biomass and be the leading provider of power system stability. Drax achieved these results while still delivering a 47 percent reduction in its carbon emissions compared with the previous year.”

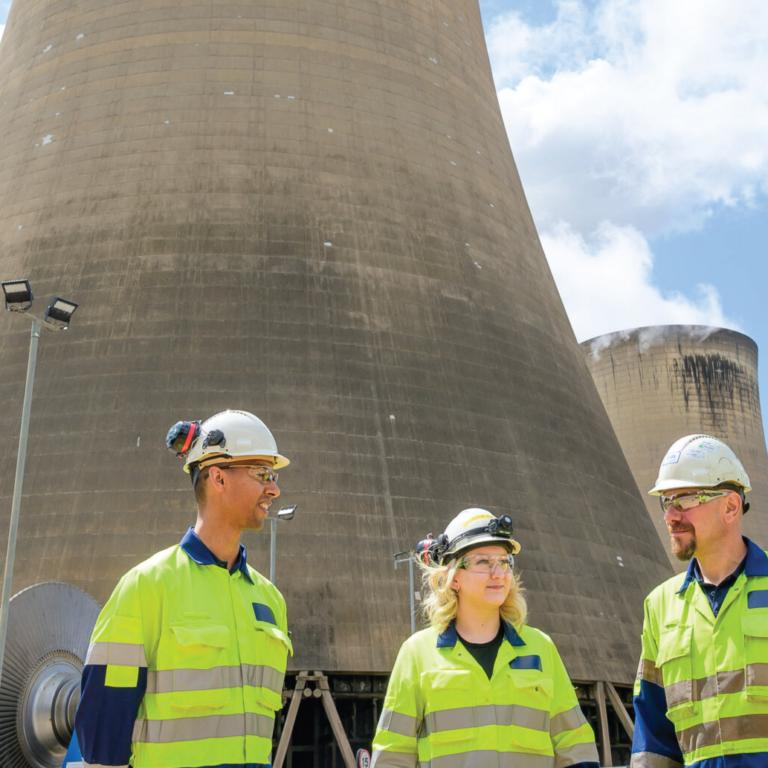
Drax Group CEO Will Gardiner in the control room at Drax Power Station.
“And today, Drax has also taken a significant step towards its ambition to be carbon negative by 2030 and help the UK achieve its net zero target by ending coal generation ahead of the Government’s target.
“This moves Drax and the UK closer to meeting their climate targets, while continuing to provide the flexible and reliable renewable power that millions of British homes and businesses rely on.
“Drax remains fully committed to the regions where it operates and with the right regulatory and investment framework is well positioned to deliver its plans for Yorkshire and the Humber. Using bioenergy with carbon capture and storage at Drax would anchor a new zero carbon cluster that could help protect thousands of jobs and create new opportunities for clean growth in the north and throughout the UK.”
Operational review
Woodchips and sawmill residue at Drax LaSalle Bioenergy in Louisiana, September 2019
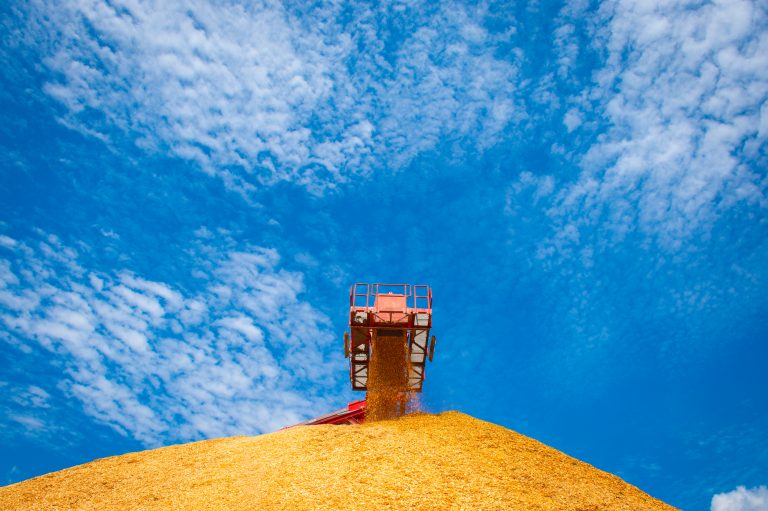
Pellet Production – focus on capacity expansion with good quality pellets at lowest cost
- Adjusted EBITDA up 52 percent to £32 million (2018: £21 million)
- Pellet production up four percent to 1.41Mt (2018: 1.35Mt)
- Cost of production down three percent to $161/tonne(4) (2018: $166/tonne(4))
- Weather-affected forestry activities in H1 leading to reduced low-cost input fibre, offset by cost reduction initiatives and stronger output in H2
- Delivering a programme of cost reduction initiatives – targeting $35/t (£13/MWh(7)) on 1.85Mt by 2022
- Projects delivered in 2019 with further benefits in 2020
- LaSalle Bioenergy – improved rail infrastructure, woodyard decommissioning and sawmill co-location
- Ongoing saving from 2018 relocation of HQ from Atlanta to Monroe
- Savings from projects to be delivered in 2020-2022
- 0.35Mt capacity expansion (LaSalle, Morehouse and Amite), sawmill co-locations and woodyard decommissioning (Morehouse and Amite), increased use of dry shavings, improved logistics and other operational enhancements
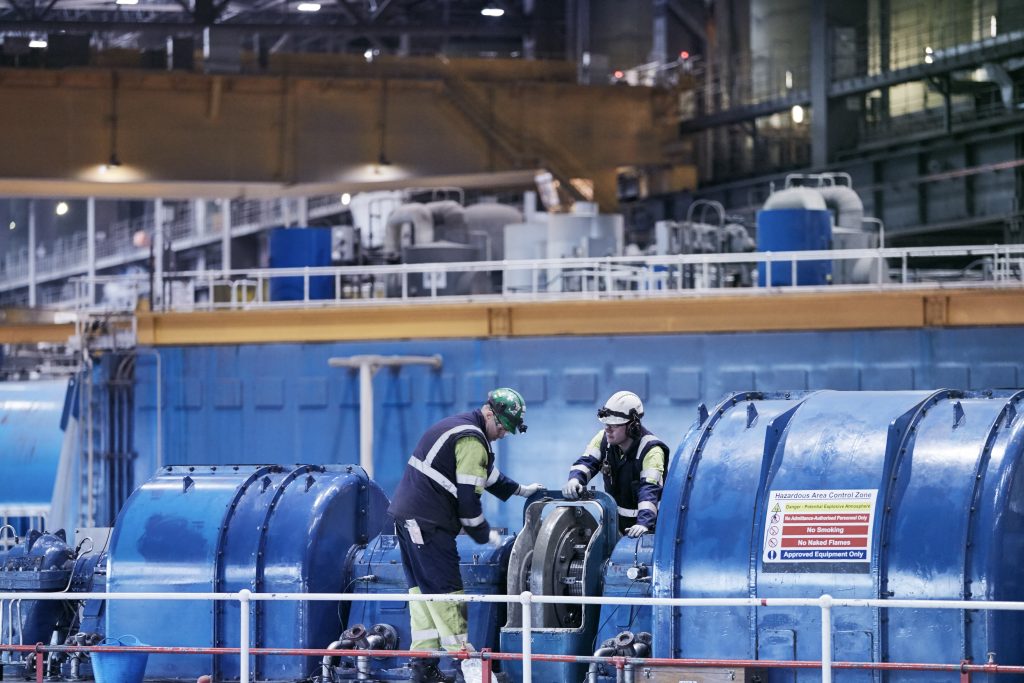
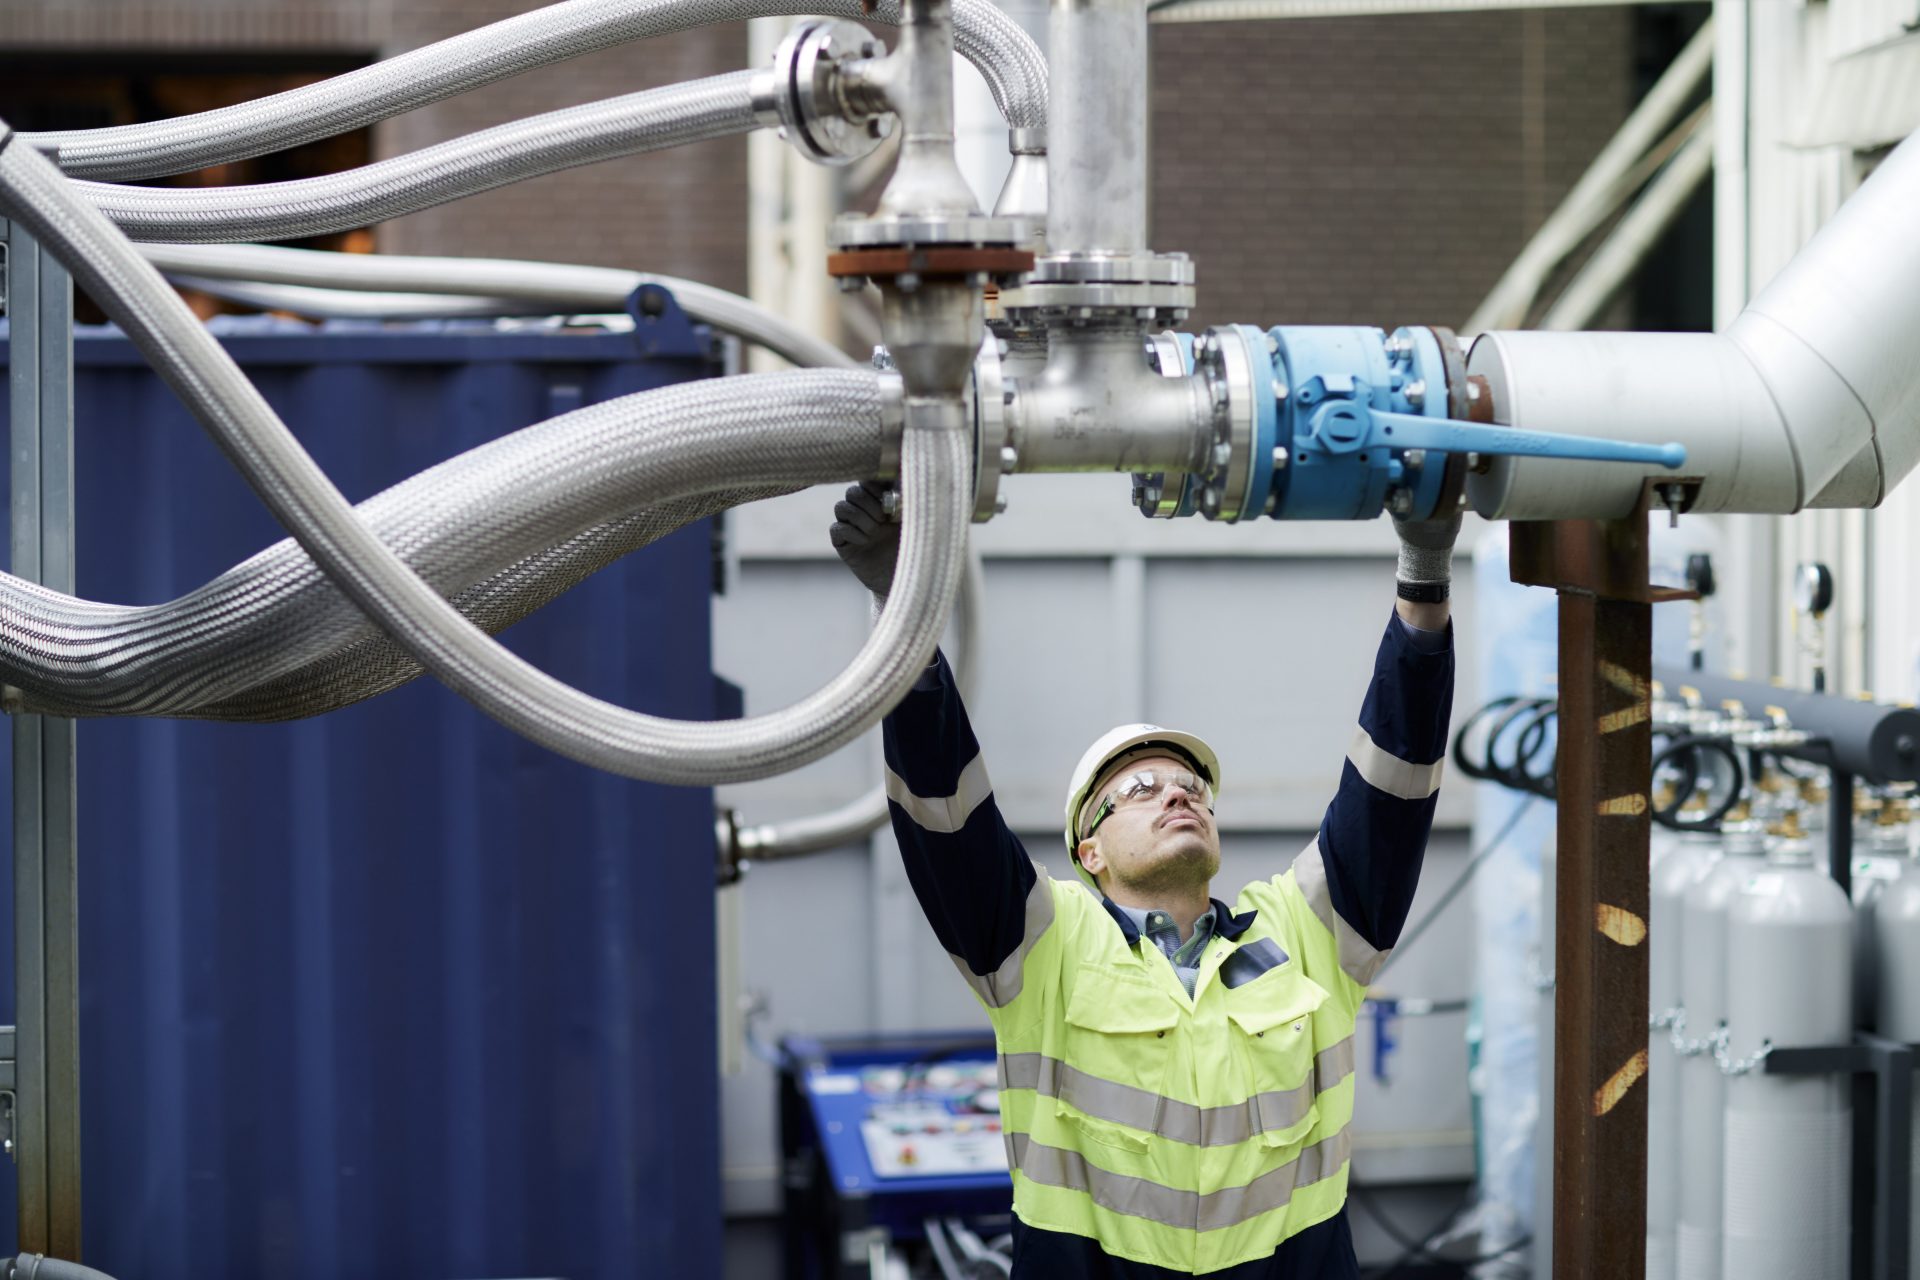
Engineers inspect generator in Drax Power Station turbine hall, 2019
Power Generation – flexible, low-carbon and renewable generation
- Adjusted EBITDA up 76 percent to £408 million (2018: £232 million)
- £114 million of Adjusted EBITDA from acquired hydro and gas generation assets (guidance of £90-110 million)
- Strong system support performance – 63 percent increase in value from flexibility(5) to £129 million (2018: £79 million)
- Good commercial availability across the portfolio – 88 percent (2018: 87 percent)
- £78 million of Capacity Market agreements (2018: £6 million) following re-establishment of the market
- Biomass output (net sales) down three percent to 13.4TWh (2018: 13.8TWh)
- H1 – ROC(9) generation reprofiled to reflect weather-affected US biomass supplies
- H2 – record biomass output in November and December 2019 reflecting excellent operational availability
- Coal – Four percent of portfolio generation but with incremental value from buy back of forward power sales
- Gas – Damhead Creek restricted hours ahead of inspection and Shoreham interim inspection brought forward

Opus Energy employees holding meeting in Northampton, 2019
Customers – growth in margin per MWh and customer meters
- Adjusted EBITDA of £17 million (2018: £28 million)
- 2019 includes £8 million of restructuring costs (£6 million exceptional item in 2018)
- Growth in gross profit per MWh – focus on customer value over volume (MWh) – £6.7/MWh vs. 6.6/MWh
- Six percent growth in customer meters to 419,000 (2018: 396,000)
- Improvement in bad debt charge – £18 million (2018: £31 million)
- Investment in restructuring to drive future earnings growth
Other financial information
- Tax rate benefits from Patent Box claims – corporation tax of 10% on profits arising from investment in innovation
- Capital investment of £172 million
- Includes 0.35Mt of new low-cost US pellet capacity (£10 million in 2019 and £40 million in 2020)
- Net debt of £841 million, including cash and cash equivalents of £404 million (31 December 2018: £289 million)
- 1.9x net debt to Adjusted EBITDA adjusted to reflect receipt of Capacity Market payments in January 2020
View complete full year report
View analyst presentation
Watch webcast