
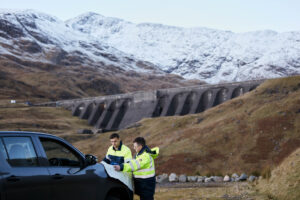

Drax commissions independent Catchment Area Analyses (CAAs) in the regions from which we source.
These studies evaluate the carbon stocks in those forests and how forestry and other human or natural interventions have impacted or may impact those carbon stocks. We are committed to reviewing the methodology of these studies as the science develops.
Our CAAs are published elow and include details of the independent body completing the work, the methodology used, and their findings. Where findings are inconclusive or indicate a negative impact, we aim to investigate further. Completion of our CAAs is part of a rolling programme, and to date we have covered 52.2% of our sourcing, based on Group sourcing in 2024.
Set out in our Responsible Sourcing policy, our commitments help to ensure that we are delivering a positive impact for the climate, environment and for the communities in each area we source our pellets from (i.e. catchment area).
The factors examined include:
- Deforestation and degradation
- Changes in forest management practice
- Wood prices and other markets that use wood
- Amount of carbon stored on landscape (growing stock)
- Sequestration rate of carbon (productivity of forests)
- Harvesting levels vs productive capacity of area
Further information about the metrics can be found here.
Method
We have chosen independent, professional third parties, with expert knowledge of the geographies of each catchment area, to collate information and give their views on the dynamics in each region.
The data used is all publicly available, and every effort has been made to ensure transparency and accuracy.
Reports and summaries
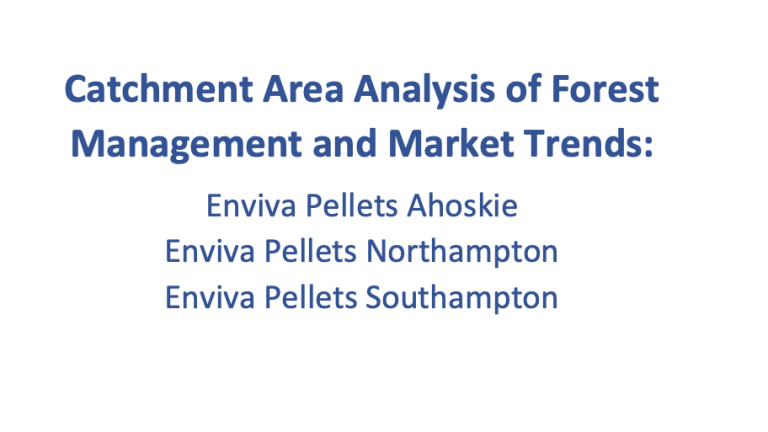
Catchment Area Analysis of Forest Management and Market Trends: Leola, Russellville and Highland Pellets [May 2024]
Catchment Area Analysis: Drax’s Williams Lake and Meadowbank Pellet Facilities [November 2023]
Catchment Area Analysis of Forest Management and Market Trends: Alabama Cluster [February 2022]
Catchment Area Analysis of Forest Management and Market Trends: Amite BioEnergy [August 2019]
Catchment Area Analysis of Forest Management and Market Trends: Burns Lake and Houston [November 2020]
Catchment Area Analysis of Forest Management and Market Trends: Chesapeake [April 2020]
Catchment Area Analysis of Forest Management and Market Trends: Enviva Cottondale pellet plant [August 2021]
Catchment Area Analysis of Forest Management and Market Trends: Estonia [February 2020]
Catchment Area Analysis of Forest Management and Market Trends: Georgia Mill Cluster [September 2020]
Catchment Area Analysis of Forest Management and Market Trends: LaSalle BioEnergy [June 2020]
Catchment Area Analysis of Forest Management and Market Trends: Latvia [May 2020]
Catchment Area Analysis of Forest Management and Market Trends: Morehouse BioEnergy [August 2019]
Areas we source from
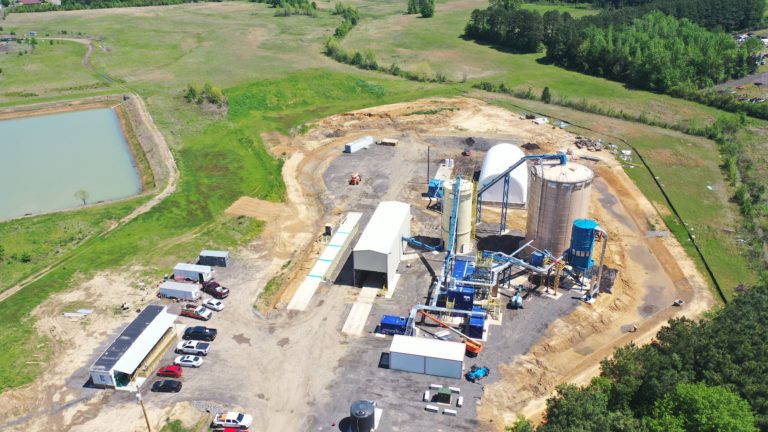
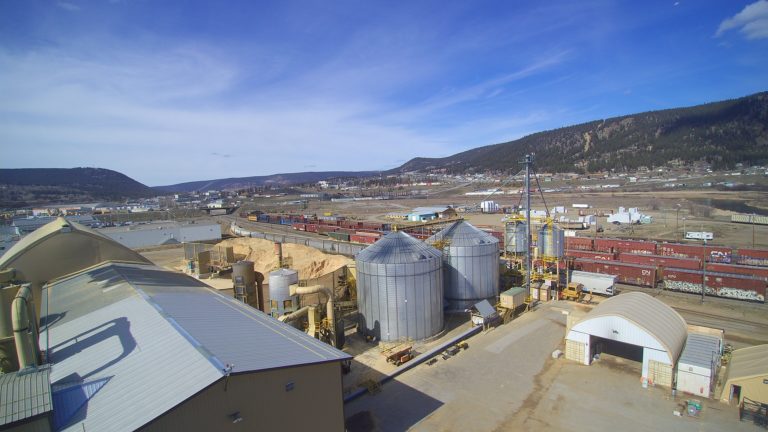
Canada operations
In Canada, where Drax operates 10 pellet mills, around 94% of the forests are publicly owned. The Government of British Columbia, in partnership with First Nations, has procedures, policies, and laws in place to help ensure sustainable forest management practices, protect important forest ecosystems and support the forest products sector.
Without a market for the low-grade woody fibre from forests, this material may be burnt on site at sawmills or may be left as slash (piles of timber damaged or otherwise unsuitable for lumber mills and other woody debris). Removal of debris is a tactic used as part of a wider set of activities to mitigate wildfire risk and the spreading of disease and pests in Canadian forests. But it is not a good climate or economical outcome to burn forest residue in forests or at the roadside. We believe that it is far better to utilise this fibre according to strict criteria and best practice, to generate social value and renewable electricity.
81% of our fibre from Canada comes from sawdust and other sawmill residues created when sawmills produce wood products used in construction and other industries. The remaining 19% of our fibre comes from forest residues, including low-grade roundwood, tops, branches and bark. Typically, pellets produced by Drax in Canada are sold to third-party customers in Asia to fulfil long-term sales contracts.
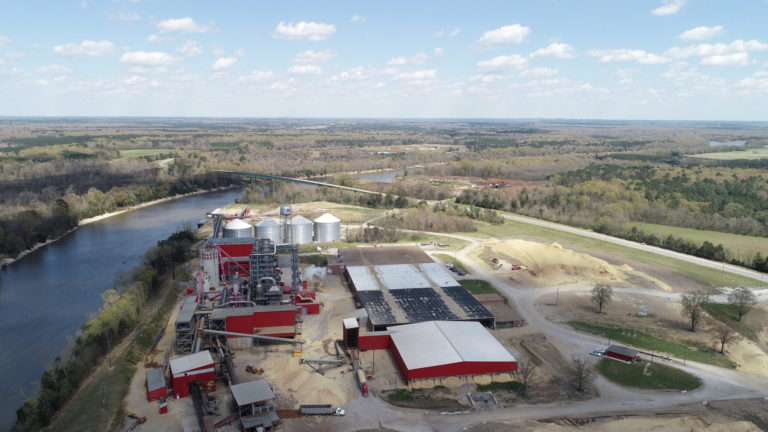
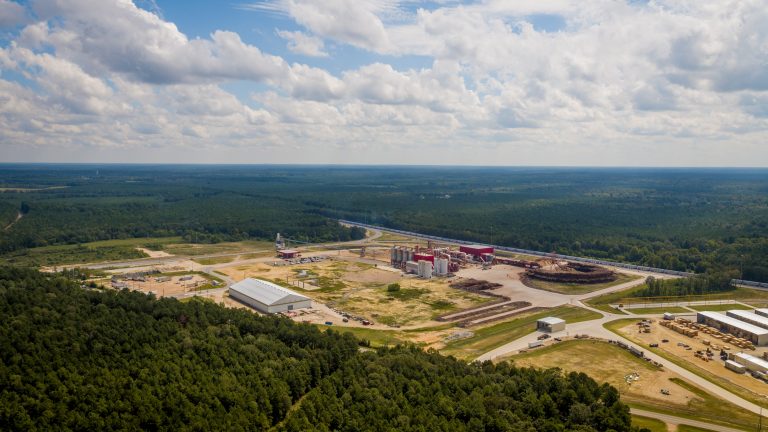
US operations
In the US South, where Drax operates seven pellet plants, over 85% of the forest is privately owned, with the majority in family ownership and a smaller percentage owned by large forestry organisations. Our business model supports the broader forest products sector and provides a valuable market for forest residues including low-grade roundwood and thinnings – material which is not suitable for sawtimber. The established sustainable forest management practice of thinning is widely used in the US South and serves to maintain forest health, increase sawtimber production, and improve the productivity of the forest ecosystem.
In 2024, 56.3% of biomass Drax sourced in the US South was from thinnings and low-grade roundwood, whilst 39.3% was sourced from sawmill residues. In addition to our Biomass Sourcing Policy, processes, and procedures, Drax utilises independent third-party certification schemes, which in the US South includes SFI and FSC® across all its US pellet plants. This is in addition to SBP where all Drax operated pellet plants had a valid SBP Certificate and, in 2024, over 88.5% of the material supplied came with a SBP Compliant Claim.
Third-party pellet sourcing
Third-party pellet sourcing In addition to our own operations, we source third-party pellets from across North and South America, as well as Europe, to be used at Drax Power Station. Additionally Drax trades pellets from Asia, North America, and Europe to fulfil long-term sales commitments to third-party customers. Sourcing of these pellets is subject to due diligence and Drax has processes and procedures in place to establish that the material is sustainably produced and compliant with our biomass sourcing policy and relevant legislation.
In 2024, the volume of pellets traded was 703,992 tonnes. 84% of the traded volume held an SBP Compliant claim. The remainder was either PEFC/SBP controlled or without the claim. The volume without a claim was sourced from a supplier that is SBP certified and FSC® certified. Through a combination of on the ground supplier visits, independent external audit, and assessment of sustainability risks, we work to ensure our suppliers’ meet their markets’ requirements.
Definitions
Deforestation and degradation
Loss of forest cover through conversion to other land use e.g. conversion to agriculture or urban development. Degradation of the forest type and quality e.g. loss of areas of ‘high value’ forest and replacement with lower quality stands (value can relate to economic, carbon, social or ecological value). (A stand of forest is a community of trees sufficiently uniform to distinguish it from adjacent communities.)
Changes in management practice
A widespread change in management practice that can be detrimental to forest value e.g. change in rotation length or species composition that reduces carbon stored in long term wood products, reduces growth rates or the sequestration (capture and storage) rate of carbon; change in thinning practice that reduces revenue or saw-timber production; a widespread reduction in the quality of replanting/restocking that negatively impacts saw-timber production or growth.
Wood prices
The price paid for each wood fibre product to the forest owner (stumpage) and by the mill (delivered); typically categorised into low grade roundwood (pulpwood) and saw-timber grades.
Amount of carbon stored on landscape (growing stock)
The volume or tonnage of total above ground wood fibre in the standing forest area, the quantity of wood fibre in live trees that are actively growing.
Sequestration rate of carbon (productivity of forests)
The rate at which the trees are growing and adding new wood fibre, sequestering more carbon, expressed as the total annual quantity or as the rate per hectare.
Harvesting levels vs productive capacity of area
The total annual growth of wood in forests compared to the total annual removals from harvesting, natural mortality and loss to fire and natural disturbance. This can give a measure of whether the growing stock is increasing or decreasing.