


The US South’s biomass sourcing areas analysed
We believe investing in our people goes hand-in-hand with enabling the green energy transformation and positive future growth.
Information about our business, partnerships and campaigns, as well as photos, graphics and multimedia assets for journalists, and educational materials for schools.
Information about our business, partnerships and campaigns, as well as photos, graphics and multimedia assets for journalists, and educational materials for schools.
We’re committed to enabling a zero carbon, lower cost energy future through engineering, technology and innovation.
We’re building for a sustainable future in how we source our biomass, generate energy, remove carbon dioxide and function as a business.
Read our carbon capture, sustainable bioenergy and power generation stories, as well as thinking from Drax’s leaders and business updates.
Drax Group’s ambition is to become a carbon negative business by 2030, through innovative greenhouse gas removal technology.

Drax is pleased to announce that it has completed the refinancing of its revolving credit facility.
The new £300 million facility (“the Facility”) matures in 2025, with an option to extend by one year(1). The Facility replaces the current RCF which matures in 2021 and provides increased liquidity, enabling the full facility to be drawn as cash (the previous facility restricted cash drawn to support liquidity to £165 million). The Facility is currently undrawn for cash.
The Facility has a customary margin grid referenced over LIBOR, which reflects a small reduction in cost versus the current RCF and includes an embedded ESG component which adjusts the margin based on Drax’s carbon intensity measured against an annual benchmark.
Drax has also agreed a change to the Group’s £35 million term-loan facility, maturing in 2022, in order to simplify its capital structure. This facility will now rank as senior, previously super senior.
On 14 September 2020, Drax confirmed that it had agreed a new infrastructure term-loan agreement (the “Agreement”) that provided committed facilities of approximately £160 million with a range of maturities between 2024 and 2030(2). These facilities extended the Group’s maturity profile while also reducing the cost of debt. Drax has now drawn £28 million(2), with the balance to be drawn by February 2021.
The Agreement also included an option for a further £75 million. Under this option Drax has now agreed £53 million maturing in 2028, which will be drawn in December 2020.
On 4 November 2020, Drax issued €250 million of Euro denominated senior secured notes which mature in 2025. The effective Sterling-equivalent interest rate is 3.24% per annum.
The proceeds from this issuance, along with existing cash flows, are being used to redeem the Group’s £350 million 2022 Sterling bond and £125 million ESG term-loan facility.
The notes extend the Group’s debt maturity profile and reduce the overall cost of debt to approximately 3.7%.
| Instrument | Maturity | Description |
|---|---|---|
| Infrastructure facilities (2019) | 2024-2029 | £375m |
| Infrastructure facilities (Sept 2020) | 2024-2030 | approx.£160m (2) (£28m (2) drawn) |
| Infrastructure facilities (Nov 2020) | 2028 | £53m |
| Bonds | 2025 | $500m |
| Bonds | 2025 | €250m |
| RCF | 2025 | £300m (undrawn for cash) |
| Index-linked term-loan | 2022 | £35m |
Drax Investor Relations: Mark Strafford
Drax External Communications: Selina Williams
Website: www.drax.com/uk
END
Batteries can be found everywhere: in our houses, in our cars and vans and even in the tech we wear. More than just being pervasive, battery technology has enabled a huge amount of technological breakthroughs – from the increasing distances electric vehicles can travel between charges, to being able to store renewable electricity for when it’s needed.
These two developments in particular – emission-free electric transport and grid-scale batteries that can power homes, businesses and cities even when energy sources are not generating – could be two key aspects in the transition to a zero carbon energy future. However, questions remain around batteries’ environmental impact.
The batteries we use every day are typically made from a mix of metals and chemicals such as lead and acid (as found in petrol and diesel-engine cars), or zinc, carbon, nickel and cadmium, which make up some of the batteries found in the home.
Then there’s lithium-ion. The go-to material mix for the rechargeable batteries powering mobile phones, laptops and, more recently, a high proportion of electric vehicles around the world.
The surge in the production of lithium-ion batteries over the last decade has led to an 85% price reduction, which in turn, has encouraged the use of these reliable batteries in electric vehicles and large-scale energy storage solutions. While this is a positive step in the development of rechargeable goods, it raises issues in the handling of spent batteries.
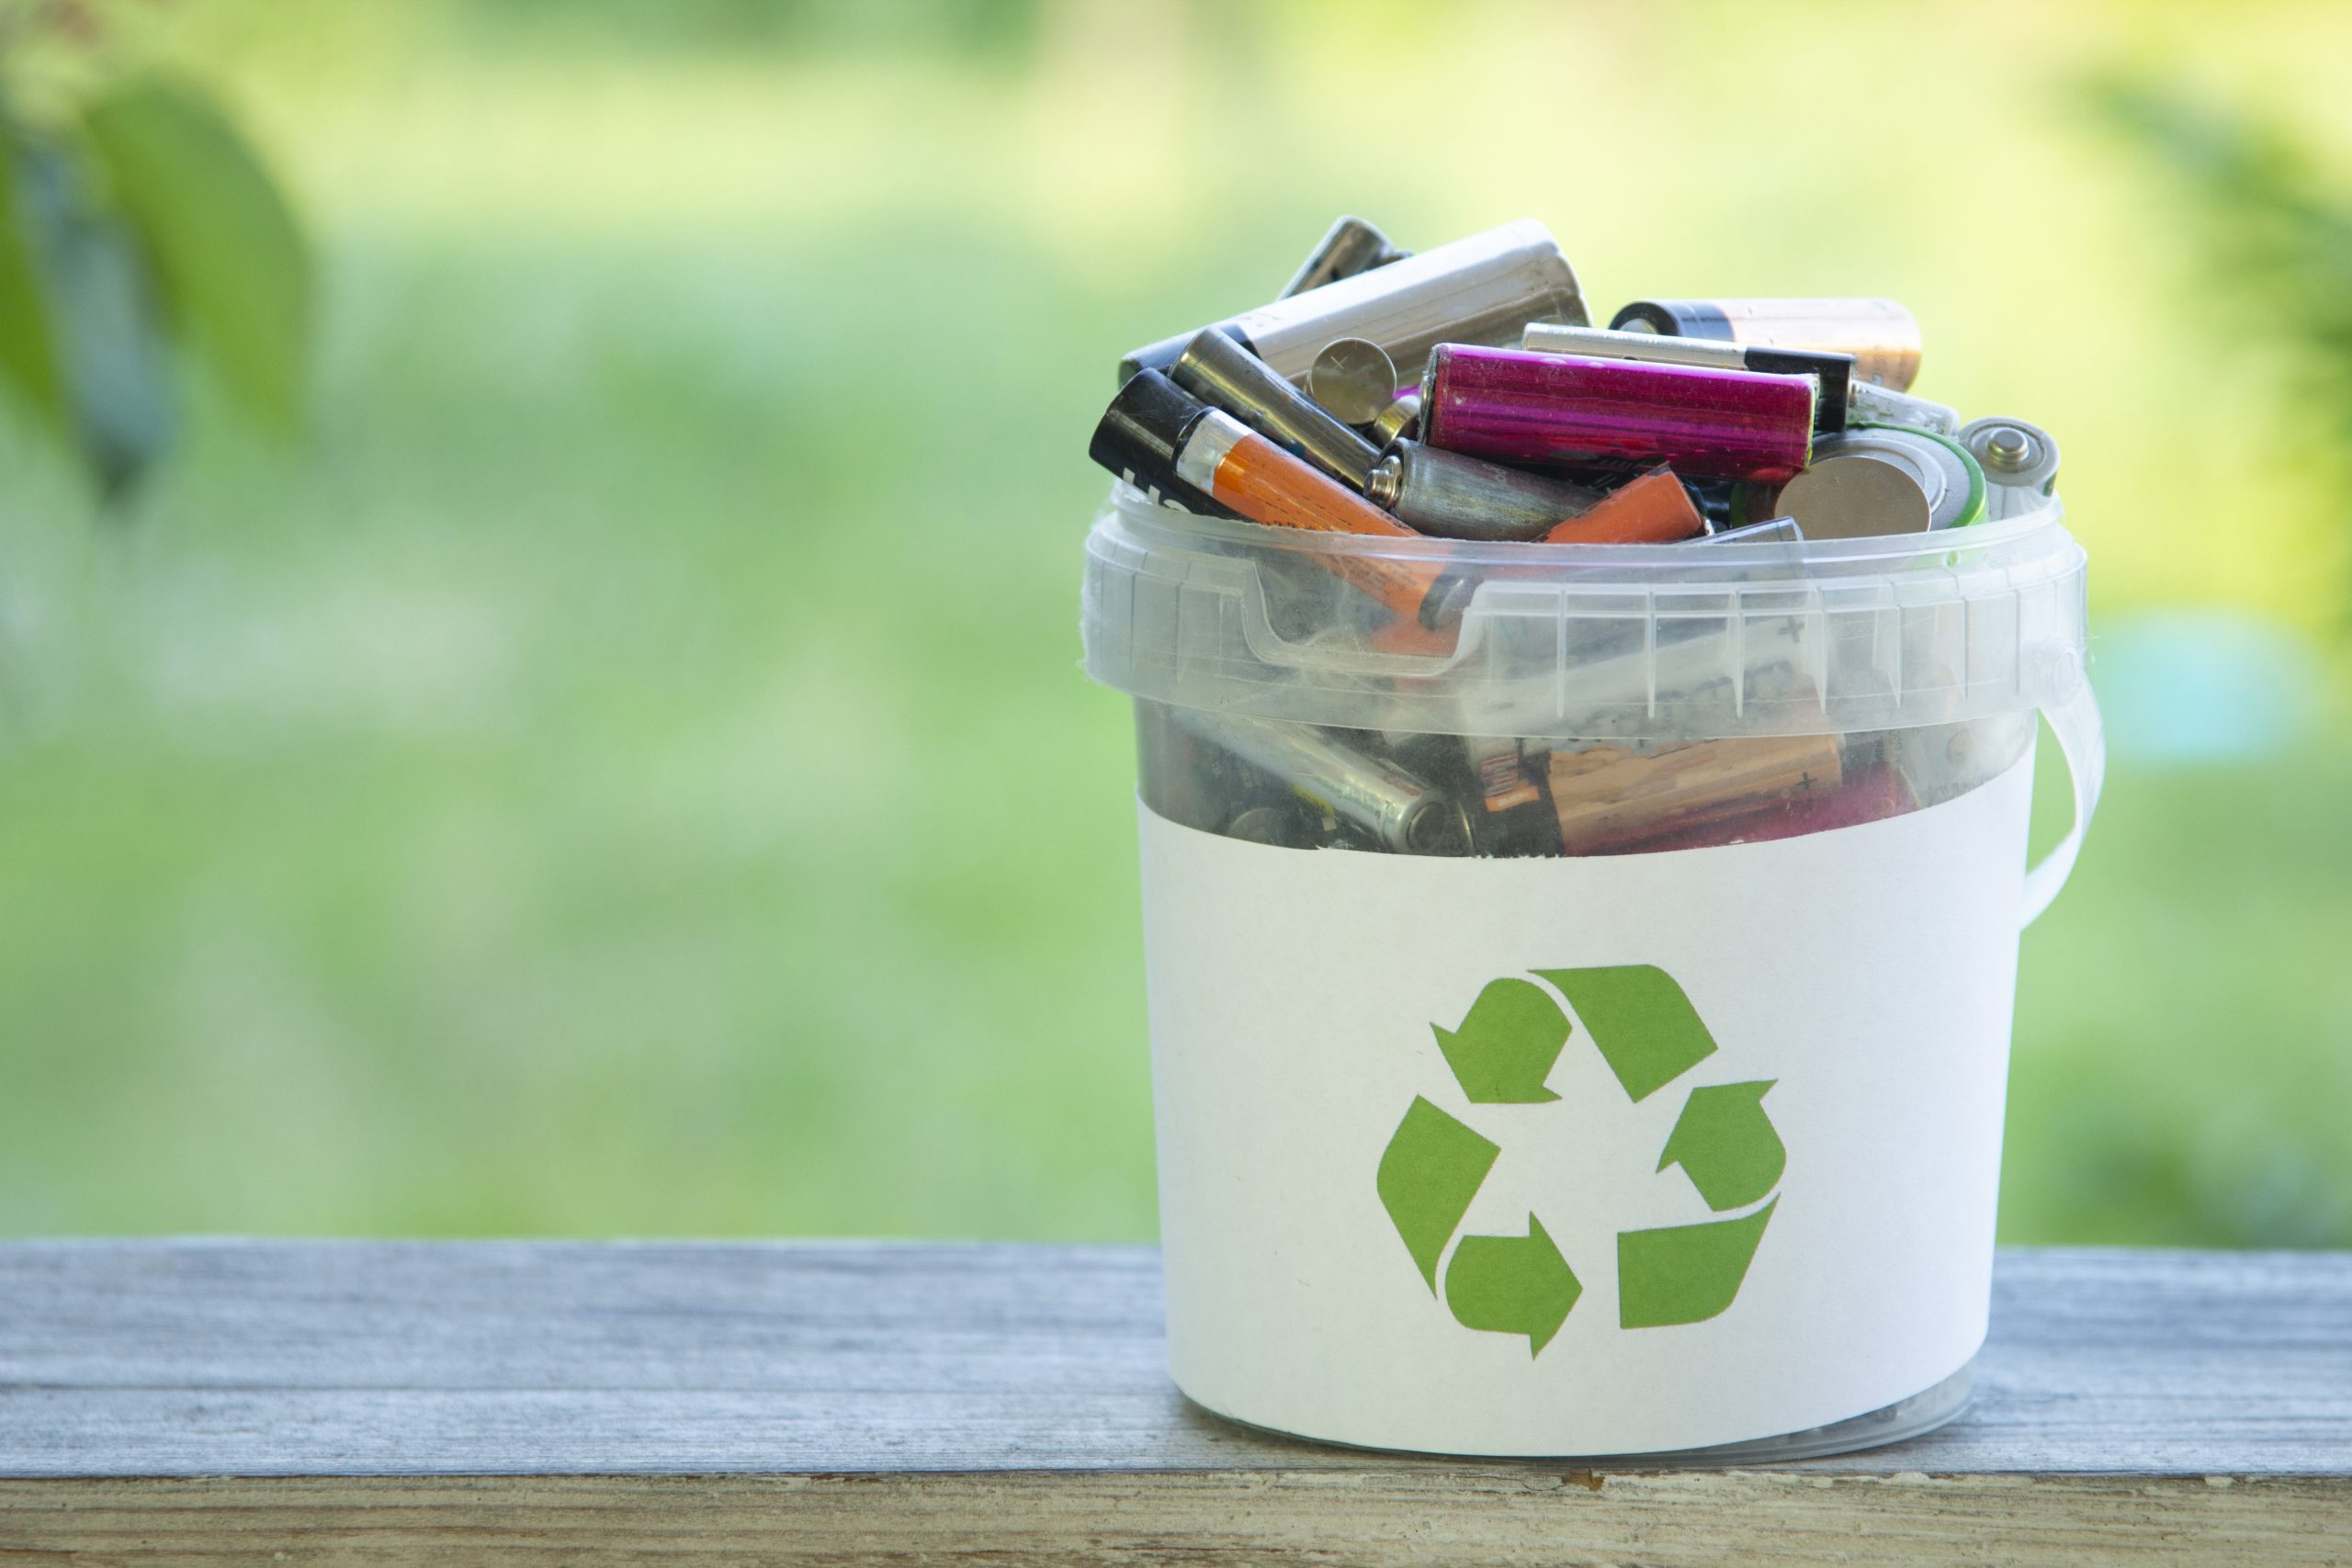
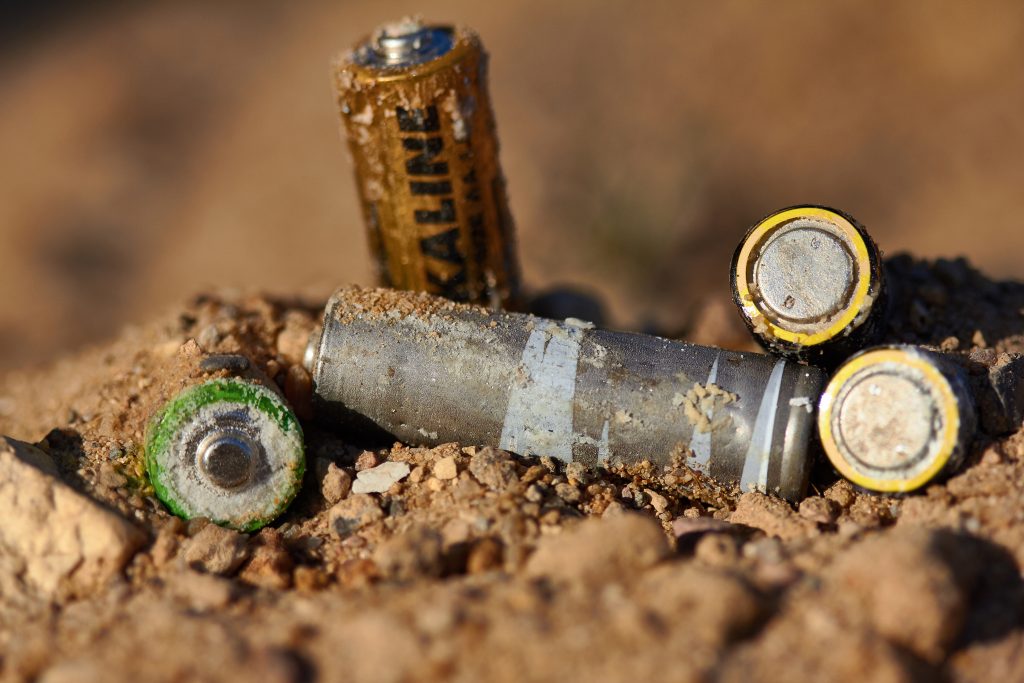
Each year around 600 million batteries are thrown away in the UK alone – even rechargeable batteries have a shelf-life. While recycling allows the safe extraction of raw materials for use in other industries and products, the majority of discarded batteries are left to rot in landfill sites. This can lead to their chemical contents leaking into the ground causing soil and water pollution.
For batteries of any size to play a role in a sustainable future, an overhaul is needed in preventing harmful levels of battery waste.
Although the number of batteries that are recycled has increased, currently the EU puts the recycling efficiency target for a lithium battery at only 50% of the total weight of the battery.

Connecting positive and negative terminals on a rechargeable lithium mobile battery
Standard recycling methods achieve this by separating and processing the plastics and wiring that make up the bulk of the battery pack, then smelting and extracting the copper, cobalt and nickel found within the cell, releasing carbon dioxide in the process. Crucially, these recycling practices do not typically recover the aluminium, lithium or any of the organic compounds within the battery, meaning that only around 32% of the battery’s materials can be reused. A lack of recycling facilities in the UK means spent batteries have traditionally been exported overseas for treatment, upping emissions even further.
It is not only spent batteries that cause a problem, the creation of them can be harmful too. For example, lithium mining can pose health hazards to miners and damage local communities and their environments.
In one area of Chile, 65% of available water is used in the production of lithium for batteries, meaning water for other uses, such as maintaining crops, must be driven in from somewhere else, impacting farmers greatly. There are also risks around contaminated water leaking into livestock and human water supplies, as well as causing soil damage and air pollution.
As a result, teams across the globe are working to make the production and recycling of batteries more efficient and eco-friendly.
Researchers based at Chalmers University of Technology in Sweden and the National Institute of Energy in Slovenia, are developing an aluminium-ion battery. This type of battery offers a promising alternative to lithium-ion due to the abundance of aluminium in the Earth’s crust and its ability, in principle, to carry charges better than lithium.

Disassembling the battery from an electric vehicle (EV)
The reduction in material and environmental costs that come with using aluminium over lithium might mean batteries made with it could offer more affordable, large-scale storage for renewable installations.
While more research is still needed to reduce the size and control the temperature of aluminium batteries, researchers believe they will soon enter commercial production and eventually could replace their lithium-ion predecessors.
Elsewhere, IBM Research’s Battery Lab is developing a sustainable battery solution made predominantly of materials extracted from seawater, a composition that would avoid the concerns associated with the production of lithium-ion cells.
While the exact combination of materials in not public, Battery Lab claims the new concept has outperformed its lithium-ion counterpart in energy density, efficiency, production costs and charging time.
Along with advancements in battery development, new recycling methods are also reducing the environmental impact of batteries.
German company, Duesenfeld, is innovating the recycling of lithium-ion batteries used in electric vehicles through an innovative new process.
Batteries are first discharged and disassembled into their constituent parts. The metals are extracted with a water-based solution, the liquid chemicals evaporated and condensed, and the dry materials crushed and separated, ready for reuse. Importantly, Duesenfeld’s method avoids incineration, reducing the carbon footprint of lithium-ion battery recycling by 40% and enabling over 90% of the batteries’ materials to be salvaged and reused in new batteries.
Fortum, a Finnish energy company, is exploring a similar process, with the potential to recycle more than 80% of battery materials, including cobalt, manganese and nickel.
This year Fortum signed a deal with German chemical company BASF and Russian mining and smelting firm Nornickel to develop a renewable-powered, electric vehicle battery recycling cluster in Finland. The aim is to create a ‘closed-loop’ battery production and recycling system, meaning materials from recycled batteries would be used to make new batteries.
While it is clear there is a long way to go in reducing the environmental impact of battery production and recycling, continued development of both batteries and technology can pave a path for a cleaner, safer, battery-powered, zero carbon future.

Electric vehicle battery pack
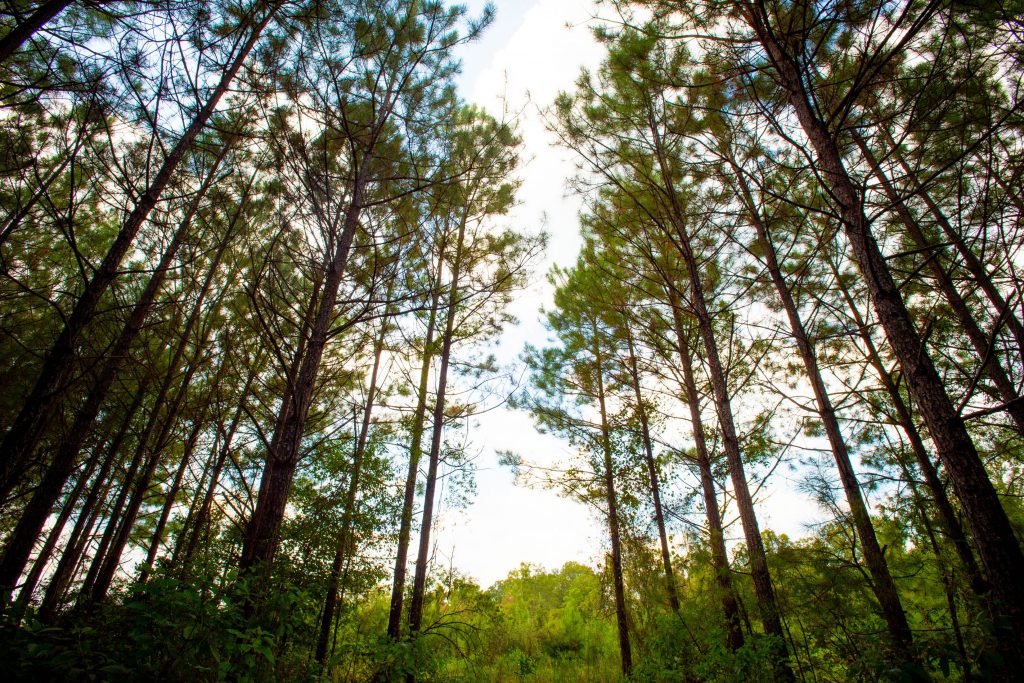
The seventh report in a series of catchment area analyses for Drax looks at the fibre sourcing area surrounding a number of compressed wood pellet plants operated by Georgia Biomass (now owned by Enviva) and Fram Renewable Fuels.
The evidence found in the report by Hood Consulting shows a substantial increase in forest inventory (stored carbon) and a relatively stable forest area. However, with continued pressure from urban development, future losses of timberland area are possible. Despite this, increasing growth rates can maintain and improve wood supply and carbon stock for the foreseeable future.
The overall inventory of growing stock in the catchment area has increased by 63 million cubic metres (m3) between 2000 and 2018, a growth of 19.3%. All of this increase has been in the pine area, which increased by nearly 68 million m3, whereas the hardwood species decreased in volume by 4.5 million m3. Overall, the inventory volume split by species in 2018 was 72% to 28% softwood to hardwood. The breakdown by product category is shown in Figure 3 below.
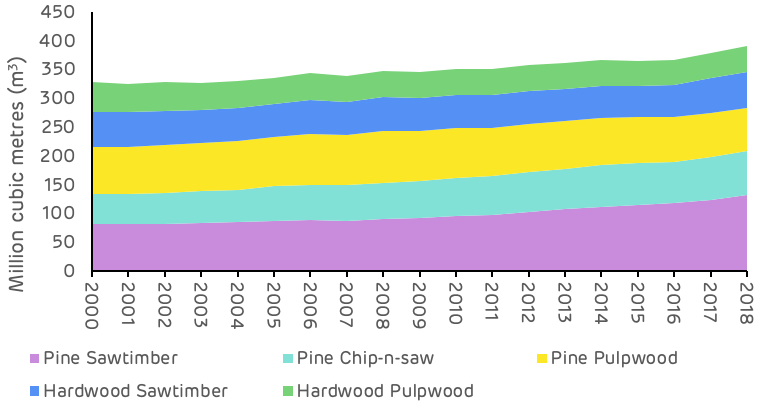
Figure 1: Change in growing stock by major product category and species (USFS)
The pine saw-timber and chip-n-saw product categories, larger dimension and higher value material, showed the largest increase in inventory, whereas pine pulpwood decreased in total volume. The most substantial change occurred from 2010 to 2018, where pulpwood went from an increasing trend to a decreasing trend and saw-timber increased in volume much more rapidly – this is shown in Table 1 and Figure 2 below.
| Change (cubic metres (m3)) | Pine Sawtimber | Pine Chip-n-saw | Pine Pulpwood | Hardwood Sawtimber | Hardwood Pulpwood | Total |
|---|---|---|---|---|---|---|
| 2000-2018 | 51,301,628 | 22,277,139 | -5,835,230 | 1,211,110 | -5,657,114 | 63,297,533 |
| 2000-2010 | 14,722,995 | 12,707,674 | 5,262,192 | -3,740,507 | -5,769899 | 23,182,455 |
| 2010-2018 | 36,578,632 | 9,569,465 | -11,097,422 | 4,951,618 | 112,784 | 40,115078 |
These changes are likely to reflect an increasing age class in the catchment area, with younger stands of pine (previously classed as pulpwood), growing into a larger size class and being reclassified as saw-timber. This means that the volume of saw-timber availability in future will be significantly higher, but pulpwood availability will be diminished. For pellet mill markets any loss in pulpwood availability can be compensated by an increase in sawmill residue production if market demand is maintained or increased.
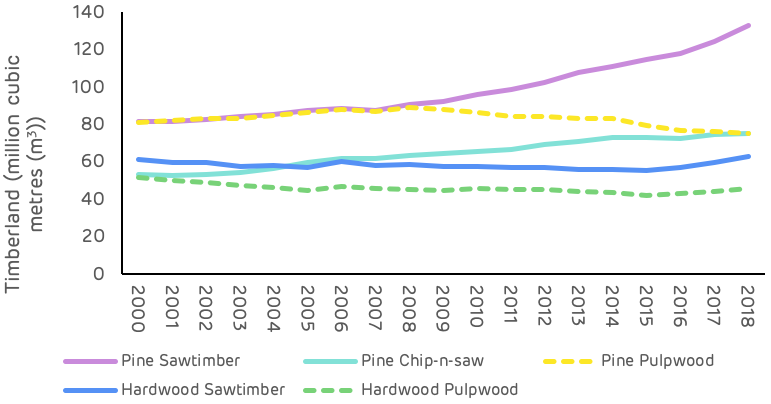
Figure 2: Change in growing stock by major product category and species (USFS)
Growth rates for both softwood and hardwood species have been increasing since 2000 as shown in Figure 3 below. Softwood growth has increased by 18.5% since 2000 and hardwood by 1.4%. The improved softwood growth rate probably resulted from increased investment in the management of pine forests, the superior quality of seedlings and better management practice (ground preparation, weed control, fertilisation etc.). This is a very positive trend for the sequestration rate of carbon and also for providing landowners with the potential to increase revenue per hectare and encourage the retention and improved management of forests, rather than converting to other land uses. The Georgia catchment area is likely split between passive owners that do not actively manage, where growth rates are slower or decline and the incentive to convert land is greater, and owners that actively manage to improve growth and quality, increasing revenue and maintaining productive forest. There is likely to be a much greater differential in growth rate between these two management approaches than reflected by the trend in Figure 3, highlighting the importance of active management for carbon abatement.
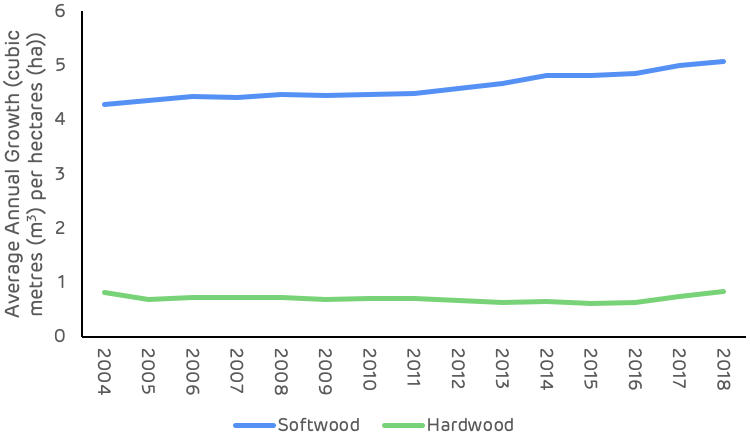
Figure 3: Average annual growth rate per hectare (USFS)
At a macro scale, the distribution of land use categories has remained relatively stable since 2000, with no apparent major shifts in land use. The timberland area around the seven mills has decreased by around 135 thousand hectares (ha) between 2000 and 2018 (2.3% of the total land area), whilst the area of arable and urban land increased by 98 thousand (1.7% of total area) and 158 thousand (2.7% of total area) ha respectively. In 2018, timberland represented 67% of total land area and all forest and woodland 80% of total area, down from 69% and 82% respectively in 2000 (Figure 1).
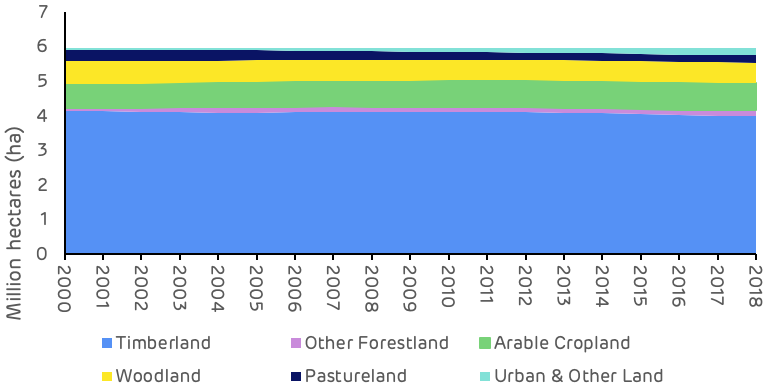
Figure 4: Change in land use category (USDA)
Looking at this change in land use more closely, the timberland area shows the most pronounced decline between 2010 and 2018, a drop of 117 thousand ha. The largest change in other land use categories over this period was an increase of 97 thousand ha in urban and other land, suggesting that a large proportion of the timberland area has been converted to urban areas.
The most significant change in agricultural land occurred prior to 2010, when the timberland area remained relatively stable, this change appears to have involved the transition of pastureland to arable crops. There may also have been some reclassification of forest and woodland types, with a decrease in the area of woodland and an increase in forestland during the period between 2000 and 2010 (Table 2).
| Change (hectares (ha)) | Timberland | Other Forestland | Arable Cropland | Woodland | Pastureland | Urban & Other Land |
|---|---|---|---|---|---|---|
| 2000-2018 | -135,195 | 70,073 | 98,436 | -77,904 | -113,725 | 178,315 |
| 2000-2010 | -18,539 | 53,150 | 73,243 | -73,077 | -95,630 | 60,852 |
| 2010-2018 | -116,656 | 16,922 | 25,193 | -4,827 | -18,096 | 97,463 |
These trends are also clear and apparent in Figure 3 below which shows the sharp decline in timberland area, albeit small in absolute area relative to the total catchment area size, and the steady increase in urban land. Georgia ranks 8th in the list of US States and territories by total population with 10.6 million and 17th by population density at 184 per square mile (mi2) compared to just 63 per mi2 in Mississippi where Drax’s Amite Bioenergy (ABE) pellet plant is located and 108 per mi2 in Louisiana where the Morehouse Bioenergy (MBE) and LaSalle Bioenergy (LBE) mills are located (US Census Bureau). This population pressure and increased development can lead to more forest loss and land use change.
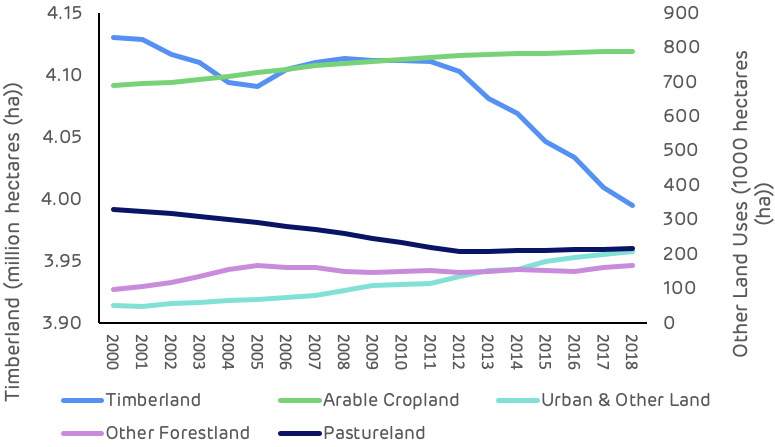
Figure 5: Trends in major land use categories (USDA)
Drax’s suppliers in the Georgia catchment area have made a commitment not to source wood from areas where land use change is taking place. This commitment is monitored and verified through the Sustainable Biomass Program (SBP) certification process that is maintained by each mill. Any land use change in the catchment area is likely to be a result of prevailing economic drivers in the region rather than due to actions being taken by the pellet producers.
Strong markets are essential for ensuring that forests are managed and restocked to optimum benefit, sawlog markets are particularly important as this is highest revenue stream for forest owners. Figure 6 shows the trend in market demand for each major product category since 2000 and demonstrates the recent increase in softwood sawlog demand as the US economy (particularly housing starts) recovered from the global recession at the end of the last decade. Softwood pulpwood demand increased through the 2000s but has remained relatively stable since 2011, with the exception of a peak during 2018 which resulted from an increase in volume generated by salvage operations after hurricane Michael.
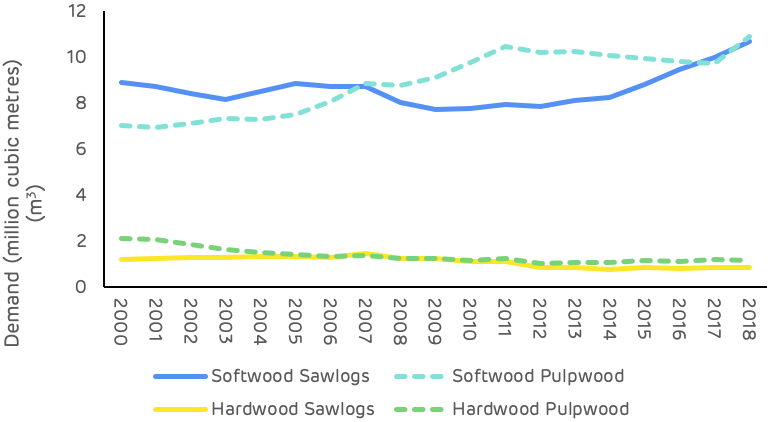
Figure 6: Demand for wood products (USFS, TMS)
The comparison of average annual growth and removals in the Georgia catchment area is much more tightly balance than in Drax’s other supply regions, as shown in Figure 7. Since 2000 the average annual surplus of growth has been around 3.6 million m3 with both demand and growth increasing in recent years.
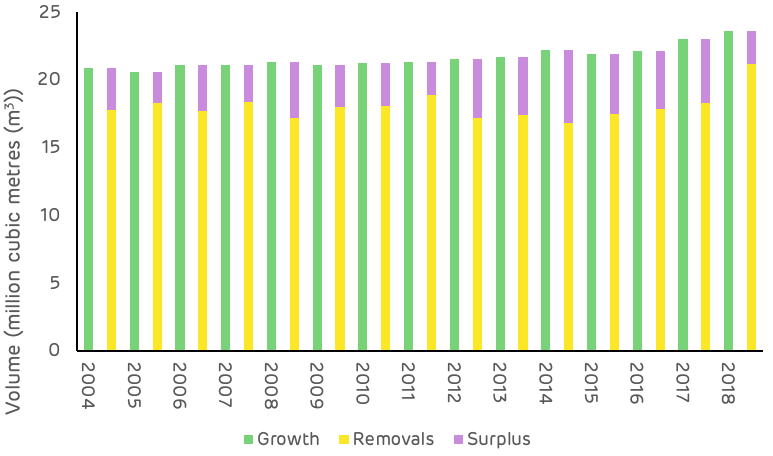
Figure 7: Average annual growth, removals and surplus (USFS)
As shown in Figures 2 & 3, growth rates are strong and inventory is increasing, this is not a problem in the Georgia area. The relatively small surplus, as compared to other catchment areas in the US South, is due to the higher concentration of wood fibre markets and the more intense forest industry activity in this region. As of July 2020, there were over 50 major wood-consuming mills operating within the Georgia catchment area and an additional 80+ mills operating within close proximity, overlapping the catchment area. Total pulpwood demand in 2019 was 12.9 million tons, of which approximately 87% was attributed to non‐bioenergy‐related sources (predominantly pulp/paper) and 13% was attributed to the bioenergy sector. Given the bio-energy sector’s low ranking position in the market (with the lowest ability to pay for fibre), combined with the relatively small scale in demand compared to the pulp and paper industry, the influence of biomass markets can be considered to be minimal in this region, particular when it comes to impacts on wood prices and forest management practice.
Pine sawtimber prices suffered a significant decline between 2000 and 2010, dropping almost $21 per ton as a result of the global financial crisis and the decline in demand due to the collapse in housing markets and construction (Table 3). Since 2010 pine sawtimber has remained relatively stable, with some minor fluctuations shown in Figure 8 below.
| Change ($/ton) | Pine Sawtimber | Pine Chip-n-saw | Pine Pulpwood | Hardwood Sawtimber | Hardwood Pulpwood |
|---|---|---|---|---|---|
| 2000-2019 | -$20.92 | $15.14 | $5.95 | $12.55 | $4.70 |
| 2000-2010 | -$20.92 | -$21.41 | $2.11 | $11.25 | $5.67 |
| 2010-2019 | $0.00 | $6.27 | $3.84 | $1.30 | -$0.97 |
Pine pulpwood prices have been on a generally increasing trend since 2000, with a more significant increase since 2011. This increase does not reflect an increase in demand or total volume, which has remained relatively stable over this period, but a shifting of the geographic distribution of the market with some new mills opening and old mills closing, resulting in increased competition in some localised fibre baskets and leading to an overall increase in stumpage price.
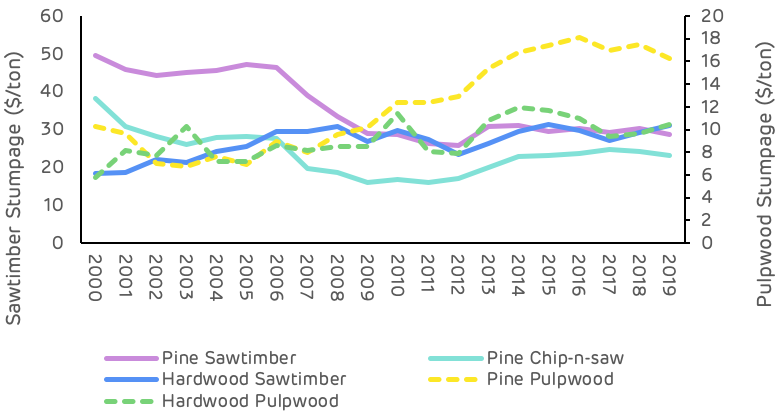
Figure 8: Stumpage price trends (TMS)
Figure 9 below shows that, with the exception of the hurricane salvage volume in 2018, pulpwood removals have declined or remained relatively stable since 2010, whereas pulpwood stumpage prices increased by 41% from 2010 to 2018.
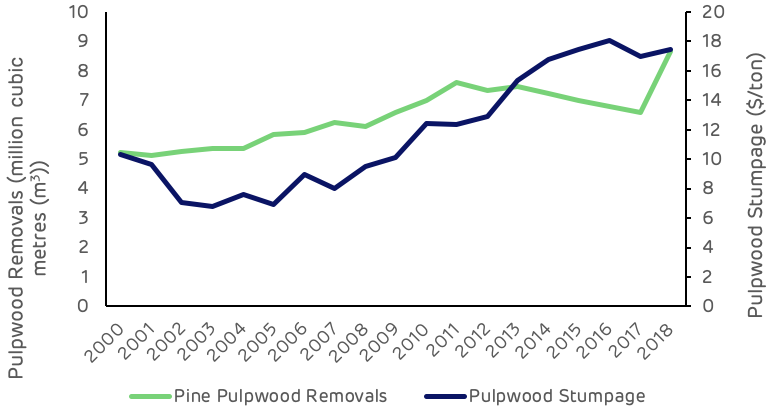
Figure 9: Pulpwood demand and stumpage price (USFS, TMS)
Comparing this stumpage price trend with other catchment areas of the US South (Figure 10), where Drax sources wood pellets, the Georgia area is on average 35% higher than the next highest area (Chesapeake) and 87% higher than the lowest cost area (Amite Bioenergy in Mississippi). This price differential is predominantly due to the scale of demand and availability of surplus low-grade fibre.
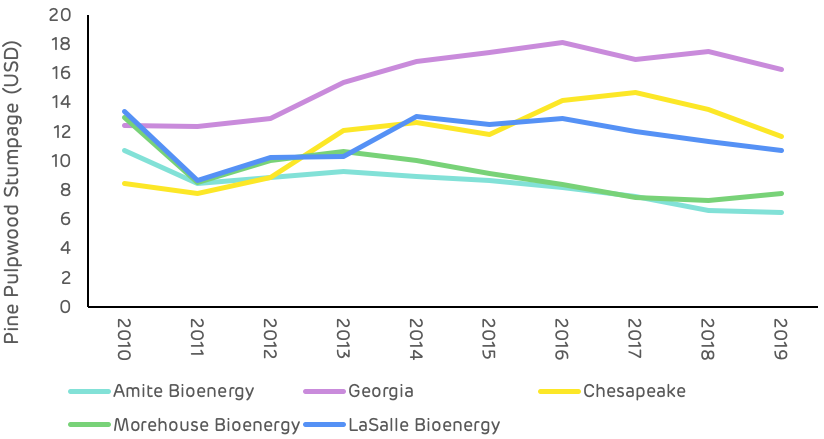
Figure 10: Comparison of pine pulpwood stumpage prices in Drax supply areas US South (TMS)
Deforestation?
No. US Forest Service (USFS) data shows a 108,130-hectare (-2.6%) decrease in total timberland in the Georgia catchment area since Georgia Biomass’ first full year of production in 2012. Specifically, this loss in total area of timberland coincided with a more than 21,000-hectare increase in cropland/pastureland and a more than 73,000-hectare increase in urban land and land classified as having other uses.
However, there is little evidence to suggest that increased wood demand from the bioenergy sector has caused this decrease in total timberland. Furthermore, pine timberland – the primary source of roundwood utilized by the bioenergy industry – has increased more than 17,000 hectares in the catchment area since 2016.
A change in management practices (rotation lengths, thinnings, conversion from hardwood to pine)?
No. Changes in management practices have occurred in the catchment area over the last two decades. However, there is little evidence to suggest that bioenergy demand, which accounts for roughly 10-14% of total pulpwood demand (and only 5-7% of total wood demand in the catchment area), has caused or is responsible for these changes.
Clearcuts and thinnings are the two major types of harvests that occur in this region, both of which are long-standing, widely used methods of harvesting timber. TimberMart-South (TMS) data shows that thinnings accounted for 67% of total reported harvest area in the southeast Georgia market from 2000-2010, but only 43% of total harvest area reported from 2012-2019. Specifically, this downward shift was initiated by the bursting of the US housing bubble in the mid-2000s and had been completed by the early 2010s. We’d like to note that this shift coincided with a nearly 50% decrease in pine sawtimber stumpage price from 2006-2012. This is important because the strength of pine sawtimber markets had been a driving force behind timber management decisions in this region in the early and mid-2000s.
Also, contributing to the decreased prevalence of thinnings was the strengthening of pine pulpwood markets in the mid-2000s, as pine pulpwood stumpage prices increased more than 40% in the Georgia catchment area from 2003-2008. So, with sawtimber markets continuing to weaken and pulpwood markets doing just the opposite, the data suggests that many landowners decided to alter their management approach (to take advantage of strong pulpwood markets) and focus on short pulpwood rotations that typically do not utilize thinnings.
Ultimately, the shift in management approach that occurred in this market can be linked to the weakening of one type of timber market and the strengthening of another. In the early and mid-2000s, timber management was focused on sawtimber production – a type of management that utilizes thinnings. However, for more than a decade now, this market has been driven to a large degree by the pulp/paper industry, with a significant portion of the timber management in this area focused on short pulpwood rotations.
Diversion from other markets?
No. Demand for softwood (pine) sawlogs increased an estimated 39% in the Georgia catchment area from 2011-2019. Also, increased bioenergy demand has caused no diversion from other pulpwood markets (i.e. pulp/paper), as pulpwood demand not attributed to bioenergy held steady and remained nearly unchanged from 2012-2017 before increasing in 2018 and 2019 due to the influx of salvage wood brought about by Hurricane Michael.
We’d like to make special note that increased demand for softwood sawlogs since 2011 has not resulted in a full pine sawtimber (PST) stumpage price recovery in this market. Reduced demand for softwood sawlogs in the late 2000s and early 2010s resulted in oversupply, and this oversupply has remained, despite increased demand the last 6-8 years. As a result, PST stumpage prices have held steady and averaged roughly $30 per ton in the catchment area since 2013 – down approximately 35% from the 2000-2006 average of more than $46 per ton, but up roughly 15% from the 2011-2012 average of approximately $26 per ton.
An unexpected or abnormal increase in wood prices?
No / Inconclusive. The delivered price of pine pulpwood (PPW) – the primary roundwood product consumed by both Georgia Biomass and Fram – increased 26% in the Georgia catchment area over the six years directly following the startup of Georgia Biomass, increasing from $29.16 per ton in 2011 to $36.63 per ton in 2017. And while this 26% increase in delivered PPW price coincided with a roughly 1.1 million metric ton increase in annual pine pulpwood demand from Georgia Biomass and Fram, total demand for pine pulpwood (from both bioenergy and other sources) actually decreased 7% over this period. Moreover, evidence suggest that this increase in PPW price is more closely linked to changes in wood supply, specifically, the 9% decrease in PPW inventory from 2011-2017.
However, there is evidence that links increased demand from the bioenergy sector to an increase in secondary residual (i.e. sawmill chips, sawdust, and shavings) prices. Specifically, the price of pine sawmill chips – a residual feedstock utilized by the bioenergy industry for wood pellet production – held steady and averaged approximately $26 per ton in the Georgia catchment area from 2008-2012. However, from 2012-2016, pine sawmill chip prices increased more than 15% (to $29.55 per ton in 2016). This increase in price coincided with annual pine residual feedstock purchases by Georgia Biomass and Fram increasing from roughly 325,000 metric tons to nearly 1.0 million metric tons over this period. However, note that pine sawmill chip prices have held steady and averaged roughly $29.50 per ton in the catchment area since 2016, despite further increases in pine secondary residual purchases by Georgia Biomass and Fram (to more than 1.2 million metric tons in 2019).
Ultimately, the data suggests that any excess supply of pine secondary residuals in the catchment area was absorbed by the bioenergy sector in the early and mid-2010s, and the additional demand/competition placed on this market led to increased residual prices. However, the plateauing of residual prices since 2015 along with the continued increase in secondary residual purchases by Georgia Biomass and Fram further suggest that an increasing percentage of secondary residual purchases by the bioenergy sector is sourced from outside the catchment area. Specifically, Fram confirmed this notion, noting that 35-40% of its secondary residual purchases come from outside the Georgia catchment area (from six different states in the US South).
A reduction in growing stock timber?
No. Total growing stock inventory in the catchment area increased 11% from 2011 through 2018, the latest available. Specifically, over this period, inventories of pine sawtimber and chip-n-saw increased 35% and 13%, respectively. However, pine pulpwood inventory decreased 11% from 2011-2018.
Note that the decrease in pine pulpwood inventory was not due to increased demand from bioenergy (or other sources) or increased harvesting above the sustainable yield capacity of the forest area – as annual growth of pine pulpwood has exceeded annual removals every year since 2011. Rather, this decrease can be linked to the 24% decline in pine sawtimber removals that occurred from 2005-2014 (due to the bursting of the US housing bubble and Great Recession that followed). In this region, timber is typically harvested via clearcut once it reaches maturity (i.e. sawtimber grade), after which the stand is reestablished, and the cycle repeated. However, with the reduced harvest levels during this period also came a reduction in newly reestablished timber stands – the source of pine pulpwood. So, with less replantings occurring during this period, inventories of pine pulpwood were not replenished to the same degree they had been previously, and therefore this catchment area saw a reduction in pine pulpwood inventory levels.
However, according to the US Forest Service, annual removals of pine sawtimber have increased 50% in the Georgia catchment area since 2014, which would suggest higher clearcut levels and increased stand reestablishment. TimberMart-South data also supports this assertion, as clearcut harvests have constituted approximately 60% of the total harvest area reported to TimberMart-South in this region since 2014, compared to 40% from 2005-2014. Ultimately, these increases in clearcut (and stand reestablishment) levels may not be reflected in increased pine pulpwood inventory levels in the short term – as it can take more than 10 years for a pine seedling to become merchantable and reach the minimum diameter requirements to be classified as pulpwood. However, adequate supply levels are expected to remain in the meantime. Furthermore, pine pulpwood inventory levels are expected to increase in the mid-to-long terms as a result of the increased harvest levels and stand reestablishment levels that have occurred in the catchment area since 2014.
A reduction in the sequestration rate of carbon?
No / Inconclusive. US Forest Service data shows the average annual growth rate of total growing stock timber has remained nearly unchanged (holding between 6.0% and 6.1%) in the catchment area since 2011, which would suggest that the sequestration rate of carbon has also changed very little in the catchment area the last 8-10 years. However, the 11% increase in total growing stock inventory since 2011 does indicate that total carbon storage levels have increased in the Georgia catchment area since Georgia Biomass commenced operations in this market.
An increase in harvesting above the sustainable yield capacity of the forest area?
No. Growth-to-removals (G:R) ratios, which compare annual timber growth to annual harvests, provides a measure of market demand relative to supply as well as a gauge of market sustainability. In 2018, the latest available, the G:R ratio for pine pulpwood, the predominant timber product utilized by the bioenergy sector, equaled 1.06 (a value greater than 1.0 indicates sustainable harvest levels). Note, however, that the pine pulpwood G:R ratio averaged 1.44 from 2012-2017. The significant drop in 2018 was due to a 31% increase in removals (due to Hurricane Michael) and is not reflective of the new norm. Specifically, pine pulpwood removals are projected to be more in line with pre-2018 levels in 2019 and 2020, and so too is the pine pulpwood G:R ratio.
Timber growing stock inventory
Neutral. According to USFS data, inventories of pine pulpwood decreased 11% in the catchment area from 2011-2018. However, that decrease was not due to increased demand from bioenergy. Typically, a reduction in inventory is linked to harvest levels above the sustainable yield capacity of the forest area, but in this case, annual growth of pine pulpwood exceeded annual removals every year during this period.
Ultimately, the decrease in pine pulpwood inventory from 2011-2018 can be linked to decreased pine sawtimber production beginning in the mid-2000s. Specifically, annual removals of pine sawtimber decreased 24% from 2005-2014, and the reduction in harvest levels during this period meant fewer new pine stands were reestablished, and that has led to the current reduction in pine pulpwood inventory. (Note that the decrease in pine sawtimber removals from 2005-2014 was mirrored by a 27% increase in pine sawtimber inventory over this same period). However, USFS data shows that annual removals of pine sawtimber have increased 50% in the Georgia catchment area since 2014, which suggests that pine pulpwood inventory levels will start to increase in the catchment area due to increased harvest levels and the subsequent increase in stand reestablishment levels.
Timber growth rates
Neutral. Timber growth rates have increased for both pine sawtimber and pine chip-n-saw but decreased slightly for pine pulpwood in the catchment area since 2011. Evidence suggests that this decrease in pine pulpwood growth rate is not due to increases in bioenergy demand, but rather linked to changes in diameter class distribution and indicative of a forest in a state of transition, where timber is moving up in product class (i.e. pine pulpwood is moving up in classification to pine chip-n-saw).
Forest area
Neutral. In the Georgia catchment area, total forest area (timberland) decreased more than 115,000 hectares (-2.8%) from 2011 through 2018. Note that this decrease coincided with a roughly 19,000-hectare increase in cropland and 93,000-hectare increase in urban land and land classified as having other uses.
Specifically, pine timberland, the primary source of roundwood utilized by the bioenergy industry, decreased over 34,000 hectares from 2011-2016. However, from 2016-2018, pine timberland stabilized and rather increased more than 17,000 hectares in the catchment area (or a net decrease of roughly 17,000 hectares from 2011-2018). Ultimately, there is little evidence that the decrease in pine timberland from 2011-2016 or increase since 2016 is linked to increased bioenergy demand. Rather, the overall decrease in pine timberland since 2011 appears to be more closely linked to the relative weakness of pine sawtimber markets in the Georgia catchment area and the lack of return from sawtimber.
Wood prices
Positive / Negative. Intuitively, an increase in demand should result in an increase in price, and this is what the data shows in the Georgia catchment area as it relates to increased biomass demand from Georgia Biomass and Fram and the prices of the various raw materials consumed by these mills. Specifically, the 1.4-million metric ton increase in softwood pulpwood demand attributed to Georgia Biomass and Fram coincided with a 20% increase in delivered pine pulpwood price and a 10-15% increase in pine chip prices from 2011-2015. Since 2015, biomass demand has held relatively steady, and, overall, so too have delivered pine pulpwood and pine chip prices. The apparent link between increased bioenergy demand and increased pine raw material prices is supported further by statistical analysis, as strong positive correlations were found between softwood biomass demand and both delivered pine pulpwood and pine chip prices. However, note that biomass demand alone is not responsible for these changes in prices, as softwood biomass demand accounts for only 10-15% of total softwood pulpwood demand in the catchment area. Rather, the prices of these raw materials are impacted to a larger degree by demand from other sources (i.e. pulp/paper), which accounts for 85-90% of total softwood pulpwood demand in the Georgia catchment area.
On the other hand, it’s also important to note that the increase in bioenergy-related wood demand has been a positive for forest landowners in the Georgia catchment area. Not only has bioenergy provided an additional outlet for pulpwood in this market, but the increase in pulpwood prices as a result of increased pulpwood demand has transferred through to landowners (improved compensation). Specifically, since 2015, pine pulpwood (PPW) stumpage price – the price paid to landowners – has averaged more than $17 per ton in the Georgia catchment area. This represents a 70% increase over the approximately $10 per ton averaged by PPW stumpage in the catchment area over the last five years prior to Georgia Biomass’ startup in 2Q 2011.
(Note: Pine pulpwood stumpage prices are notably higher in the Georgia catchment area due to a much tighter balance in supply and demand (in comparison to most other markets across the US South). For instance, in all other areas across the US South2, PPW stumpage prices have averaged less than $9 per ton since 2015, or roughly half that of prices in the Georgia catchment area).
Markets for solid wood products
Positive. In the Georgia catchment area, demand for softwood sawlogs used to produce lumber and other solid wood products increased an estimated 39% from 2011-2019, and by-products of the sawmilling process are sawmill residuals – materials utilized by Georgia Biomass and the Fram mills to produce wood pellets. With the increased production of softwood lumber, so too has come an increase in sawmill residuals, some of which have been purchased/consumed by Georgia Biomass and Fram. Not only have these pellet producers benefited from the greater availability of this by-product, but lumber producers have also benefited, as the Georgia Biomass and Fram mills have provided an additional outlet for these producers and their by-products.

In ecological terms, biomass refers to any type of organic matter. When it comes to energy, biomass is any organic matter that can be used to generate energy, for example wood, forest residues or plant materials.
Biomass used and combusted for energy can come in a number of different forms, ranging from compressed wood pellets – which are used in power stations that have upgraded from coal – to biogas and biofuels, a liquid fuel that can be used to replace fossil fuels in transport.
The term biomass also refers to any type of organic material used for energy in domestic settings, for example wood burned in wood stoves and wood pellets used in domestic biomass boilers.
Biomass is organic matter like wood, forest residues or plant material, that is used to generate energy.
Biomass can be produced from different sources including agricultural or forestry residues, dedicated energy crops or waste products such as uneaten food.
Drax Power Station uses compressed wood pellets sourced from sustainably managed working forests in the US, Canada, Europe and Brazil, and are largely made up of low-grade wood produced as a byproduct of the production and processing of higher value wood products, like lumber and furniture.
Biomass producers and users must meet a range of stringent measures for their biomass to be certified as sustainable and responsibly sourced.
Biomass grown through sustainable means is classified as a renewable source of energy because of the process of its growth. As biomass comes from organic, living matter, it grows naturally, absorbing carbon dioxide (CO2) from the atmosphere in the process.
It means when biomass is combusted as a source of energy – for example for heat or electricity production – the CO2 released is offset by the amount of CO2 it absorbed from the atmosphere while it was growing.
Biomass is a renewable, sustainable form of energy used around the world.
Biomass has been used as a source of energy for as long as humans have been creating fire. Early humans using wood, plants or animal dung to make fire were all creating biomass energy.
Today biomass in the form of wood and wood products remains a widely used energy source for many countries around the world – both for domestic consumption and at grid scale through power stations, where it’s often used to replace fossil fuels with much higher lifecycle carbon emissions.
Drax Power Station has been using compressed wood pellets (a form of biomass) since 2003, when it began research and development work co-firing it with coal. It fully converted its first full generating unit to run only on compressed wood pellets in 2013, lowering the carbon footprint of the electricity it produced by more than 80% across the renewable fuel’s lifecycle. Today the power station runs mostly on sustainable biomass.


Carbon capture and storage (CCS) is the process of trapping or collecting carbon emissions from a large-scale source – for example, a power station or factory – and then permanently storing them.
Carbon capture usage and storage (CCUS) is where captured carbon dioxide (CO2) may be used, rather than stored, in other industrial processes or even in the manufacture of consumer products.
Carbon can be captured either pre-combustion, where it is removed from fuels that emit carbon before the fuel is used, or post-combustion, where carbon is captured directly from the gases emitted once a fuel is burned.
Pre-combustion carbon capture involves solid fossil fuels being converted into a mixture of hydrogen and carbon dioxide under heat pressure. The separated CO2 is
captured and transported to be stored or used.
Post-combustion carbon capture uses the addition of other materials (such as solvents) to separate the carbon from flue gases produced as a result of the fuel being burned. The isolated carbon is then transported (normally via pipeline) to be stored permanently – usually deep underground – or used for other purposes.
Carbon capture and storage traps and removes carbon dioxide from large sources and most of that CO2 is not released into the atmosphere.
Once carbon is captured it can be stored permanently or used in a variety of different ways. For example, material including carbon nanofibres and bioplastics can be produced from captured carbon and used in products such as airplanes and bicycles, while several start-ups are developing methods of turning captured CO2 into animal feed.
Captured carbon can even assist in the large-scale production of hydrogen, which could be used as a carbon-neutral source of transport fuel or as an alternative to natural gas in power generation.

Carbon can be stored in geological reserves, commonly naturally occurring underground rock formations such as unused natural gas reservoirs, saline aquifers, or ‘unmineable’ coal beds. The process of storage is referred to as sequestration.
The underground storage process means that the carbon can integrate into the earth through mineral storage, where the gas chemically reacts with the minerals in the rock formations and forms new, solid minerals that ensure it is permanently and safely stored.
Carbon injected into a saline aquifer dissolves into the water and descends to the bottom of the aquifer in a process called dissolution storage.
According to the Global CCS Institute, over 25 million tonnes of carbon captured from the power and industrial sectors was successfully and permanently stored in 2019 across sites in the USA, Norway and Brazil.
CO2 is a greenhouse gas, which traps heat in our atmosphere, and therefore contributes to global warming. By capturing and storing carbon, it is being taken out of the atmosphere, which reduces greenhouse gas levels and helps mitigate the effects of climate change.


Climate change refers to the change in weather patterns and global temperature of the earth over long periods of time. In a modern context, climate change describes the rise of global temperatures that has been occurring since the Industrial Revolution in the 1800s.
While there have been natural fluctuations in the earth’s climate over previous millennia, scientists have found that current-day temperatures are rising quicker than ever due to the excessive amount of carbon dioxide (CO2) and other greenhouse gasses being released into the atmosphere.

An excess of CO2 in the atmosphere accentuates something called the ‘greenhouse effect’. As CO2 traps heat in the earth’s atmosphere, it warms the planet and causes a rise in average global temperature. International efforts, such as the Paris Climate Accords, are dedicated to ensuring temperatures do not rise 2 degrees Celsius above pre-industrial levels, which could lead to catastrophic conditions on the planet.
In the modern context, climate change describes the rise of global temperatures occurring since the Industrial Revolution in the 1800s.
Industries such as transport, agriculture, energy and manufacturing have traditionally relied on the use of coal, oil and other fossil fuels. These fuels, when combusted or used, emit large amounts of CO2 into the atmosphere, further advancing the greenhouse effect and contributing to climate change.
Human reliance and consumption of these products mean today CO2 levels are the highest they’ve been in 800,000 years.
Our planet has a history of experiencing periods of extreme weather conditions – for example the last Ice Age, which finished 12,000 years ago. However, the rapid rise in temperatures seen today is harmful because a hotter planet completely affects our natural environment.
A steep rise in global temperature can melt ice sheets and cause higher sea levels which can, in turn, contribute to more extreme storms and even threaten entire islands and coastal communities. As the planet warms, extreme weather events, such as bushfires could become more common, which can destroy homes, impact agriculture and degrade air quality, while entire ecosystems, habitats and animal and insect species could also be threatened by climate change.
Reducing CO2 emissions is a key way of slowing down the pace of climate change. To do so, industries across the global economy must decarbonise to become less dependent on fossil fuels, such as coal and petrol, and adopt new lower carbon energy sources.
Decarbonisation will rely on a number of factors, including a technological response that sees the development and implementation of carbon neutral and carbon negative ways of creating heat, electricity and fuels, including the use of innovations such as carbon capture and storage (CCS).
There is also a need for a policy and governmental response that promotes investment in new cleaner technologies and disincentivises dirtier industries through mechanisms like the carbon tax. Countries and economies will need to work collaboratively to achieve common, climate-oriented goals that will also enable smaller scale action to be taken by individuals around the world.


Decarbonisation is the term used for the process of removing or reducing the carbon dioxide (CO2) output of a country’s economy. This is usually done by decreasing the amount of CO2 emitted across the active industries within that economy.
Currently, a wide range of sectors – industrial, residential and transport – run largely on fossil fuels, which means that their energy comes from the combustion of fuels like coal, oil or gas.
The CO2 emitted from using these fuels acts as a greenhouse gas, trapping in heat and contributing to global warming. By using alternative sources of energy, industries can reduce the amount of CO2 emitted into the atmosphere and can help to slow the effects of climate change.

There are numerous greenhouse gases that contribute to global warming, however CO2 is the most prevalent. As of 2018, carbon levels are the highest they’ve been in 800,000 years.
The Paris Agreement was created to hold nations accountable in their efforts to decrease carbon emissions, with the central goal of ensuring that temperatures don’t rise 2 degrees Celsius above pre-industrial level.
With 195 current signatories, economies have begun to factor in the need for less investment in carbon, with the UK leading the G20 nations in decarbonising its economy in the 21st century.
There are numerous energy technologies that aim to reduce emissions from industries, as well as those that work towards reducing carbon emissions from the atmosphere.
Decarbonisation has had the most progress in electricity generation because of the growth of renewable sources of power, such as wind turbines, solar panels and coal-to-biomass upgrades, meaning that homes and businesses don’t have to rely on fossil fuels. Other innovations, such as using batteries and allowing homes to generate and share their own power, can also lead to higher rates of decarbonisation. As the electricity itself is made cleaner, it therefore assists electricity users themselves to become cleaner in the process.
Other approaches, such as reforestation or carbon capture and storage, help to pull existing carbon from the air, to neutralise carbon output, or in some cases, help to make electricity generation – and even entire nations – carbon negative.
Alternative power options means that homes and businesses don’t have to rely on traditional carbon fuels.
For decarbonisation to be more widely adopted as a method for combating climate change, there needs to be structural economical change, according to Deloitte Access Economics. Creating more room for decarbonisation through investing in alternative energies means that “there are a multitude of job-rich, shovel-ready, stimulus opportunities that also unlock long-term value”.


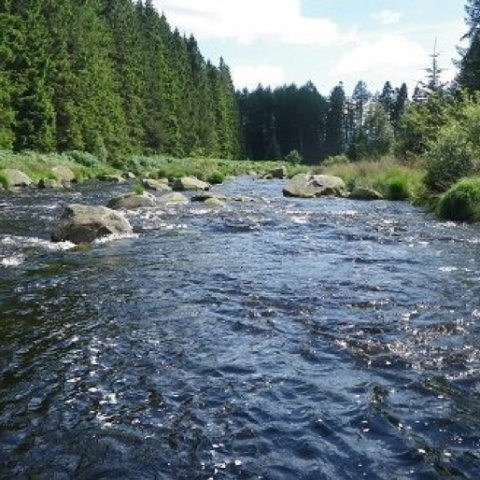
The River Dee in south-west Scotland flows from its source in Loch Dee through the Galloway Hills, firstly to Clatteringshaws Loch, then into Loch Ken, where it joins the Water of Ken.
As in much of Scotland, salmon populations here have struggled, with rod catches at an all-time low. Climate change leading to warmer rivers and seas, commercial farming and changes in food supply have all been blamed.

Fly-fishing on the River Tweed with the iconic Kelso Bridge at the background. Kelso, Scottish Borders, Scotland
In 2019 Drax Group pledged £100,000 over four years to support community initiatives in the Galloway Glens region as part of its efforts to support those living in the areas in which it operates.
One of these projects is the Blackwater of Dee Restoration project which aims to boost salmon stocks by moving natural river sediments past large impoundments such as dams – the first time in Scotland that targeted support has been provided to recreate the natural movement of aggregate along the length of the river. The project is situated downstream of Clatteringshaw Dam which facilitates electricity generation at Drax’s Galloway Hydro-Electric scheme.
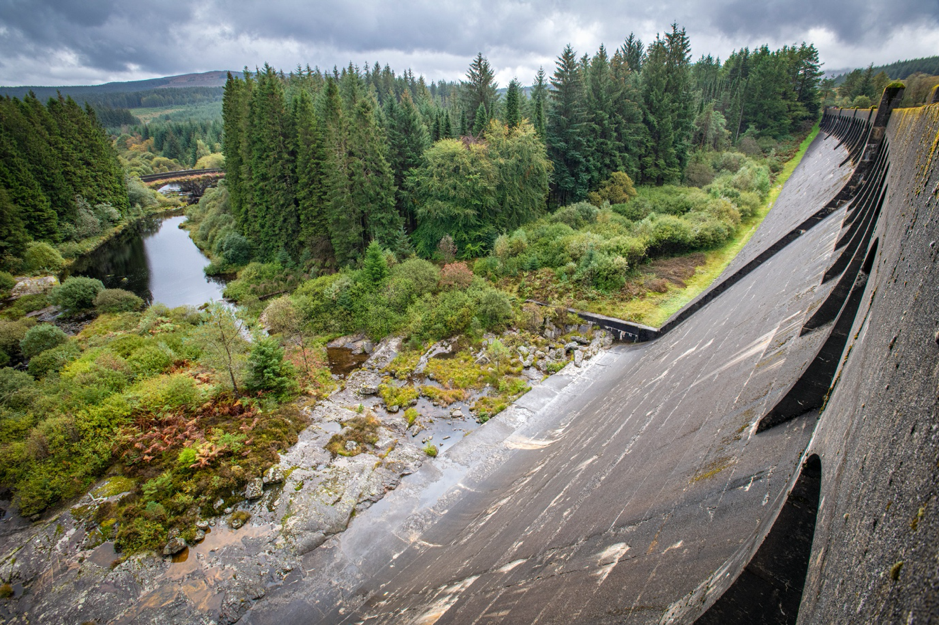
Clatteringshaw Dam
Human beings have always had an extensive relationship with rivers. For thousands of years they have provided food, hydration and highways.
Ancient people worshipped rivers: the word Dee is derived from the word Deva, one of the oldest written words in the English language, dating back to 150AD, a Celtic word for goddess.
As civilisations developed, rivers became sources of wealth. Rivers – like coal – powered the industrial revolution with watermills driving many forms of industry. The harnessing of the Blackwater of Dee as a power source in the 1930s was a major feat of human ingenuity which provided power for the country.
As part of this project, Galloway Fisheries Trust has been training an army of volunteers to look after the Dee. These volunteers collect data on the river habitats, the fish and invertebrate populations. They have planted native trees and removed non-native invasive plant species.
It is hoped that the project will signal a genuine kickstart to rebuilding Scotland’s salmon population in the long term.
“Drax is proud to support the Galloway Glens Scheme in the effort to restore salmon stocks,” says Stuart Ferns, Drax’s Galloway Hydro Scheme Operations Manager. Ferns noted the initiative also provides “innovative and exciting learning opportunities for young people across the South of Scotland.”
McNabb Laurie, Galloway Glens Team Leader, believes the scheme is a great example of the private sector working with the not-for-profit sector: “This is the first project of this type in Scotland, another first for Galloway!
“We need to pursue every avenue we can to support salmon and other species in the Dee catchment,” Laurie comments. “Our thanks as always going to National Lottery Heritage Fund for the funding and Scheme partners including Drax, Dumfries & Galloway Council and the Galloway & Southern Ayrshire UNESCO Biosphere.”
Earlstoun Fish Pass: l-r McNabb Laurie, Jamie Ribbens, Rowan McCleary, Stuart Ferns
Read more information about the project or contact the Galloway Fisheries Trust on 01671 403011.