


The US South’s biomass sourcing areas analysed
Chapter 1:
Catchment areas in the US South
The first phase of the catchment area analysis (CAA) programme looking at forest and market trends in the landscape surrounding pellet mills in the US South is complete. The reports find:
- Stable forest areas
- Surplus growth
- No evidence of deforestation
- An increase in overall inventory stock
- Improved carbon sequestration and storage across the landscape
This first phase involved five separate study areas with a cumulative supply of 3.6 million tonnes of pellets to Drax in 2019, representing 49% of total consumption in that year. The analysis looked at individual pellet mills, or clusters of mills, depending on the proximity and overlap of procurement patterns.
The most relevant statistics and data points are summarised in table 1 below. The total timberland area (working forest) included in the analysis was 16.5 million hectares (ha), which represented 63% of the total land area across all five catchment areas. This demonstrates the significance of forestry in the landscape for industry and employment, economic return and revenue generation, aesthetic value and recreation, biodiversity and ecology.
This analysis focuses on the inventory and market statistics, whilst details of the biodiversity and socio-economic analysis will be covered through Drax’s Healthy Forest Landscapes project results.
| Amite | Morehouse | LaSalle | Chesapeake | Georgia | |
|---|---|---|---|---|---|
| Latest available data | 2019 | 2018 | 2016 | 2018 | 2018 |
| Supply to Drax 2019 (tonnes pellets) | 490,096 | 441,846 | 353,407 | 1,188,138 | 1,083,141 |
| Supply to Drax 2019 (m³) equivalent | 1,029,202 | 927,877 | 742,155 | 2,495,090 | 2,274,596 |
| Total catchment area size (ha) | 659,979 | 4,328,223 | 7,422,406 | 7,952,830 | 5,961,143 |
| Timberland Area (ha) | 552,356 | 2,826,480 | 4,405,483 | 4,704,058 | 3,995,028 |
| Timberland % | 83.69% | 65.30% | 59.35% | 59.15% | 67.02% |
| Total Inventory (m³) | 93,753,474 | 358,494,825 | 474,716,489 | 693,056,287 | 391,331,161 |
| 5-year change (m³) | 8,501,255 | 32,662,292 | 27,302,139 | 93,835,853 | 30,083,315 |
| Inventory change % | 9.97% | 10.02% | 6.10% | 15.66% | 8.33% |
| Annual growth (m³) | 4,983,917 | 20,823,631 | 24,507,121 | 35,702,012 | 23,565,442 |
| Annual removals (m³) | 3,009,136 | 13,910,680 | 19,196,278 | 19,757,849 | 21,131,216 |
| Annual surplus (m³) | 1,974,781 | 6,912,951 | 5,310,843 | 15,944,164 | 2,432,226 |
| Pellet use as proportion of inventory | 1.10% | 0.26% | 0.16% | 0.36% | 0.58% |
| Pellet use as proportion of growth | 20.65% | 4.46% | 3.03% | 6.99% | 9.65% |
| Pellet use as proportion of removals | 34.20% | 6.67% | 3.87% | 12.63% | 10.76% |
Overall pellet supply from these areas represented just 0.37% of the total inventory, or total volume of wood growing in the forest; 6.8% of the average annual growth and 9.7% of the total annual removals of wood (harvesting) or approximately 5.7% of the total value of removals [1].

Working forest in LaSalle BioEnergy catchment area, Louisiana
Therefore, the wood pellet markets can be considered to be a minor part of the total demand and utilisation of wood products in these areas. Only in the Amite catchment area did the pellet mill consumption represent a significantly higher proportion of the market at 34% of removals by volume (although only 11.5% by value). This is due to the relatively small and focused nature of this catchment area (only looking at roundwood supplies rather than residues) with few competing markets and a substantial surplus of fibre. Therefore, the pellet mill plays a more significant role in the market for low grade roundwood, thinnings and residues. Amite produced 13.8% of the pellets in 2019 from just 3.4% of the timberland area across the five study regions.
The total surplus of annual growth compared to removals, in the latest available data year, was 32.5 million cubic meters (m3). This is the volume of unharvested material that adds to the total inventory each year. This volume could potentially be harvested without compromising the sustainable production capacity of the forest landscape if markets were to expand.
In the last five years, prior to the latest available inventory data, the overall volume of standing timber, known as inventory, has increased by 192.4 million m3 despite a trend of increasing removals. This demonstrates the increasing rate of growth and carbon sequestration across the US South.
This trend of increasing growth rate and sequestration is the most consistent across all catchment areas, with similar data trends evident in each report. Other metrics, such as timberland area, wood product demand, and stumpage prices, are much more variable from one area to another.
Chapter 2:
Stable forest area
At a macro level, the area of timberland in each study area has remained relatively stable, in the context of the total size of the landscape and the proportion of forest cover (Figure 1).
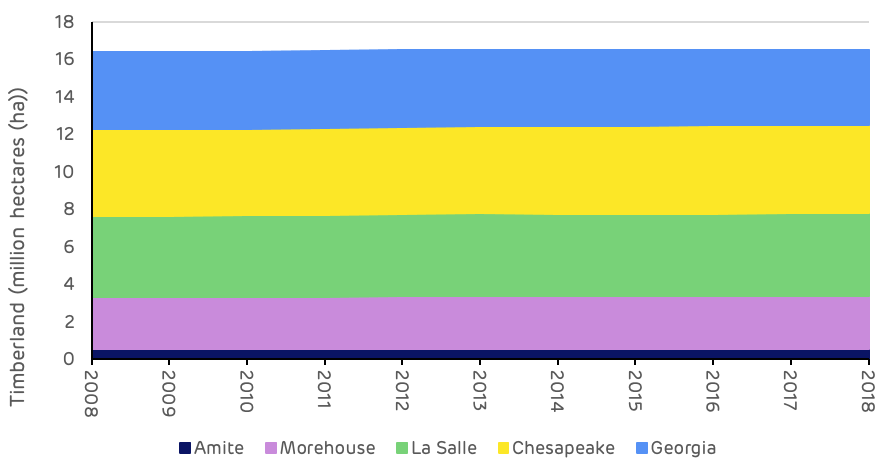
Figure 1: Change in timberland area by catchment area (USFS)
To be able to consider changes in the forest landscape resulting from wood pellet demand, a baseline has been set at 2013. This is the year in which Drax converted its first power generating unit to 100% biomass combustion, leading to a significant increase in wood pellet demand. Drax used around 0.7 million tonnes of wood pellets in 2012, increasing to 1.6 million tonnes in 2013 and 4.1 million tonnes in 2014 with the conversion of a second unit (59% coming from the US South). Therefore, 2013 is the most appropriate year against which to compare the latest available forest inventory data.
The total timberland area in these five studies decreased slightly between 2013 to 2018 by 24,500 ha or 0.15% but can generally be considered to have been stable.
The individual change in timberland area for each study is shown in Figure 2 below, indexed against a base year of 2013. The chart shows a slightly different trend in each micro-region: generally increasing forest area in Louisiana (Morehouse and La Salle), stable area in Mississippi (Amite), decreasing area in the Georgia cluster and a fluctuating up and down trend in the Chesapeake cluster. There are specific reasons for each of these trends which are discussed in more detail in the individual reports and associated articles.
In general, the loss or gain in timberland area can be attributed to the strength of timber markets and pressure of demand from other land uses. Where timber market demand is strong and stumpage prices are high, forest owners will be encouraged to maintain and expand their forest area; where revenue from wood products is poor (in comparison to agriculture), or opportunities to convert to urban land exist, then there is likely to be more loss of forest land.
In Georgia, despite high stumpage prices and strong demand, the pressure from increased urban development has led to the loss of some forest area. Short term, high yield, agricultural is also a factor encouraging landowners to convert from forests to other uses.
A recent study by the university of Georgia[2] showed that more than 6,000 ha of forest in southern Georgia had been converted to blueberry production in order to increase short-term profits between 2010 and 2017. The study also showed that the majority of these landowners would have continued to manage land as forest if appropriate financial incentives had been in place.
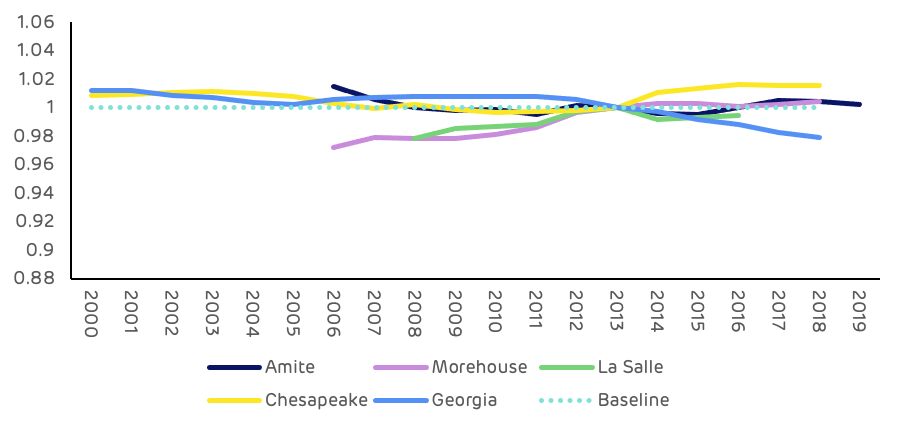
Figure 2: Change in timberland, index from 2013 (USFS)
Avoiding deforestation and forest loss is an important requirement for biomass sustainability; whilst there is a limited influence that the smallest and lowest paying market can have in persuading private landowners to retain forest; providing a complementary market for thinnings, low-grade roundwood and in-woods chips can contribute to the overall viability of the forest resource.
Chapter 3:
Increasing forest inventory
The change in forest inventory (Figure 3) has been positive across all areas, and is the most consistent trend of all of the metrics. Although the degree of growth and increased volume varies across each region, this will be dependent on the specific characteristics of that forest landscape, such as age class distribution, species mix, site productivity or management regime.
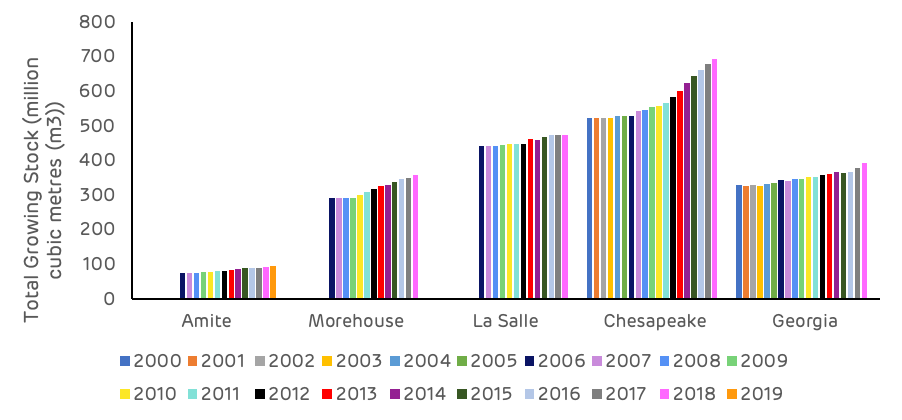
Figure 3: Annual change in inventory volume by catchment area (USFS)
The increase in growth and volume has been particularly significant in the most recent years with cumulative growth across all five study areas increasing by 178 million m3 from 2013 to 2018[3] compared to 127 million m3 in the previous five year period from 2008 to 2013. This rapid increase in total volume of wood fibre stored in the forest is clearly shown in Figure 4 below, indexed against a base year of 2013.
Sequestration and storage of carbon is a critical factor in the role that forests can play in climate change mitigation. This data shows that deforestation and forest loss are not the only important consideration. Rate of growth, productivity, and the ability store carbon (including storage in harvested wood products) is potentially even more significant.
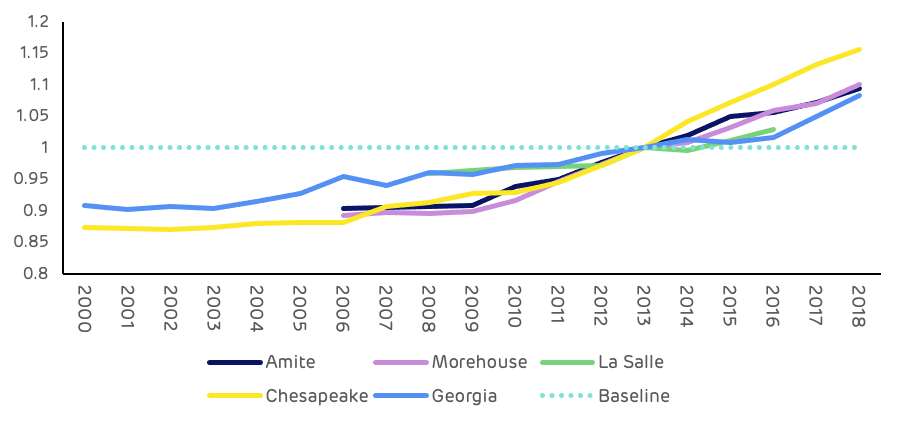
Figure 4: Change in inventory volume, index from 2013 (USFS)
The reason for the increase in the rate of growth can be due to multiple factors. It can be a product of the age class, with a high proportion of stands in the rapid growth mid-rotation phase of the cycle. It can also be due to recent improvement in forest management practice – improved seedlings, planting, and husbandry – which are now showing clear improvements in growth rates on the ground. It can also be caused by increased thinning in previous years which leads to an increase in the production of larger volume sawlog material. However, this tends to increase value rather than standing volume, as the increased growth compensates for the volume removed by thinning, concentrating the total volume on a smaller number of larger trees – which can store more carbon in longer term solid wood products.
In most of the catchment areas the increase in growth has not led to an increase in harvest removals, as shown in Figure 5. Pine pulpwood and sawtimber removals have been relatively stable in each area with the exception of Amite, due to increased biomass demand in a small catchment area with limited existing markets. The Georgia region also showed a spike in 2018 due to Hurricane Michael, but has otherwise been stable.
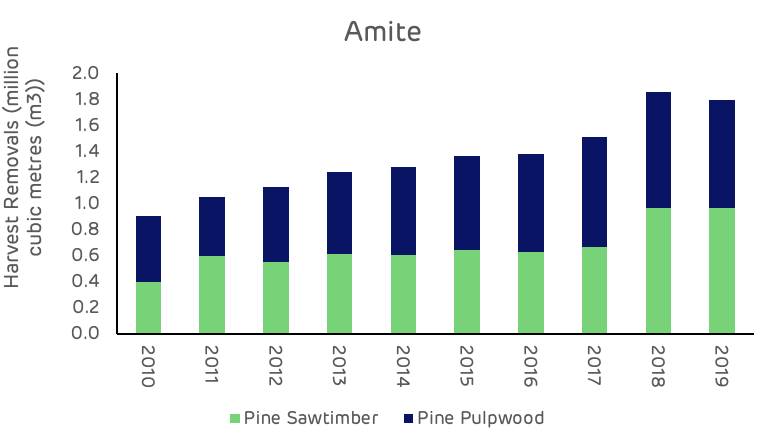
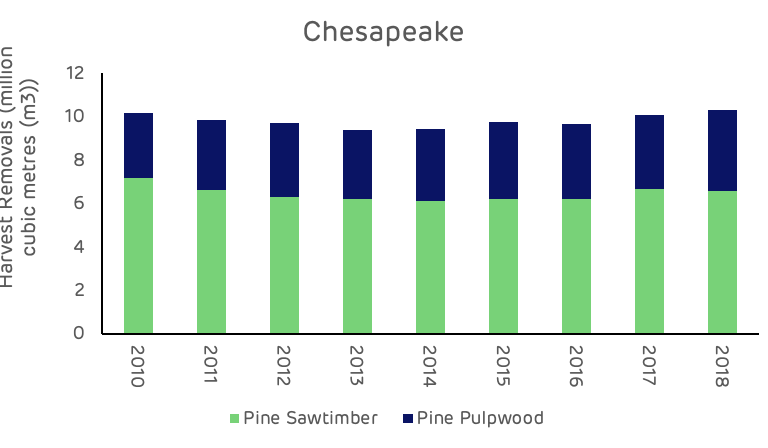
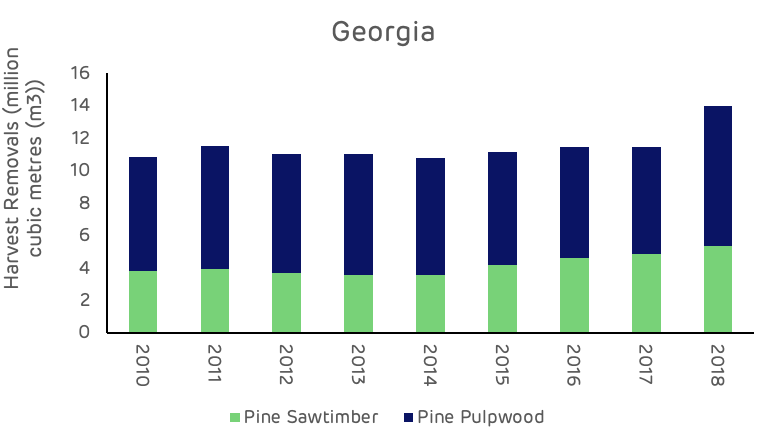
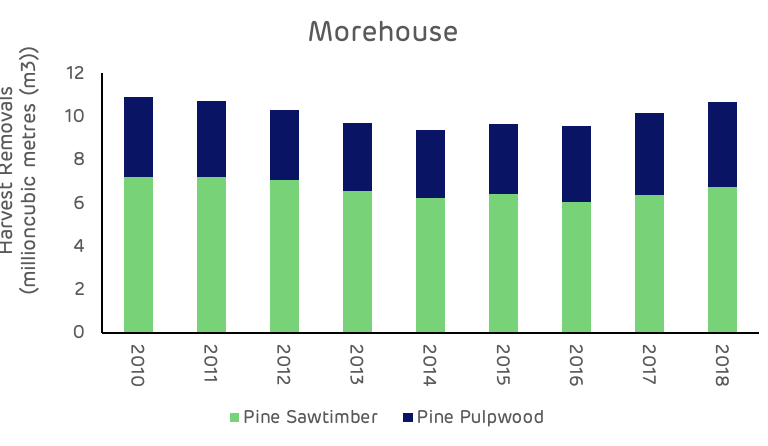
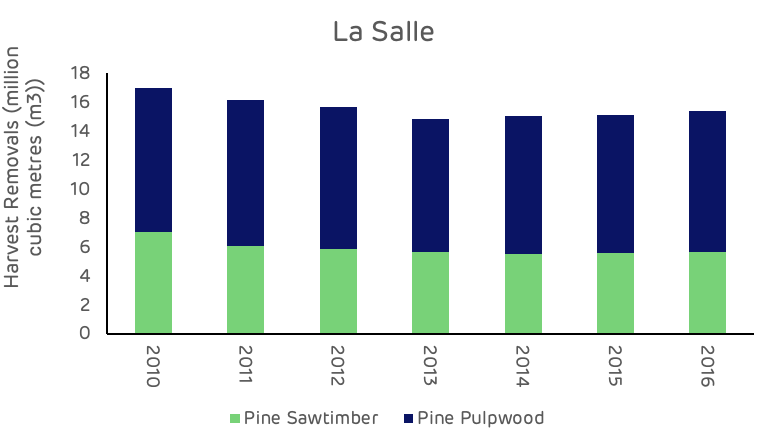
Figure 5: Annual harvest removals of pine pulpwood and sawtimber (USFS)
Three of the catchment areas (Morehouse, La Salle and Chesapeake), show a strong trend in the increase of average annual surplus volume (Figure 6). Amite shows a declining surplus as a result of increased biomass demand and the impact that this has had on a relatively small catchment area with limited existing markets. The Georgia region has remained relatively stable in the volume of surplus fibre.
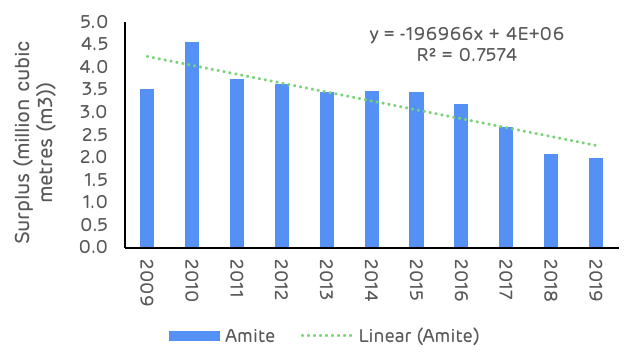
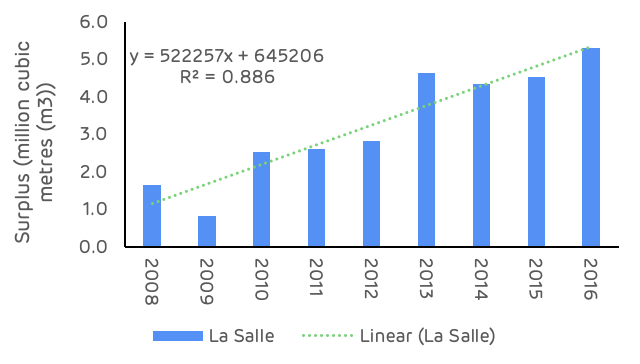
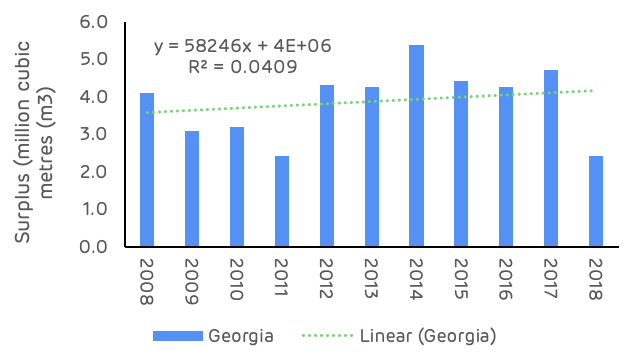
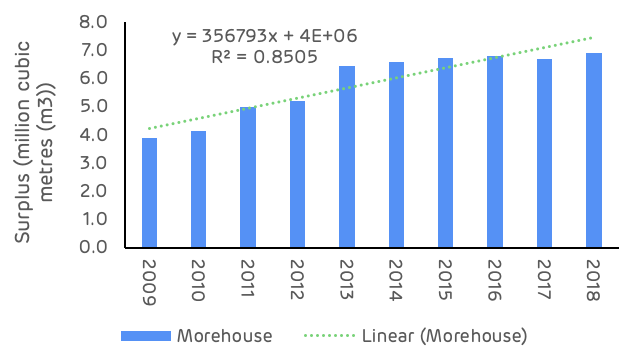
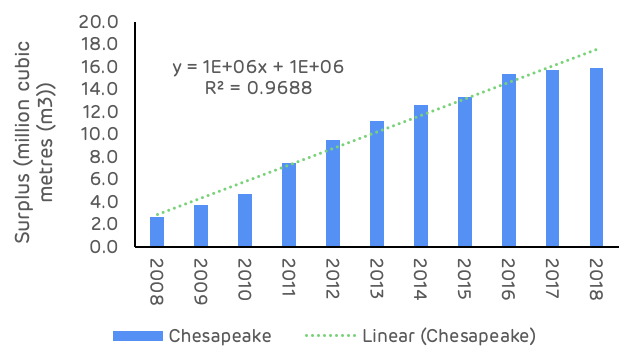
Figure 6: Average annual surplus of growth to removals by catchment area (USFS)
The impact of the new market demand at Amite is more clearly shown in Figure 7 below where the ratio of growth to drain (harvesting removals) begins to decline from around 2010, albeit from an extremely high starting point.
This is prior to the construction of the Drax pellet mill, where supply did not begin until the end of 2014. Therefore, this change in the supply and demand balance was due to fluctuations in other markets impacting on this catchment area. The decreasing trend continued after 2014 with the addition of the pellet mill. However, even in 2019 there was a surplus of nearly 2 million m3 of annual growth which represents 40% of the total catchment area growth – still a substantial quantity of unharvested timber. Each of the other catchment areas has remained relatively stable; all showing a growth to drain ratio greater than 1, which is considered to be sustainable from the perspective of the long-term production capacity of the forest.
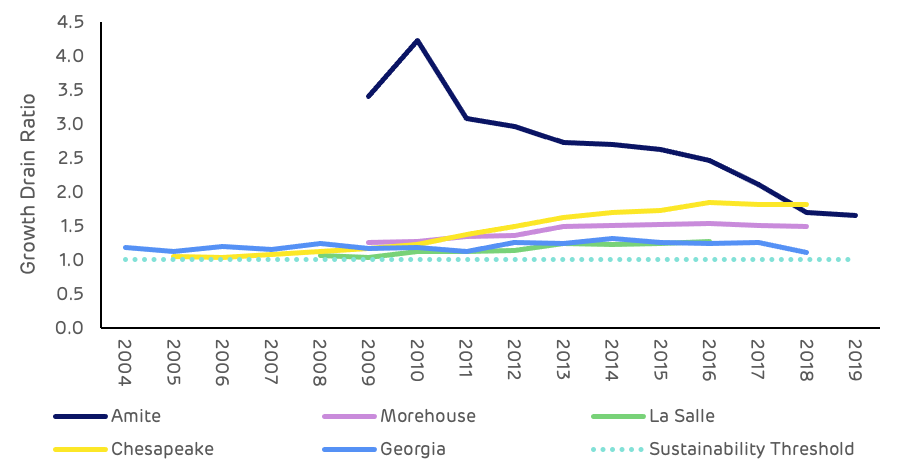
Figure 7: Growth to drain ratio by catchment area (USFS)
The ratio of growth to harvest is not the most important metric when considering sustainable harvesting, as discussed by US forestry consultants Forisk. A ratio of 1 indicates that harvest and growth are in balance, but this is only relevant in a perfectly uniform and balanced forest landscape with an even age class distribution. In almost all real-life forest landscapes the age class will be skewed either to older or younger stands. Where stands are older, growth will be slower, but harvesting should be higher as crops are at the end of the rotation. Conversely, young stands are faster growing but not yet mature enough for harvesting, therefore the growth to drain ratio will be much more positive. Therefore, the accumulated inventory or build-up of harvestable mature wood is a more important data point to indicate the potential for timber supply and sustainable harvesting, this metric is strong across all five catchment areas (as shown in Figures 3, 4 and 6 above).
Chapter 4:
Stumpage prices and relative value
Pine pulpwood is the primary feedstock for each of the pellet mills included within the study (excluding sawmill residuals). Stumpage prices (the value paid to the forest owner) for this feedstock are shown in Figure 8 below. Stumpage prices can vary considerably depending on market demand, macro-economic trends and weather events. They also vary from region to region depending on the local supply and demand balance and the wood paying capacity of each of the local markets.
The largest fluctuations in prices have occurred in the Chesapeake and Georgia catchment areas, regions where there has been a higher turnover of markets due to some closures and production reductions and other new market expansions. Variability in demand also impacts stumpage prices, depending on the end-product markets and the availability of fibre, high pulp and paper prices and low fibre availability (perhaps due to wet weather). More detailed analysis of the price trend in each region are presented in the individual CAA reports.
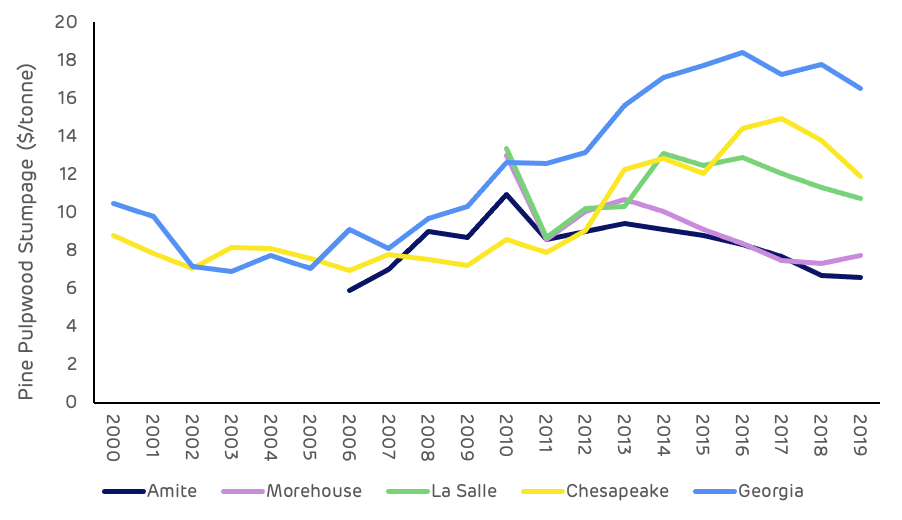
Figure 8: Pine pulpwood stumpage price (TMS)
Pulpwood prices increased across all markets following the global economic crisis in 2008, as a result of reduced demand for construction timber and therefore decreased production of sawmill residuals. This caused an increase in the harvesting of pulpwood to feed the pulp and paper industry, leading to stumpage price increases. The development of wood pellet mills has had no impact on prices in some of the catchment areas (Amite and Morehouse) and a small temporary increase in others (La Salle and Chesapeake). In the Georgia catchment area, price trends have been driven by the dominant pulp and paper sector that utilises 87% of the total pulpwood demand. More detailed analysis of these trends can also be found in the individual reports.
Figure 9 below shows the relative value of pulpwood compared to saw-timber. Sawtimber is typically 2.5 times more valuable to the forest owner than pulpwood, this is their incentive to maximise the production of sawtimber and to ensure that as much wood fibre as possible can be sold to higher value markets. This price differential is the primary reason why pellet markets are unlikely to displace sawmills or utilise any wood fibre that could otherwise have been used in higher value markets.
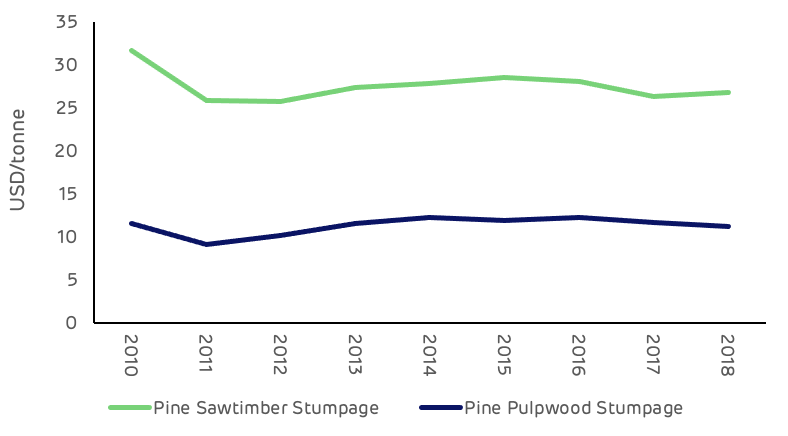
Figure 9: Average pine stumpage across all 5 catchment areas (TMS)
Figure 10 shows the price difference between hardwood sawtimber and pulpwood stumpage which is more than three times greater.
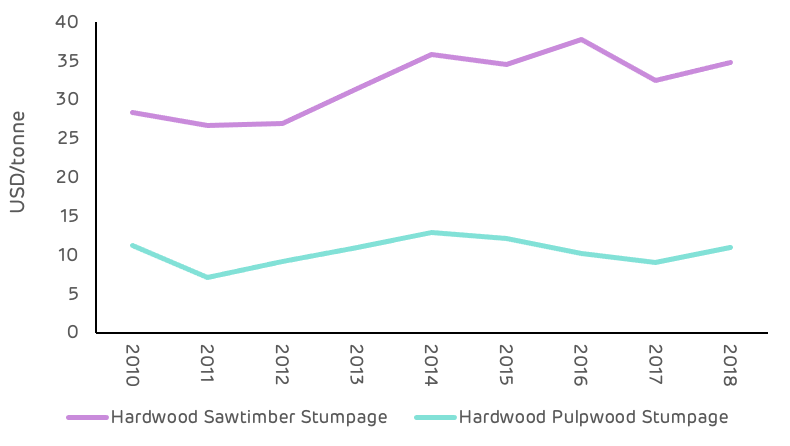
Figure 10: Average hardwood stumpage across all 5 catchment areas (TMS)
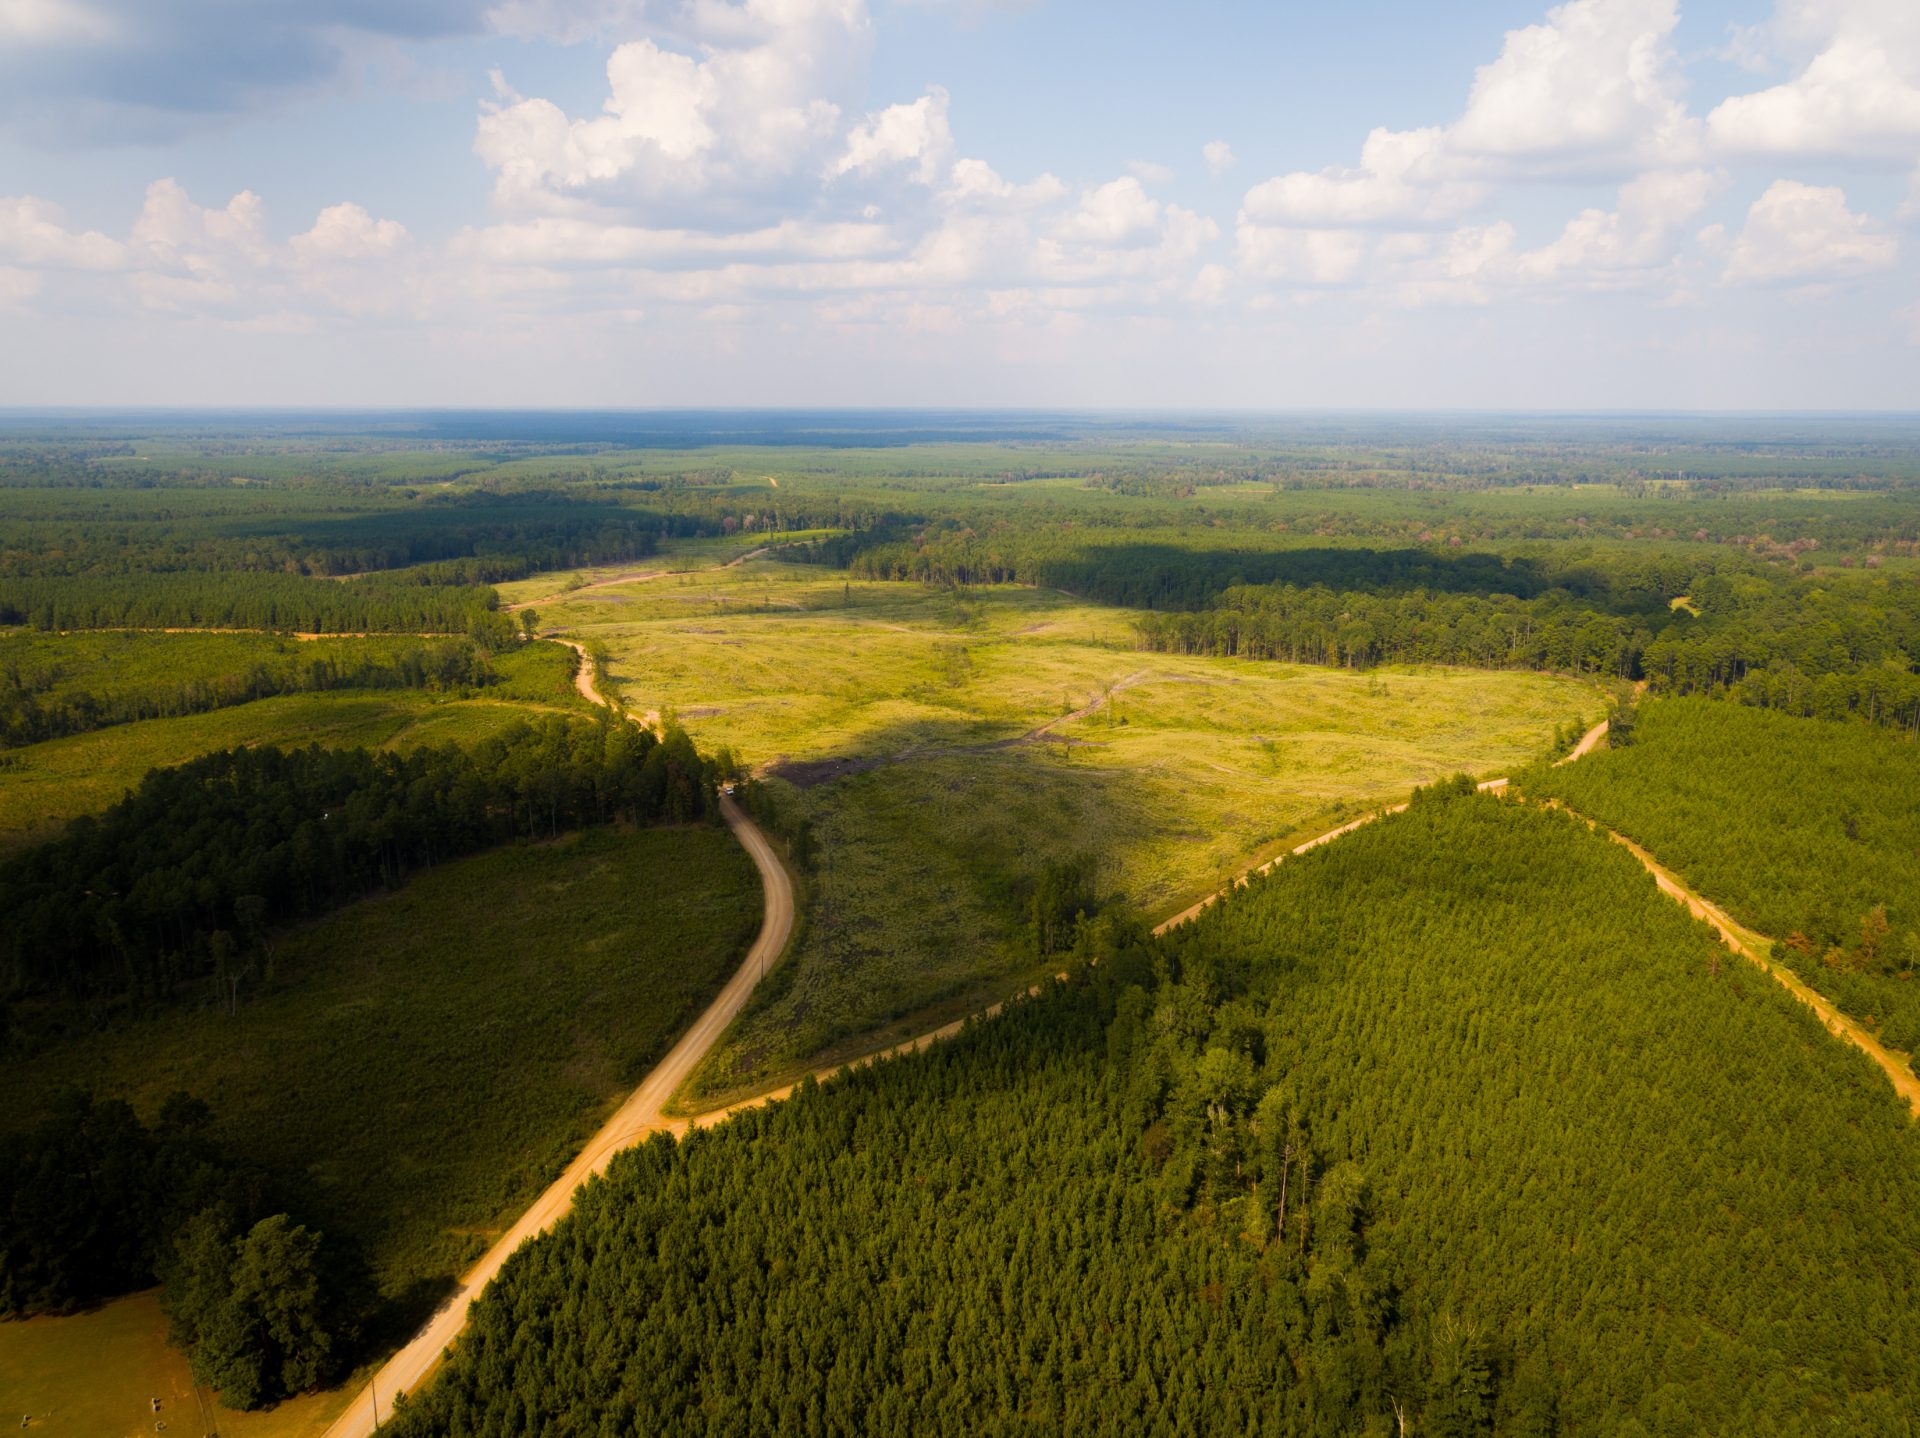
Working forest in LaSalle catchment area, showing a stand recently felled for high-value wood products such as sawtimber. The lower-value wood was used to manufacture pellets, among other products. This stand will have subsequently been replanted.
Markets for both pulpwood and sawtimber are affected by different market drivers, although there are some common drivers such as weather events or macro-economic trends. Pulpwood demand is often dominated by the pulp and paper industry and their drivers tend to be global markets for these commodities and local factors that may affect availability and costs, including the availability of contractors, operating costs, access to harvesting tracts and local weather.
Pellet mills tend to be limited by the low paying capability of the market and long-term supply contracts that limit the flexibility of producers to vary prices. The pellet market is predominantly based on bi-lateral long-term contracts with fixed pricing mechanisms. Therefore, pellet mills do not have the same flexibility to increase raw material prices as the pulp and paper sector and tend to feed off the closest available, lowest cost feedstock.
Sawmill demand and paying capability is almost entirely driven by the domestic and regional construction and housing sector, a buoyant housing economy leads to high demand and higher prices for saw-timber, which in turn increases the availability of residues.
The proportion of pulpwood compared to sawtimber, produced from each harvest, is usually determined by the size and quality of the trees; bigger and straighter trees are usually suitable for sawtimber markets, whereas smaller or poor quality trees are usually only viable for pulpwood markets.
Thinning operations will usually produce a higher proportion of pulpwood as the stand is typically early or mid-rotation so all of the trees will be a smaller size and the purpose of the operation is often to remove the smallest and poorest trees. Clear cuts will typically produce a much higher proportion of sawtimber, particularly in stands that have previously been thinned.
Figure 10 below demonstrates the relative value of pine pulpwood in each of the five markets, showing pine pulpwood revenue as a proportion of the combined pine pulpwood and sawtimber revenue in that region.
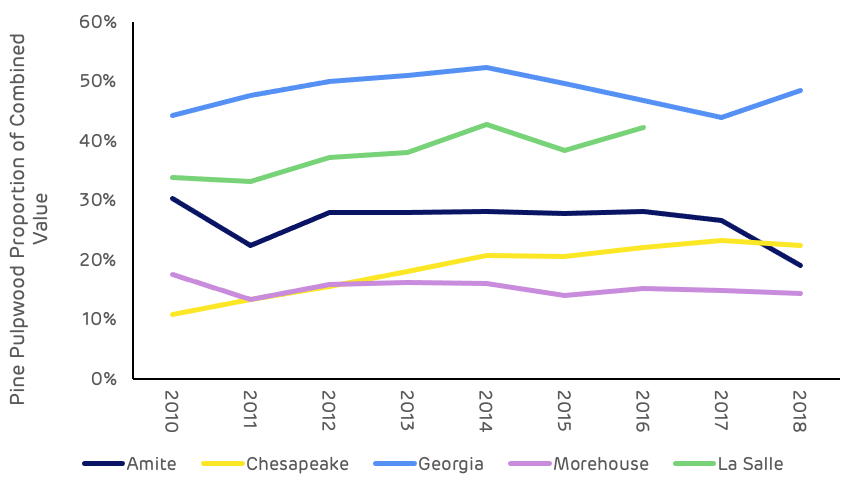
Figure 10: Weighted average pine pulpwood value as proportion of total pine revenue (TMS)
The much higher relative value of pulpwood in Georgia and La Salle can be an indicator of a higher proportion of pulpwood produced from harvesting (La Salle) in addition to a higher stumpage value (Georgia); a higher volume can indicate a higher proportion of thinning or a lower quality or younger crop at clear cut.
Figure 11 below shows the proportion of thinning of the total harvest by volume for each area. Thinning in Georgia has been declining as the forest matures and as sawtimber production increased, producing a larger quantity of mill residual to satisfy demand from pulp and paper markets.
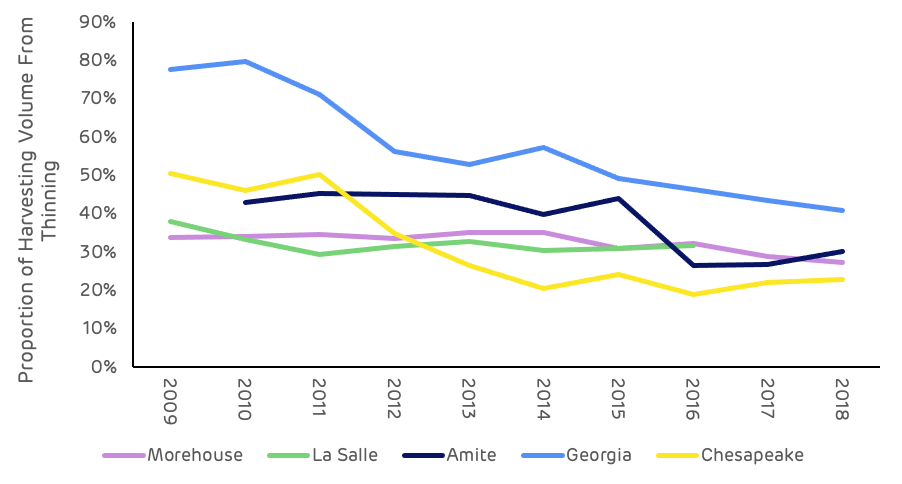
Figure 11: Thinning volume as a proportion of total harvest (TMS)
The volume at La Salle has remained relatively stable. The higher relative value is likely due to increased stumpage prices in 2016 coupled with a strong demand for thinnings. Most of the markets show a declining trend in thinning volume, indicating a maturing forest resource which is consistent with the inventory data showing increasing volume and larger, older, trees.
Chapter 5:
Summary
The primary purpose of this research and analysis is to understand the trends and dynamics that are occurring within the forest and the forest industry across Drax’s supply chain. The reports set a benchmark for key criteria that can be monitored over the long-term, to understand the impact or influence that markets are having at a forest level. Whilst analysis is limited by data availability and accuracy, this research is based on the best available data at the time of writing, predominantly the US Forest Service Forest Inventory and Analysis (FIA) database and Timber Mart South (TMS) price data.
The evidence of the data collected so far shows that the forest area is stable; growth rates and the accumulation of carbon in the forest is increasing substantially. And despite some increase in demand and removals, surplus of annual growth has remained stable and sustainable. There is no evidence of market displacement as a result of wood pellet demand and wood prices are impacted by a variety of factors not directly related to the biomass or wood pellet sector.
We will continue to invest in research and analysis to monitor these metrics and trends, and ensure that the biomass supply chains providing wood pellets to Drax are having a positive impact on the forest landscape and contributing to climate change mitigation.
This is part of a series of catchment area analyses around the forest biomass pellet plants supplying Drax Power Station with renewable fuel. Others in the series can be found here.
- 1 Assuming all pellet furnish is pine pulpwood, based on latest available data year.
- 2 Blue over Green? Defining Typologies of Rural Landowners Growing Blueberry in Place of Forests in Georgia, United States. Suraj Upadhaya & Puneet Dwivedi. 2019.
- 3 Note: La Salle data for 2018 assumed to be at 2016 level (latest available data year at time of writing)