


Latvia is a heavily forested small country (about half the size of England), with 52% forest cover totalling 3.54 million ha (2.7 times bigger than the forest area in England and 11% bigger than the entire UK).
In its catchment area analysis report of the Baltic country, consultancy Indufor found:
- Best management practice is driven by the State-owned sector with an increasing proportion of corporate owners improving management standards in the private sector
- Markets are dominated by domestic saw-timber demand and pulpwood exports to neighbouring Scandinavia
- Fuelwood, pellets and biomass are substantial and critical markets for low-grade fibre
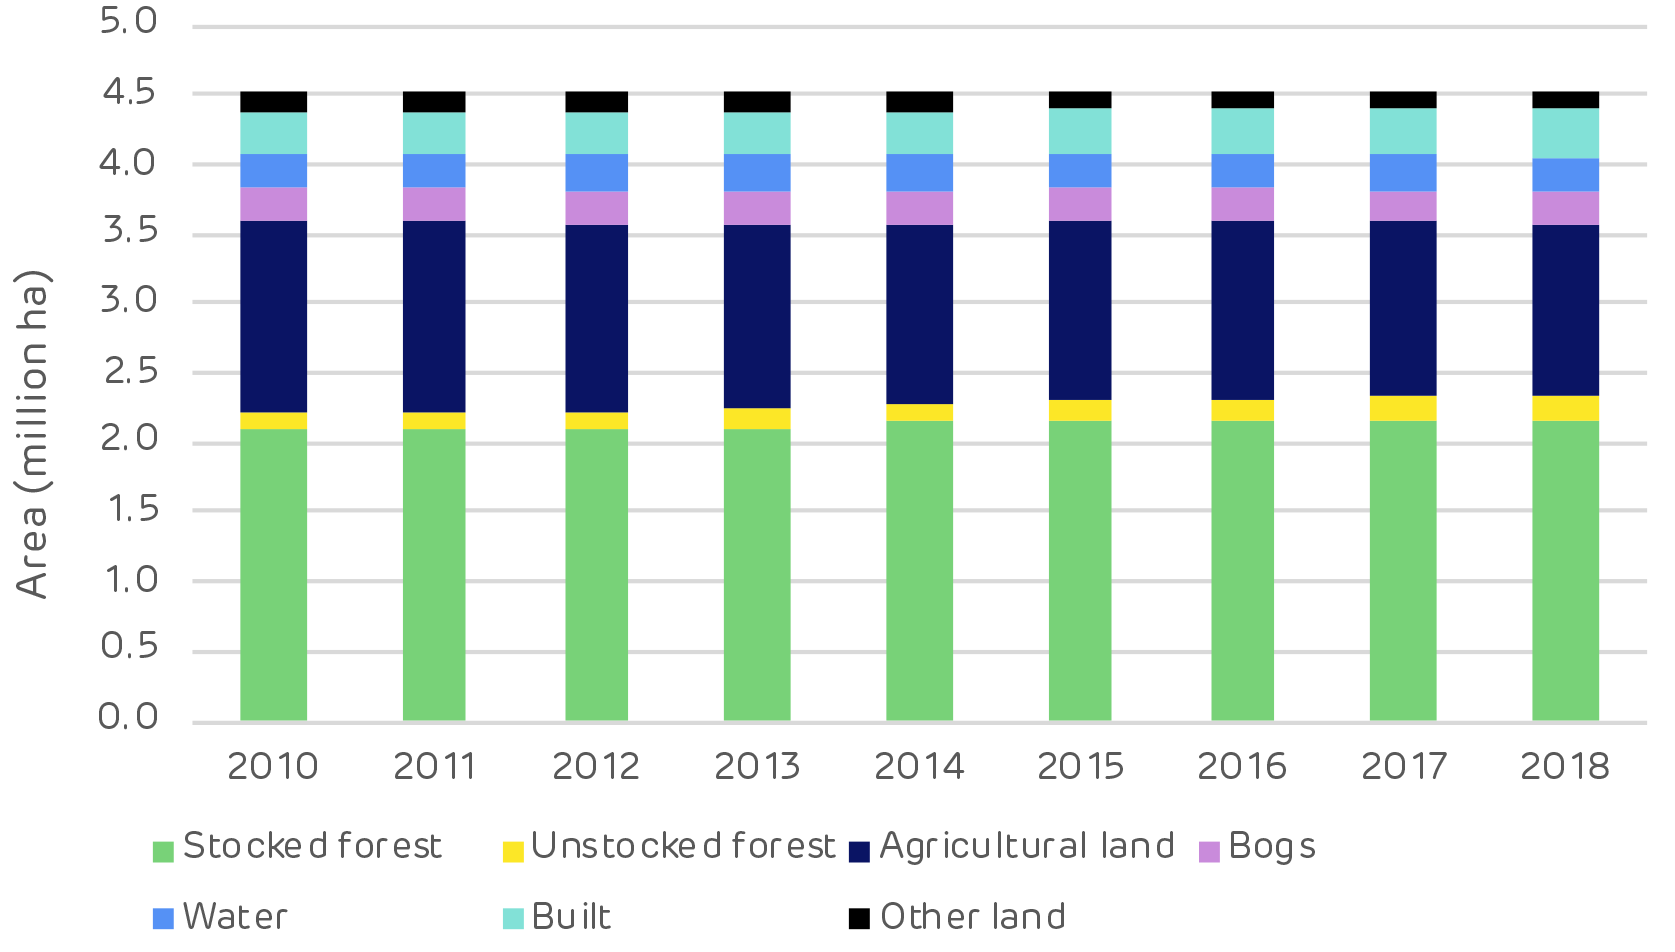
Increasing forest area, carbon stored and no deforestation
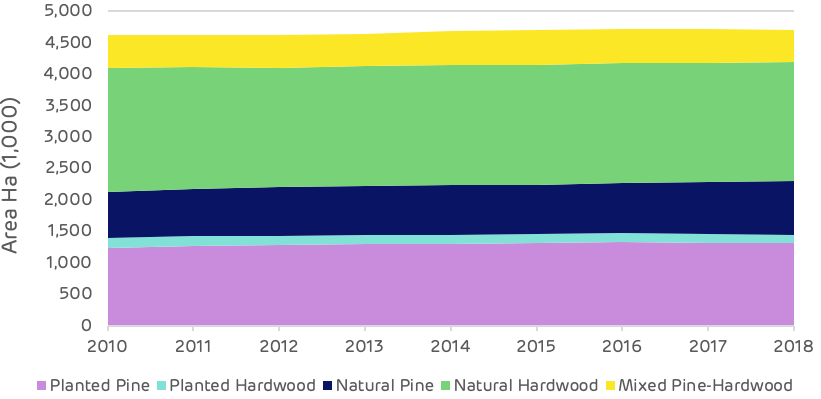
There has been an increase of around 400,000 hectares (ha) of forest in Latvia since 2000. This is due to natural afforestation of abandoned agricultural lands and also to an improvement in forest inventory analysis in 2009 which provided a more accurate assessment of land use and forestry data. Since 2010, the forest area has increased by 55,000 ha. There is no evidence of deforestation.
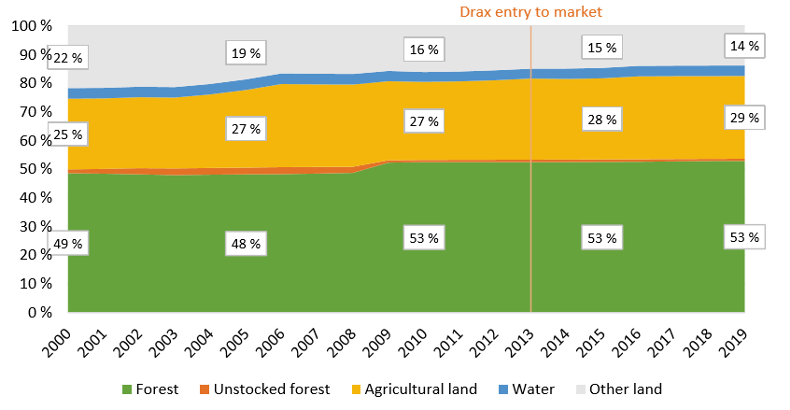
Primary land use Latvia
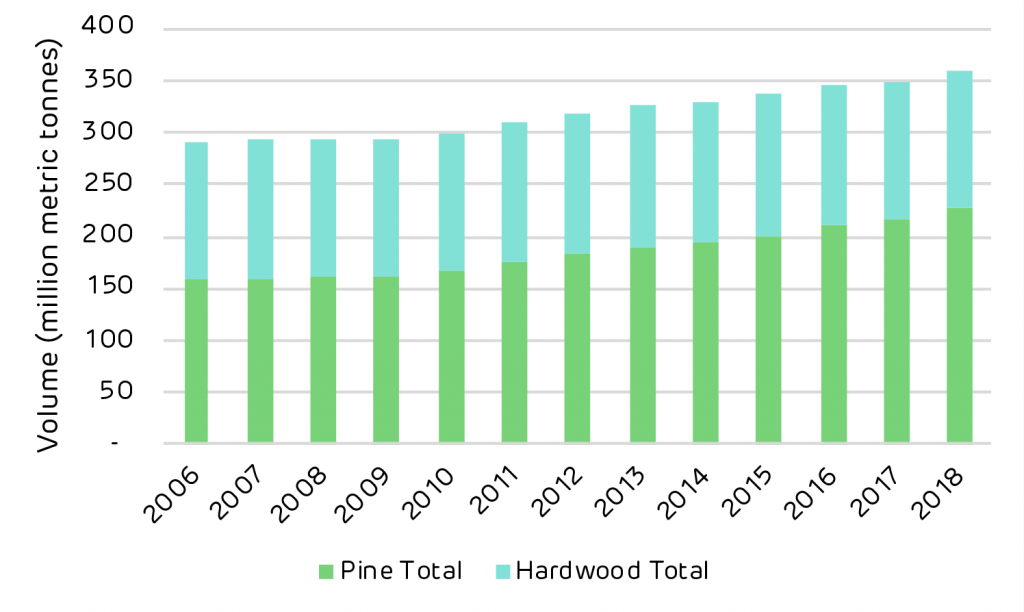
There has also been a substantial increase in forest carbon or growing stock. This increased by 106 million cubic metres (m3) since 2000 (75% hardwood) and by 33 million m3 since 2010 (57% hardwood).
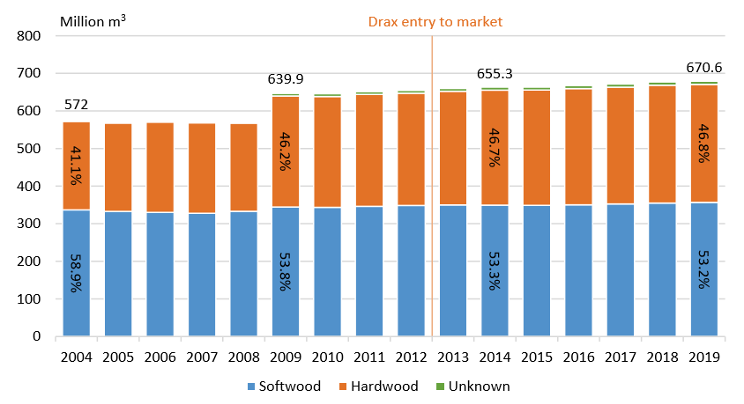
Increase in forest carbon
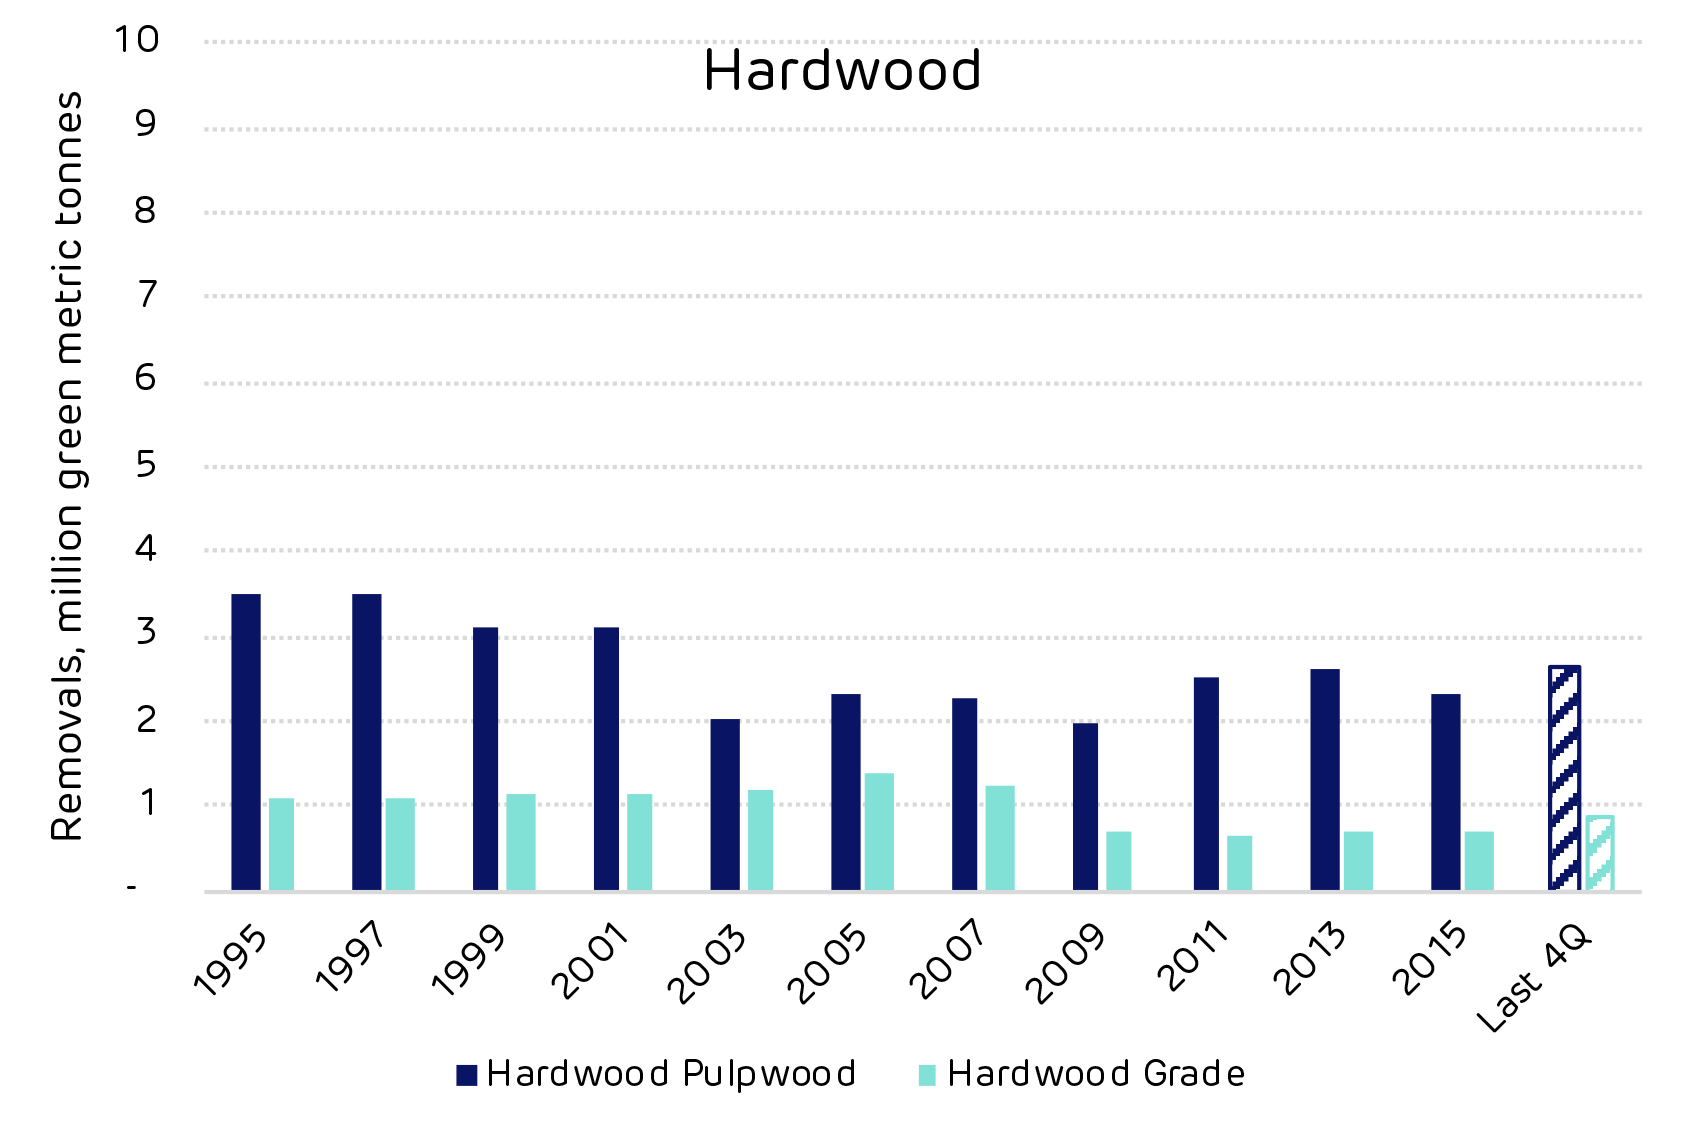
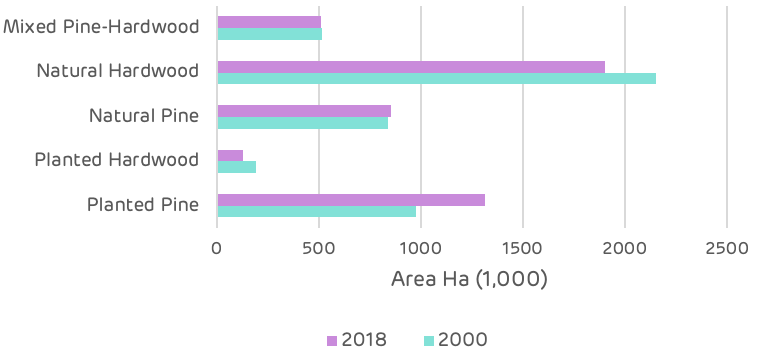
Limited hardwood markets
A proportion of the increase in hardwood volume in 2009 was due to the improvement of forest inventory calculations but also due to increased natural regeneration on unutilised land. The hardwood forest in Latvia and the Baltic region is quite different to that of the US South. In the Baltics there is prolific hardwood regeneration (birch, alder and aspen) which grows quite rapidly.
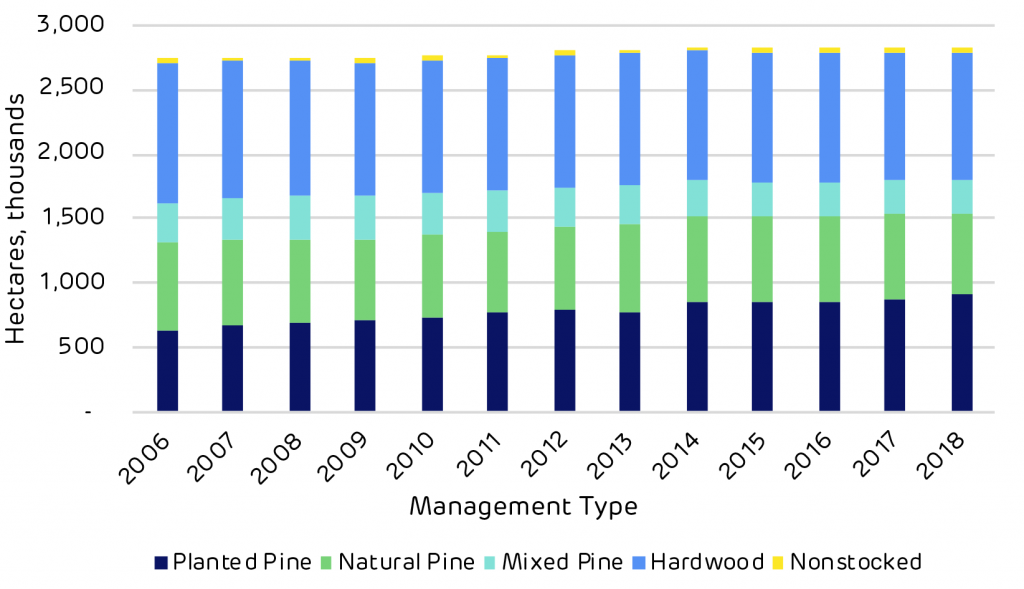
There are limited markets for structural timber, therefore hardwoods produce a lot of low-grade wood fibre. There are no domestic pulp markets in Latvia and only limited markets for panel board. Therefore, much of the low-grade wood fibre can only be used for firewood and biomass. The chart below shows a minor change in species composition from planted pine to naturally regenerated spruce and aspen – the most prolific regenerators in this region.
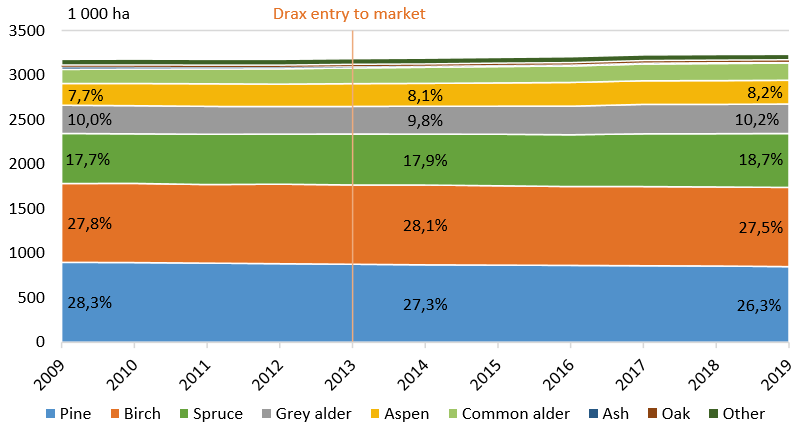
Varied species mix
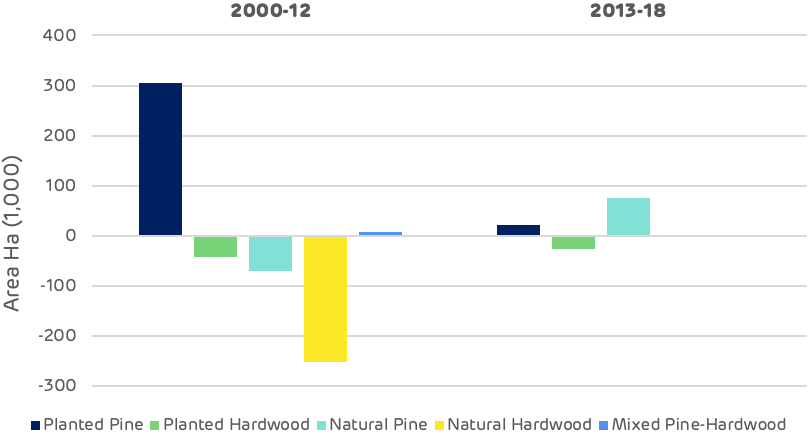
Planting and regeneration
State owned forests have a higher proportion of planted forest areas compared to the private sector where natural regeneration is preferred due to lower costs. Planting allows the owner to control the species mix, quality and growth. Whereas regeneration can be more of a lottery for both quality and species mix. As more corporate owners emerge, planting with improved stock may increase.
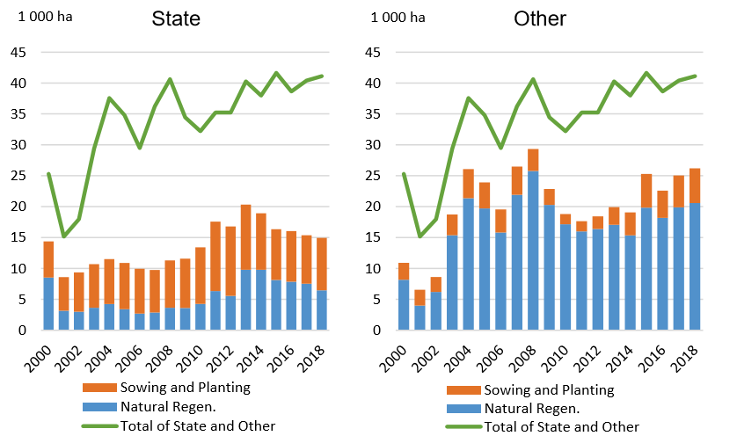
Restocking practice by ownership category
How the financial crisis impacted Latvian forests
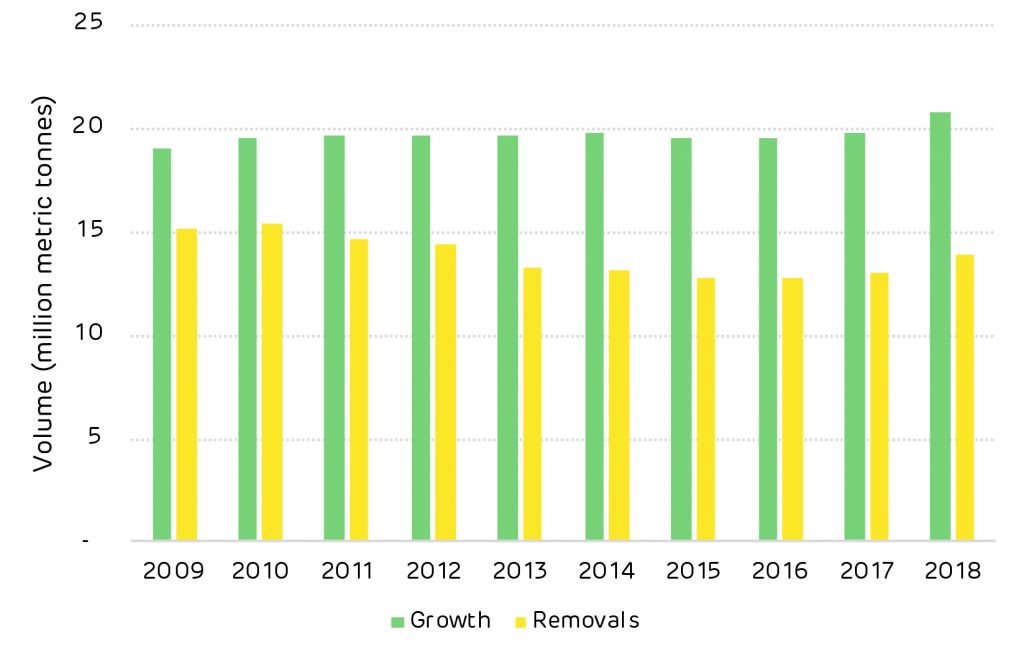
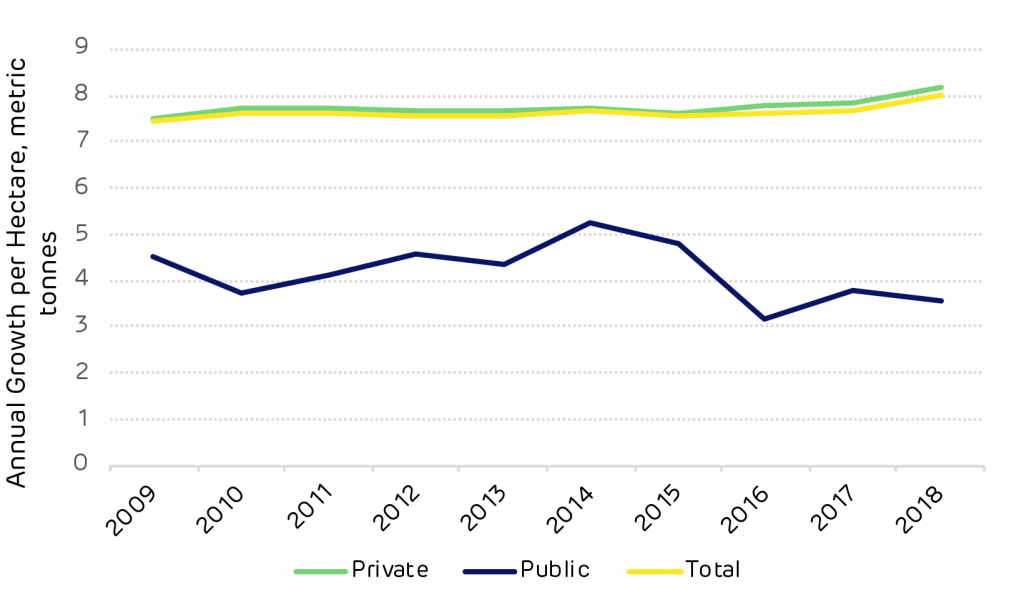
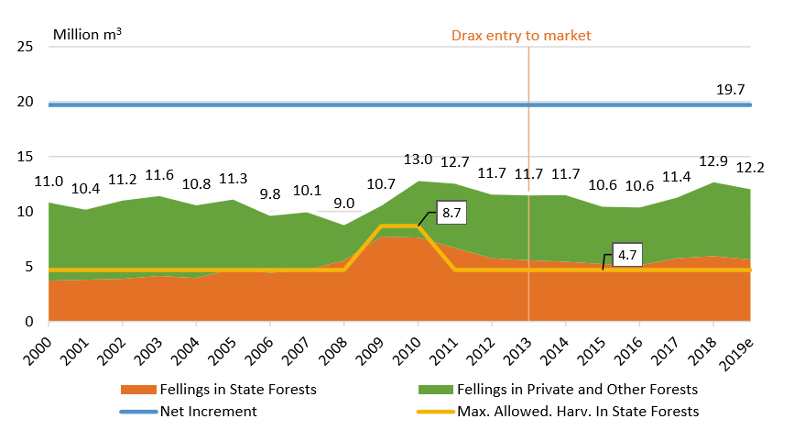
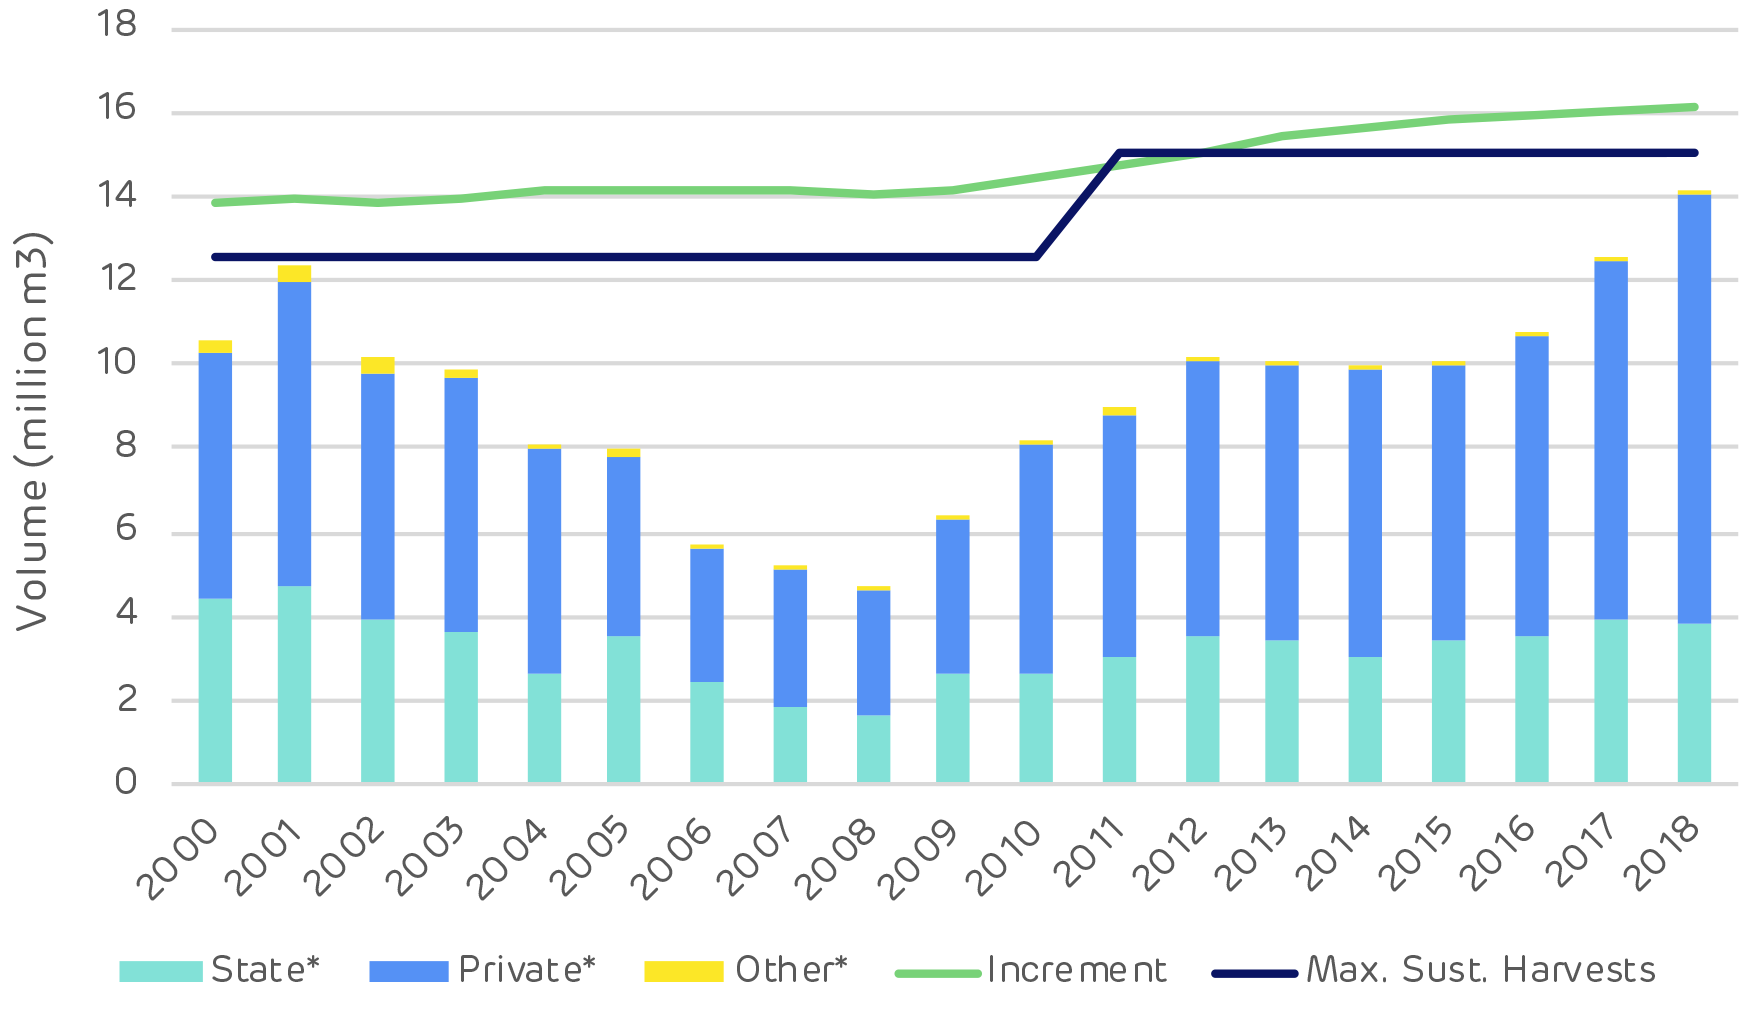
Harvesting levels have been consistently below net annual increment since 2000. There have been some fluctuations in the annual allowable cut in State forests, particularly following the global financial crisis in 2008.
Harvesting in the private sector declined due to falling prices and sawnwood production dropped by 42% in 2009 compared to 2006. During that period, State-owned forest increased harvesting in order to support the industry in the absence of strong markets and private sector supply.
Post-recession, the harvesting balance returned and demand for wood products increased. The current surplus of growth compared to removals is around 5.5 million m3 p.a. or a growth drain ratio of 1.6.
Surplus of growth compared to removals
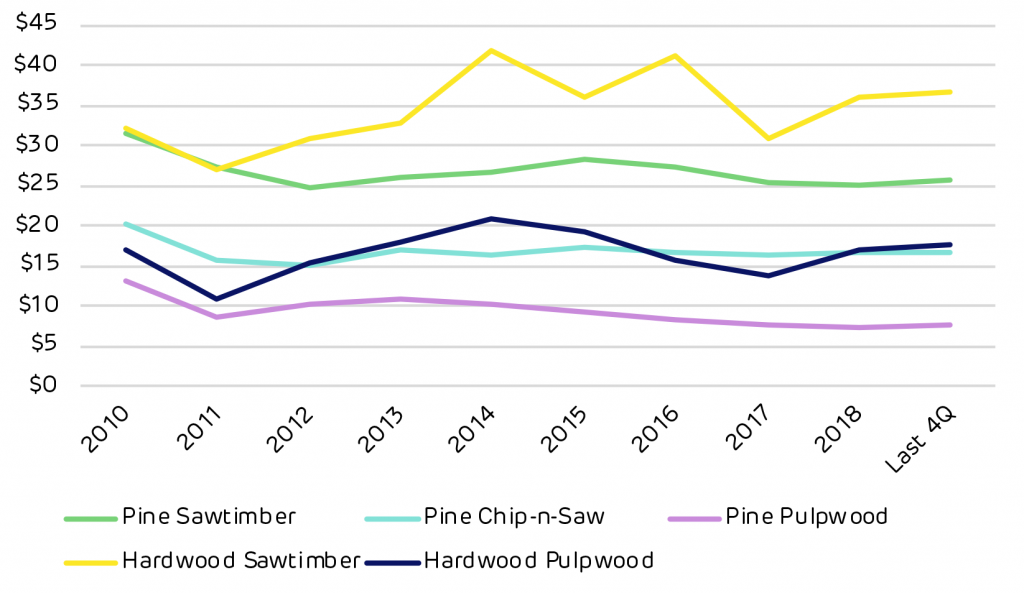
Biomass and pulp prices
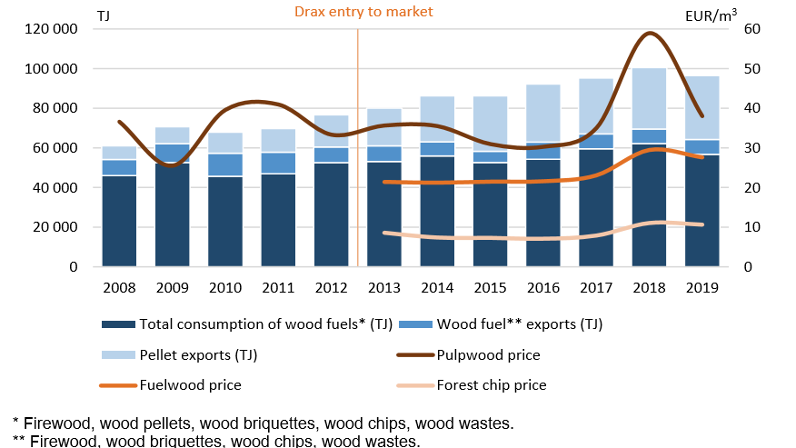
Increasing wood pellet exports have had limited impact on wood prices. The feedstock for this market (fuelwood & forest chip) has limited competition and therefore remains fairly stable.
Pulpwood markets are driven by export demand to Scandinavia and can be volatile as this market fluctuates. 2018 saw a substantial spike in pulpwood prices due to increased export demand as a response to a global increase in pulp and paper prices boosting Scandinavian production. This had a minor knock on effect on the domestic fuelwood markets.
Variation of low-grade wood prices with changing demand
An important part of this analysis is to look for evidence to evaluate Drax’s performance against its new forest commitments, some of which relate directly to these trends and data sets.
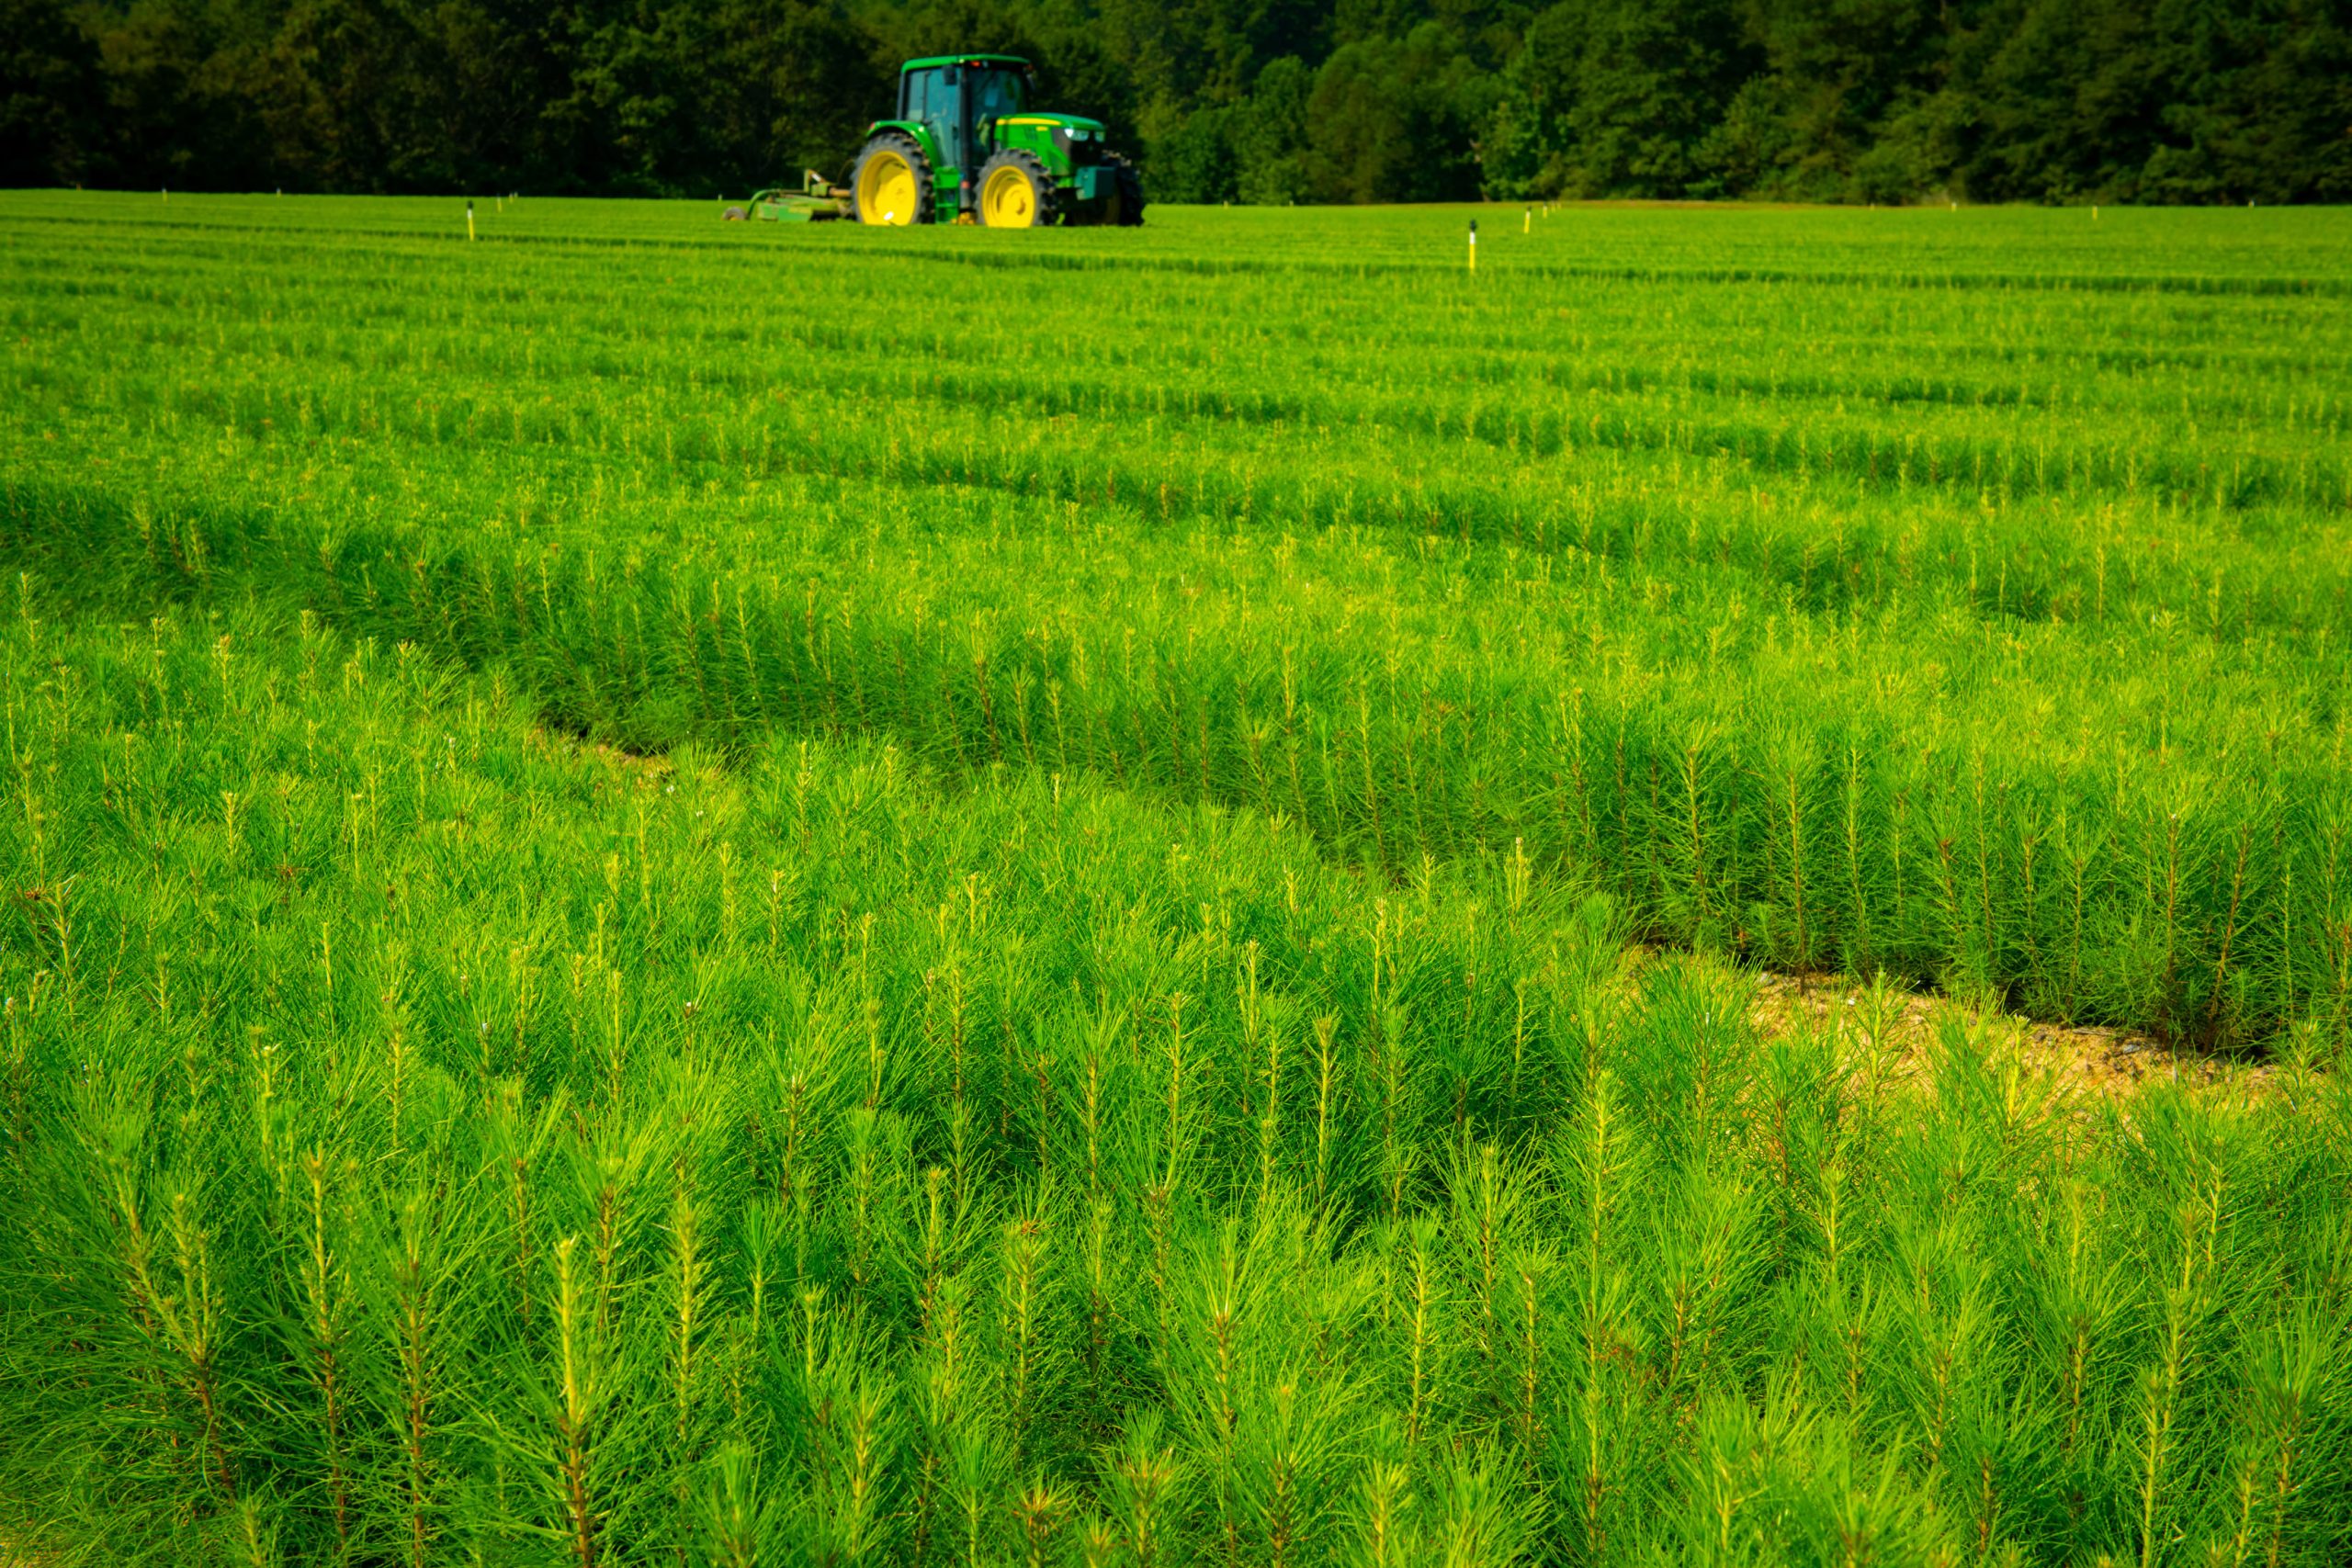
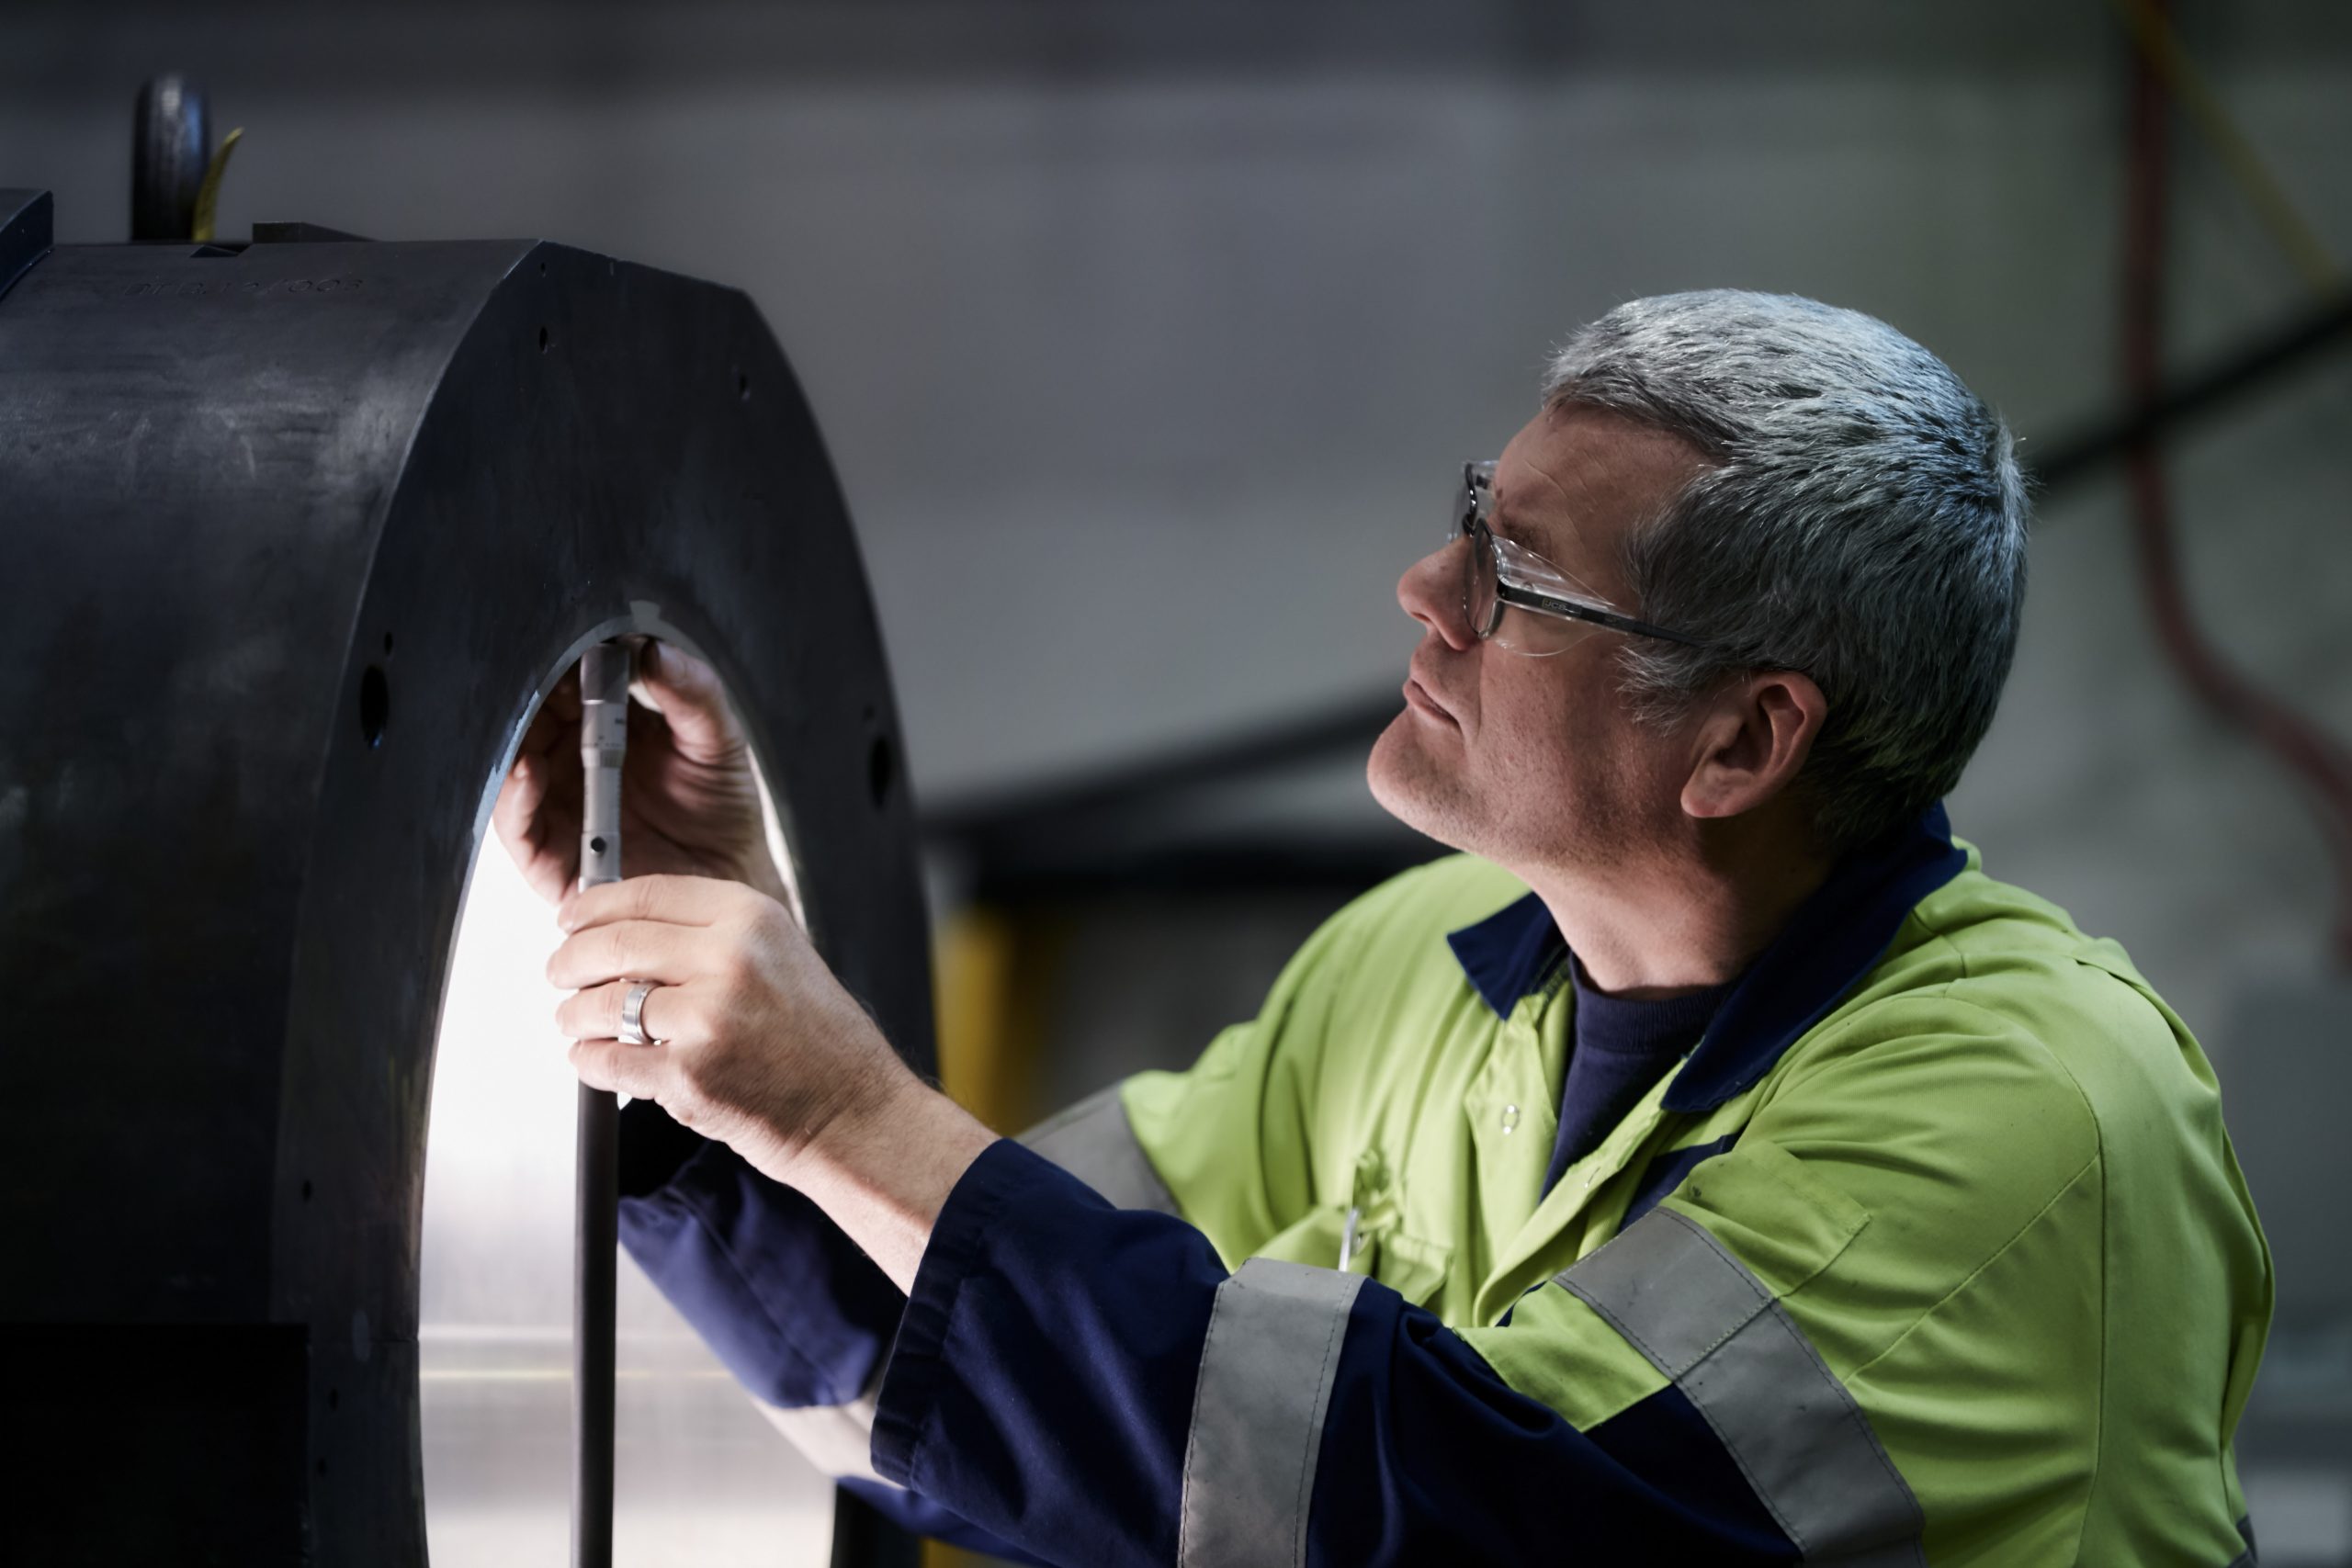
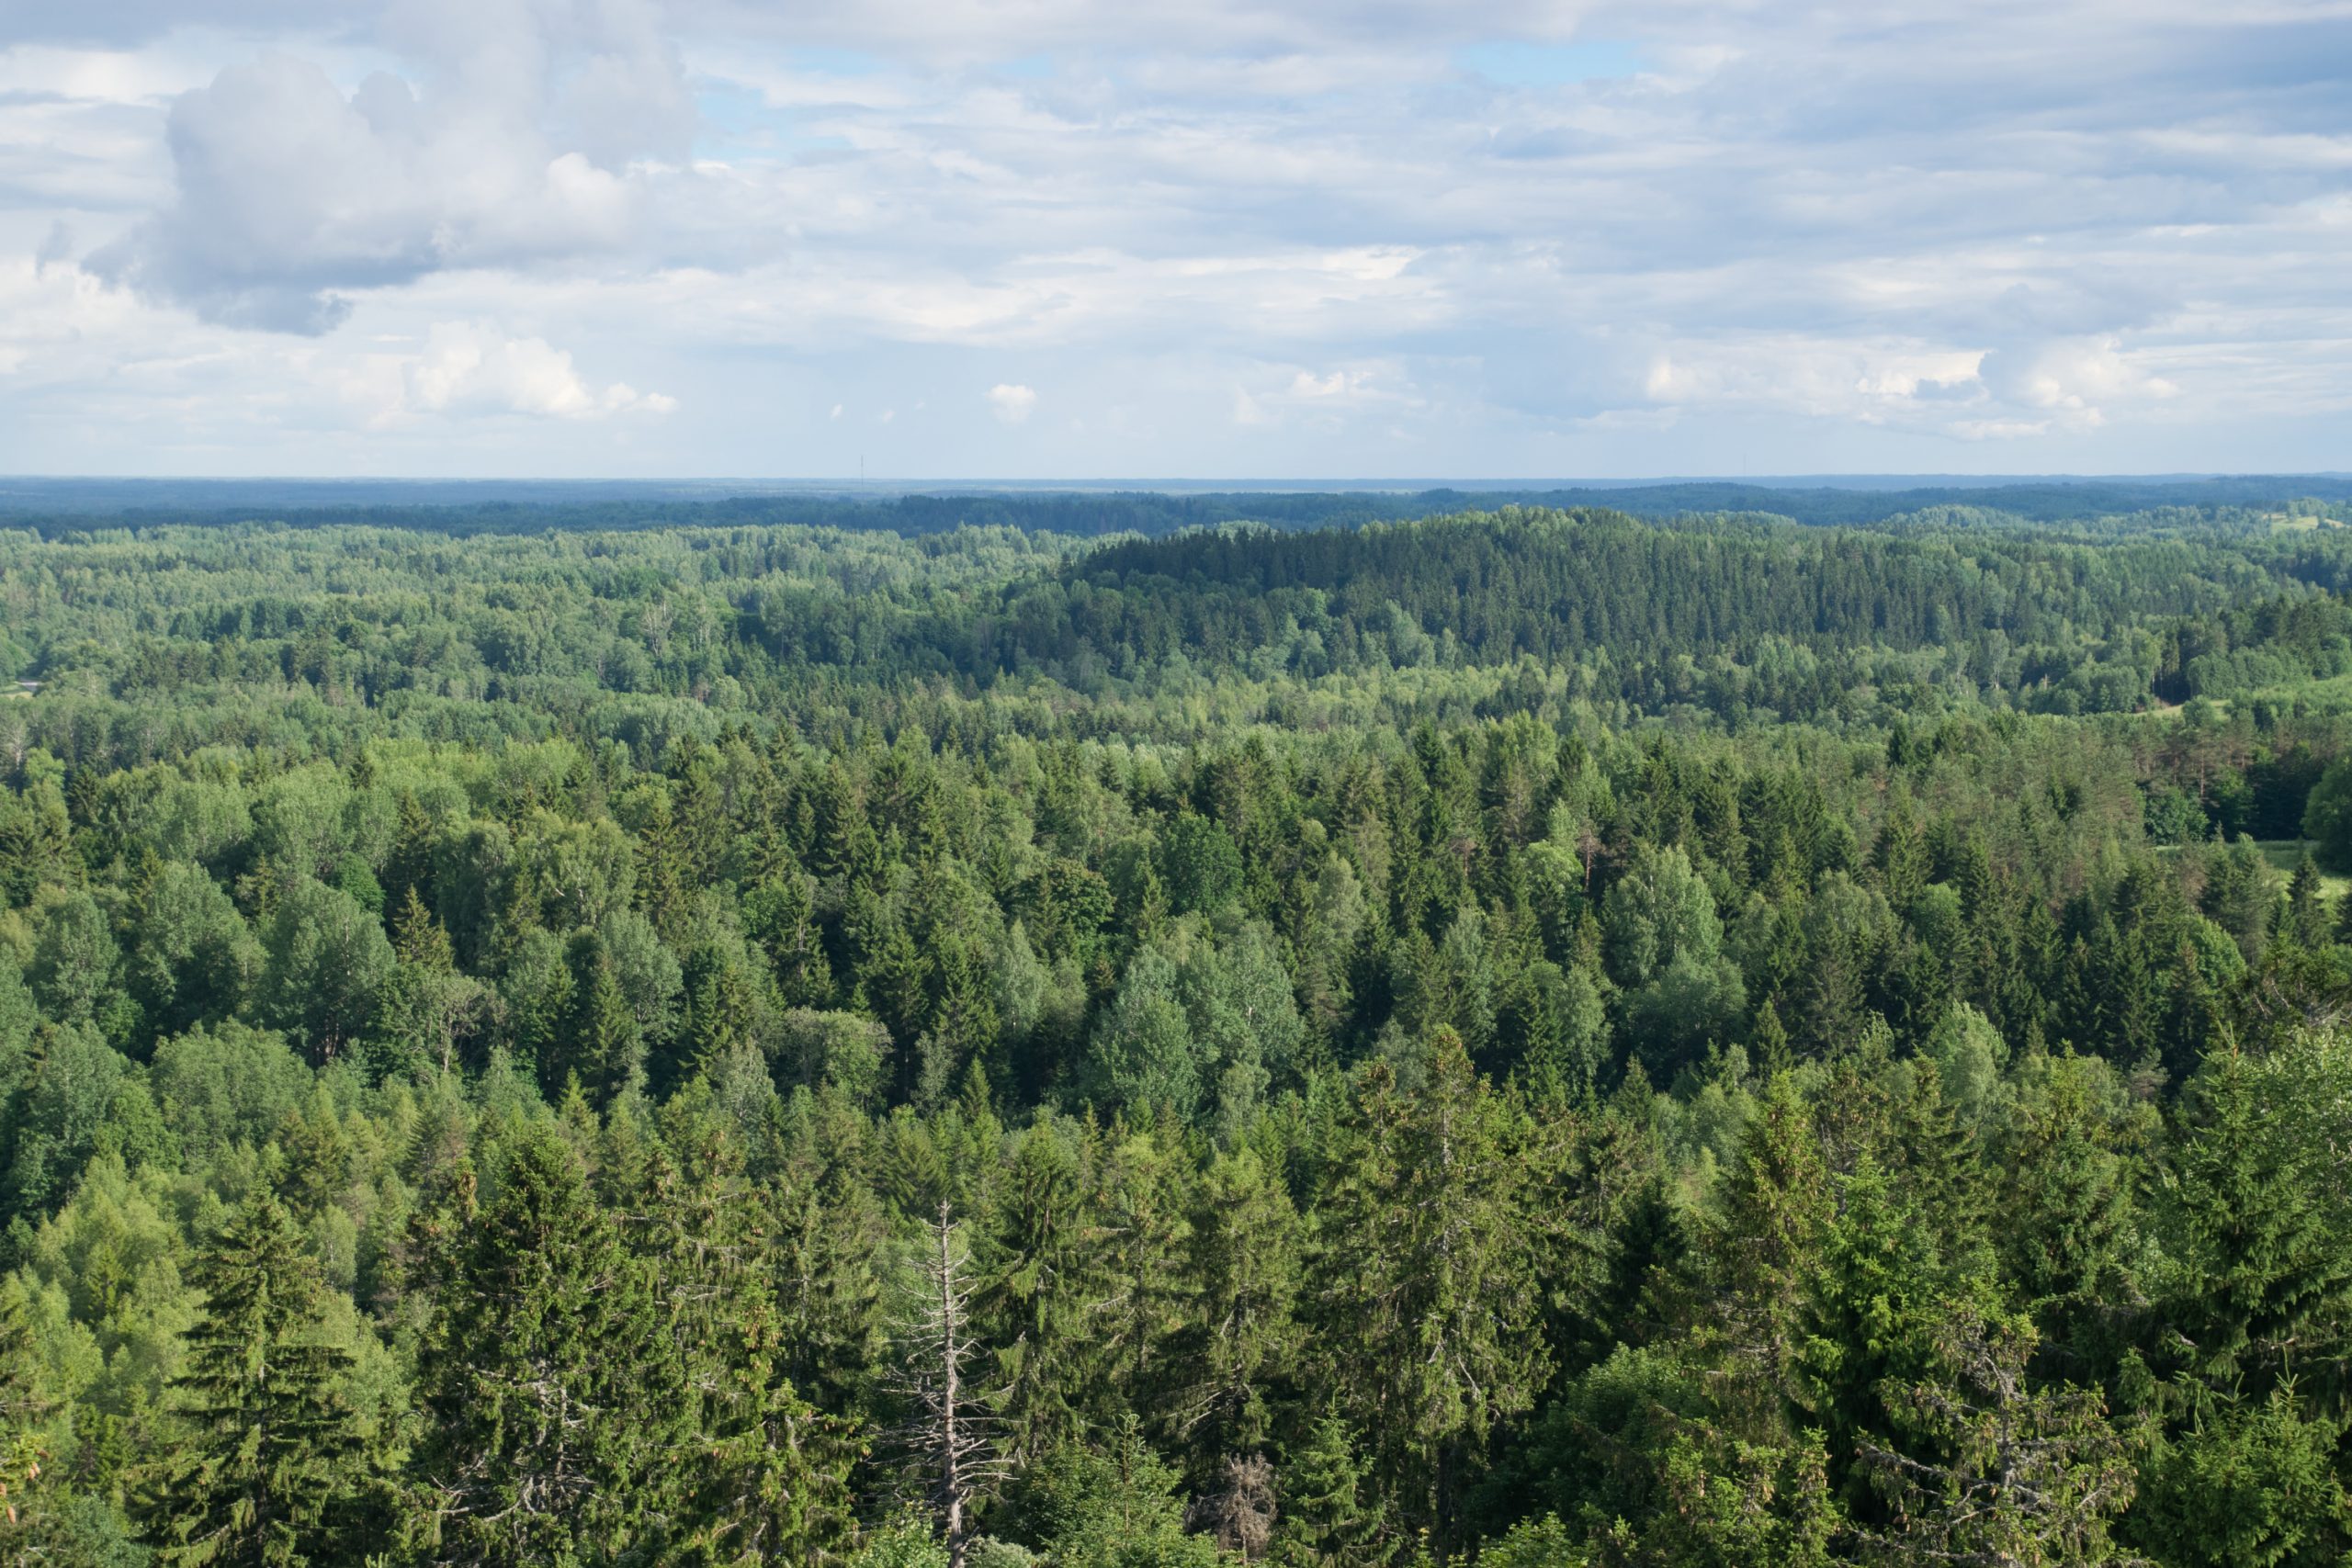
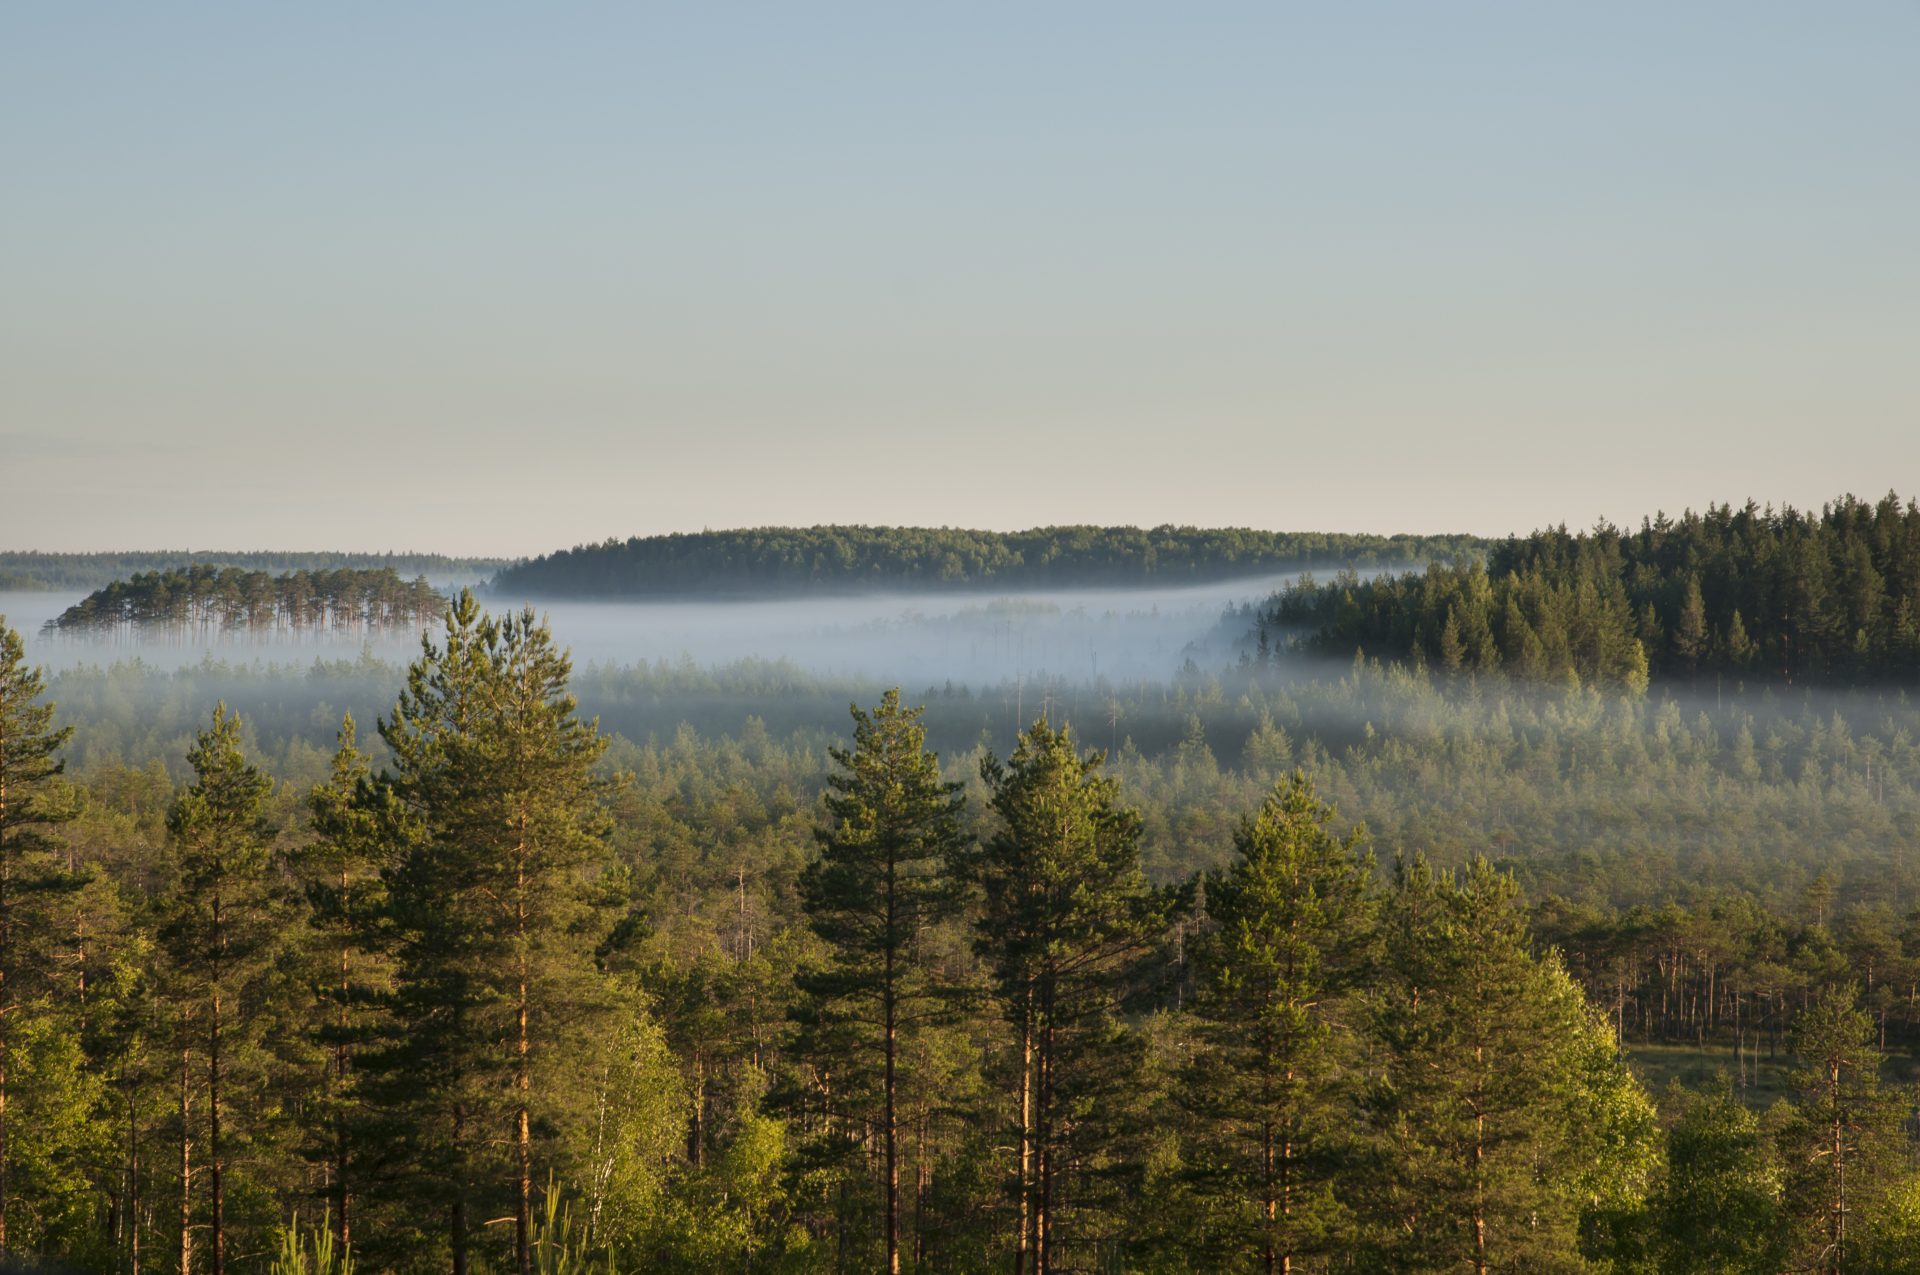
Pine forest in Latvia
Below, the consultant summarises the evidence of biomass impacts against key metrics in the forest industry of Latvia.
Is there any evidence that wood-based bioenergy demand has caused changes in …
Forest area / forest cover
No impact. Both forest area and forest cover have increased during the last two decades. The main driver of the growing forest area has been the natural regeneration of agricultural lands that were left uncultivated during the Soviet regime.
Forest growing stock
No impact. Forest growing stock has steadily increased throughout the observation period.
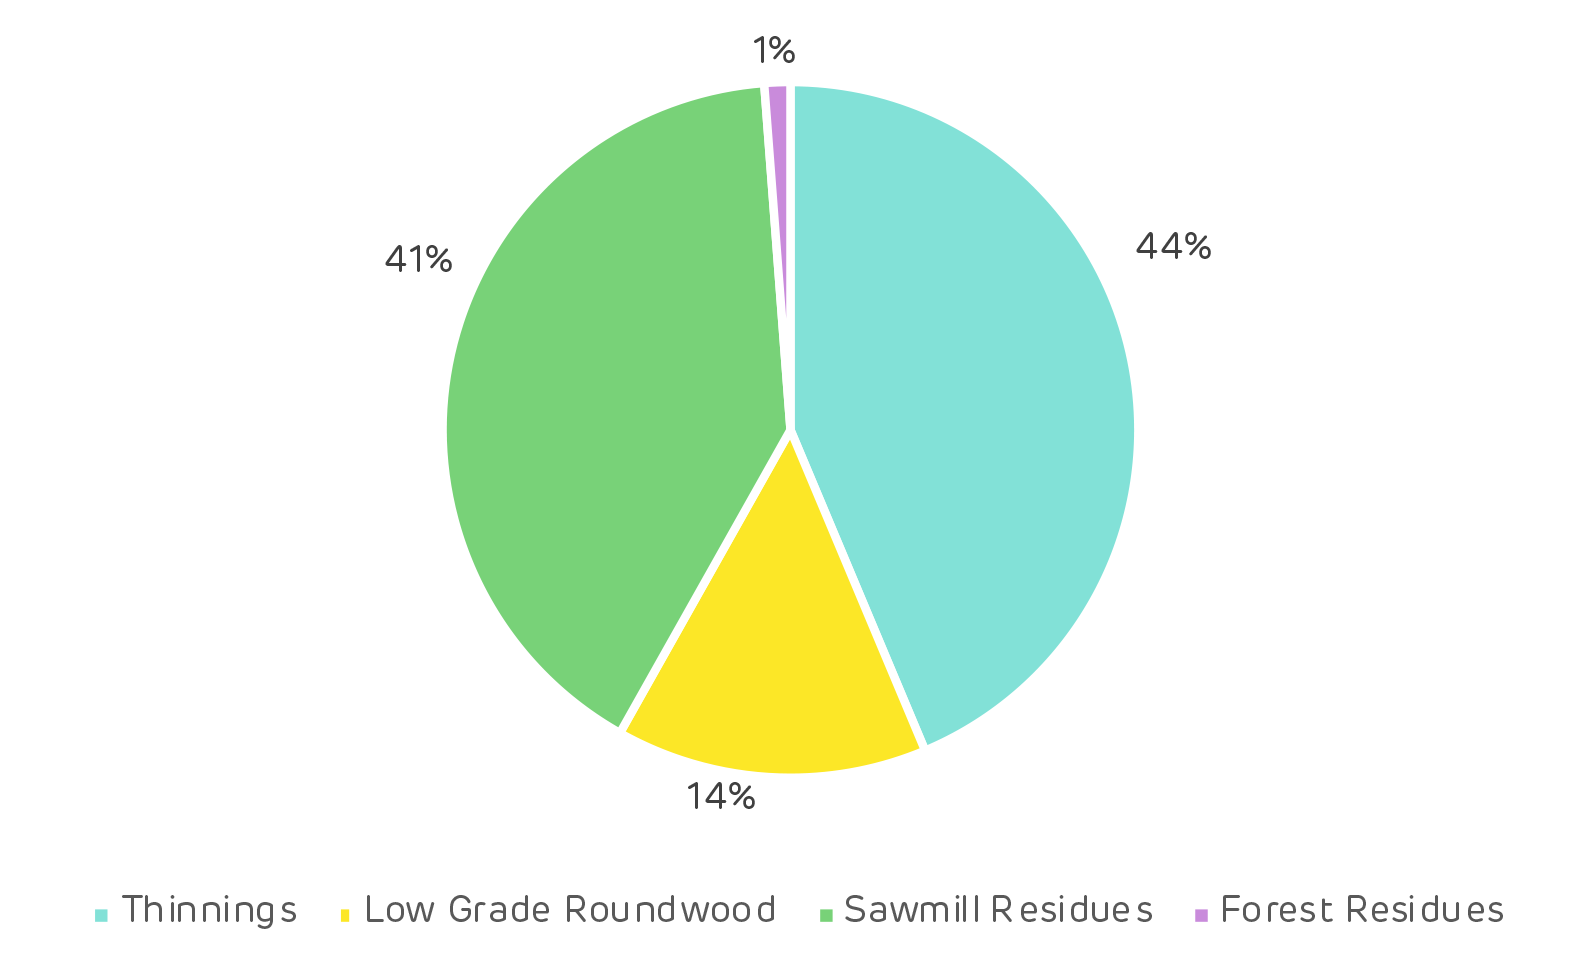
The main driver for harvesting level is the roundwood demand from sawmills, panel mills and export. Wood-based bioenergy demand may increase thinnings and residue collection, but it is not as significant a driver for total harvests as the aforementioned. Exported pellets have accounted for approximately 10-14% of the total volume of annual harvests in recent years, depending on the assumed average dry densities of the harvested wood and pellets.
Harvesting levels
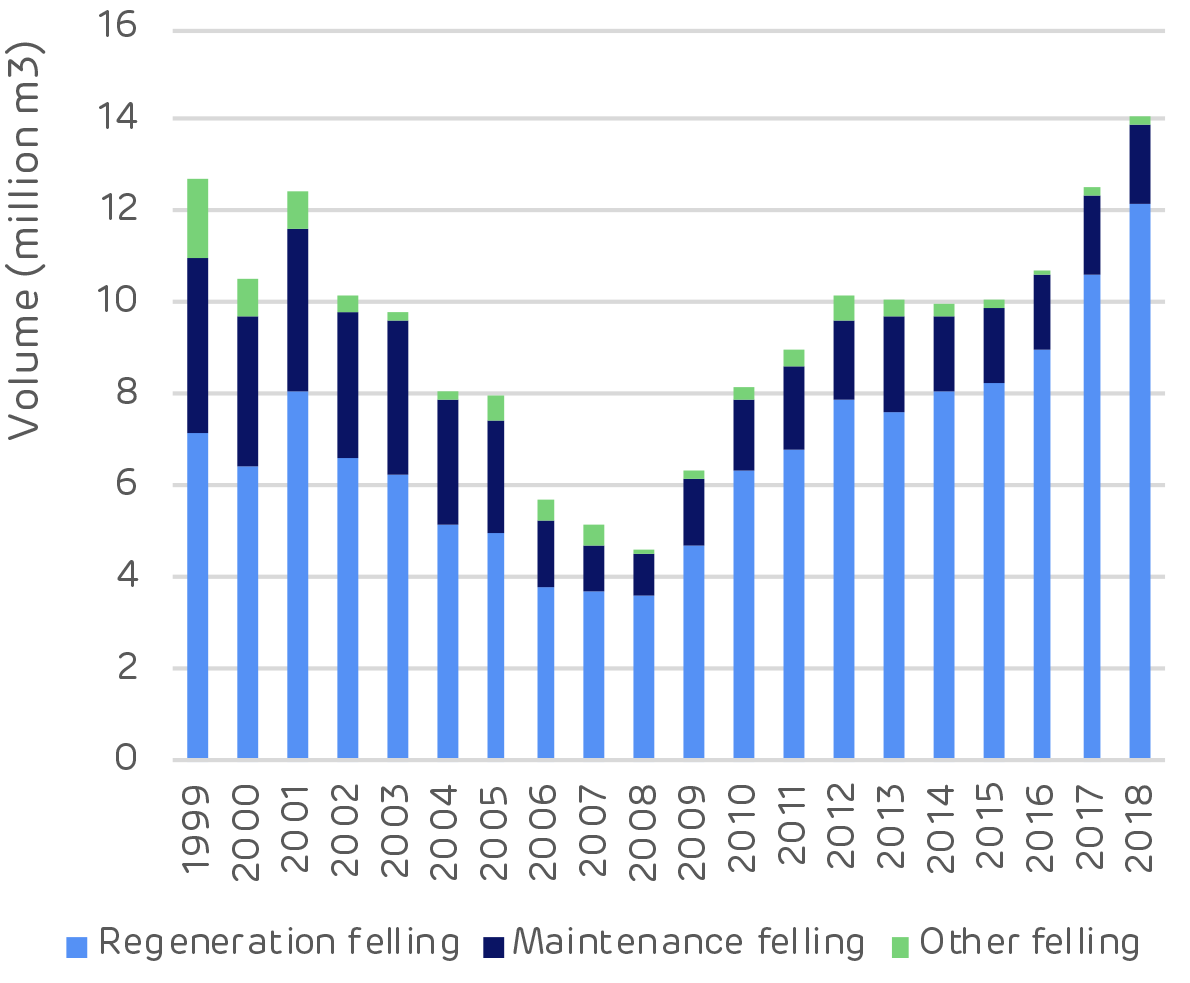
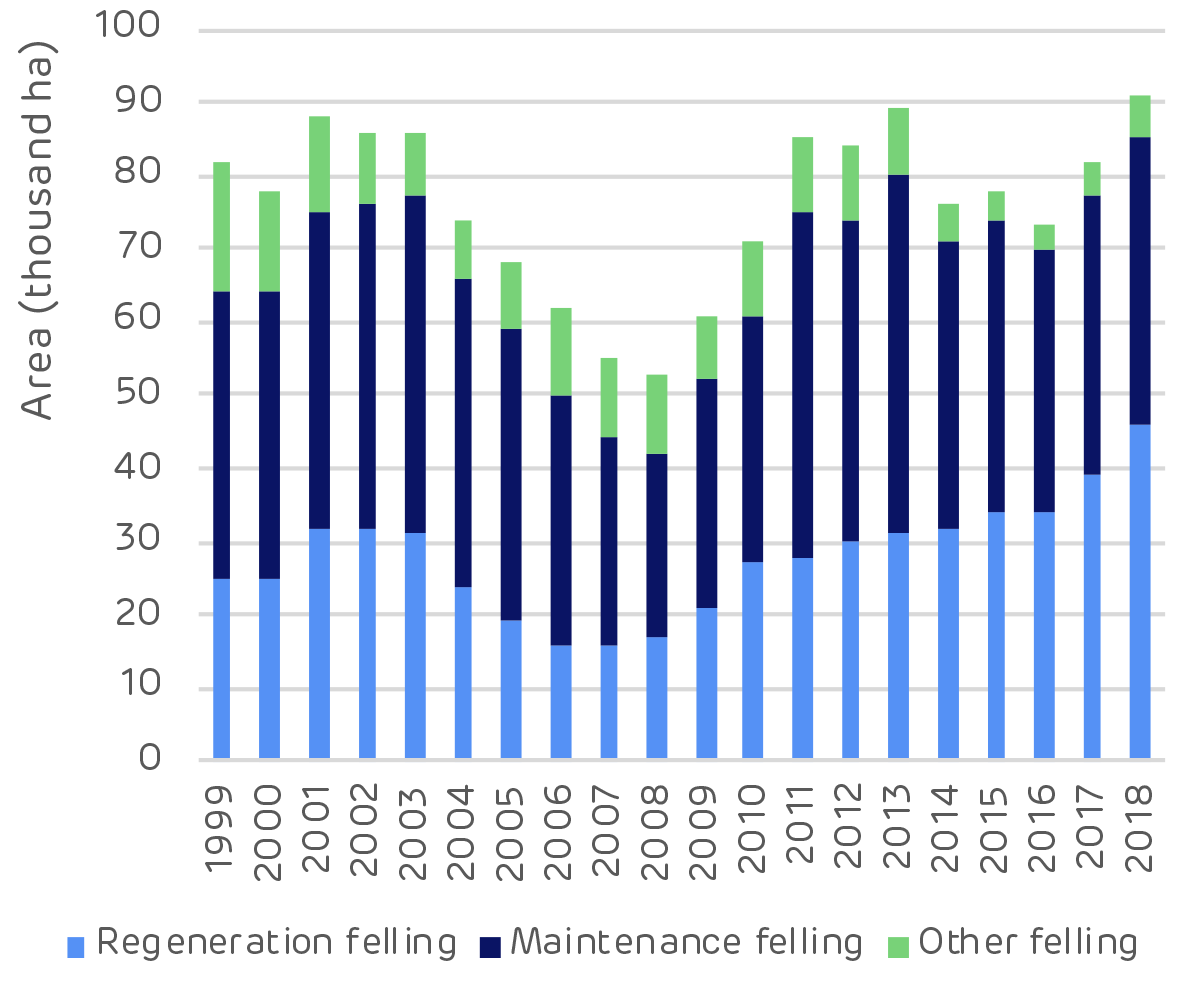
No impact / slight increasing impact. The national felling volume is only about 65% of the national forest increment. The total harvesting area has been declining, while the total harvested volume has increased in the past 20 years. This can be explained by the diminished share of thinnings and increased share of clear-cuts. A decline in both area and volume of fellings can be seen between 2002–2008 and 2010–2016.
The main drivers of harvesting levels are sawmill industry, panel industry and export demand. However, wood demand for energy purposes can still improve the overall income for the forest owner and therefore increase the total harvesting levels in private forests
Harvesting residue collection
Increasing impact. Most of the collected residues originate from clear-cuts in state forests. Most produced harvesting residues are left in situ, and they are not over-exploited.
Collection of wood residues from harvesting operations has been increasing for the last 15 years as a result of increased capacities and demand from heat and CHP plants. Latvia is increasingly relying on woody biomass for energy generation.
Forest growth / carbon sequestration potential
No apparent impact. The total forest area and growing stock have grown in the last decade.
According to Latvia’s National Forestry Accounting Plan 2021–2025, the forests are decreasing their GHG sequestration capacity. Even a low sequestration rate increases carbon storage, which explains the increases in forest growing stock and area. The decrease in GHG sequestration capacity is due to forest ageing, emissions from soils and the increased share of broadleaved forests, which have lower carbon accumulation capacity than conifers.
Removal of harvesting residues decreases carbon sequestration since the residues are an input to the soil carbon pool. However, the majority of the harvesting residues’ carbon is released to the atmosphere when the biomass decays, so the ultimate impact of harvesting residue collection is minimal if the collection is done on a sustainable level. The sustainability of the collection is determined by how the soil nutrient balance is impacted by collection. This is not accounting for the substitution effect that the harvesting residues may have, by, e.g. reducing the need to burn fossil fuels.
Is there any evidence that wood-based bioenergy demand has caused changes to forest management practices …
Rotation lengths
No impact. The Law on Forests regulates minimum forest age and diameter for clear-cuts. The LVM and large-scale forest owners often conduct clear-cuts at minimum diameter, whereas smallholders tend to wait until roundwood prices are high. Due to the regulation, an increase of wood-based bioenergy demand has not shortened rotations.
Thinnings
Increasing impact in naturally afforested former agricultural lands. No impacts on thinnings overall. The total harvested area has been declining, while the total harvested volume has increased in the past 20 years. This can be explained by the diminished share of thinnings, due to existing forest age structure, and increased share of clear-cuts. Most of the harvesting residues are collected from clear-cuts.
There is an increased demand for small diameter wood and harvesting/processing residues overall.
The increased demand for small-diameter hardwood has increased harvesting in previously unmanaged afforested agricultural lands, which usually overgrow with broadleaved trees. These kinds of lands are usually otherwise not significant for forest management.
Conversion from hardwood to softwood
No impact. No indication of hardwood conversion to softwood was found. Instead, pine forests are decreasing due to the favouring of natural regeneration, which usually results in spruce or broadleaved forests in nutrient-rich and/or wet soils.
Is there any evidence that wood-based bioenergy demand has impacted solid wood products markets …
Diversion from other wood product markets
No apparent impact. Production of sawnwood and wood-based panels have increased or remained steady, i.e. no evidence of diversion.
Several interviews confirmed that sawlogs are not processed for other products besides sawnwood and wood-based panels.
Wood prices
No apparent impact. Prices of all wood assortments increased in 2017–2018, most notably the prices of pulpwood. This was due to difficult harvesting conditions and increased demand for pulpwood in Finland and Sweden, because of high market pulp prices. Pulpwood prices returned to pre-surge levels in 2019. Fuelwood prices also increased temporarily, but at a much more moderate rate. The main driver for fuelwood price increases was the surge of pulpwood prices.


![Reforestation in Estonia. * Note: Since 2014 it has not been compulsory for private and other forest owners to submit reforestation data. [Click to view/download]](https://www.drax.com/uk/wp-content/uploads/sites/8/2020/03/figure_3.13.png)
![Species mix in Estonian forests [Click to view/download]](https://www.drax.com/uk/wp-content/uploads/sites/8/2020/03/figure_3.3.png)
![Comparison of sawlog and pulpwood prices [click to view/download]](https://www.drax.com/uk/wp-content/uploads/sites/8/2020/03/Picture-1.pdf2_-1.png)