Author: Alice Roberts

Drax Biomass seeks stakeholder evaluation of wood procurement

Drax Biomass Inc. (DBI) is committed to implementing and maintaining conformance with the Sustainable Biomass Program (SBP) and the Forest Stewardship Council® (FSC®). As part of that commitment, DBI is undertaking an evaluation concerning risks associated with the procurement of wood fibre. Part of this process is to solicit and address relevant stakeholder comments.

DBI is seeking comments from stakeholders addressing risks associated with the SBP Standard 1: Feedstock Compliance Standard principles. The stakeholder consultation is a requirement of recertification to the SBP Standard.

The Supply Base Evaluation (SBE) document can be accessed here.  Please be specific with feedback. Reference instances during forest management activities where concern for negative impact is relevant, cite sources and indicate the applicable region.

In addition, DBI will undergo regular sustainability systems surveillance external audits of existing facilities August through November 2020.

Comments can be submitted via email during the period spanning July 14th  through August 14th, 2020.

Plant more forests and better manage them

Working forests in the US South

There is an ongoing debate about forests’ contribution to fighting the climate crisis.

Forests can act as substantial and effective tools for carbon sequestration during a high growth phase. They can also function as significant and extensive carbon storage areas during maturity and throughout multiple stages of the age class cycle, if managed effectively at a landscape level. Or, they can be emitters of carbon if over-harvested, subject to fire, storm, pest or disease damage.
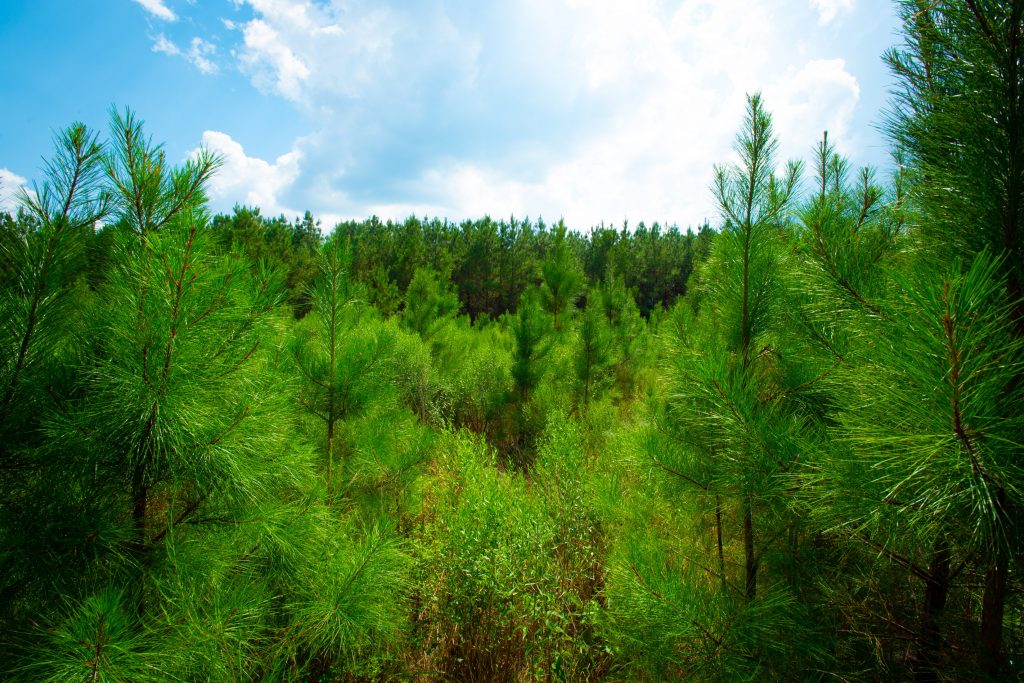
Different age class forest stands in Louisiana

In a natural state, forests will go through each of these life phases: rapid early growth; maturity and senescence; damage, decay and destruction through natural causes. Then they begin the cycle again, absorbing and then emitting carbon dioxide (CO2) in a continual succession.

Recently, loud voices have argued against forest management per se; against harvesting for wood products in particular, suggesting that this reduces both forest carbon stocks and sequestration capacity.
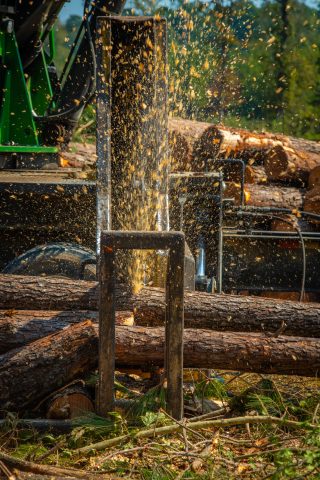
Pine cut in into wood for different wood products markets in Louisiana. Big, thick, straight higher value sections go to sawmills and smaller and misshapen low-grade wood not suitable for timber production is sold to pulp, paper or wood pellet mills.

Many foresters consider that this is just not correct. In fact, the opposite is true. Research and evidence clearly support the foresters’ view. Active forest management, when carried out appropriately, actually increases the amount of carbon sequestered, ensures that carbon is stored in solid wood products, and provides substantial savings of fossil fuels by displacing other high carbon materials (e.g. concrete, steel, brick, plastic and coal).

Oliver et al.(2014)[1] compared the impact of forest harvesting and the use of wood products to substitute other high-carbon materials, concluding that: ‘More CO2 can be sequestered synergistically in the products or wood energy and landscape together than in the unharvested landscape. Harvesting sustainably at an optimum stand age will sequester more carbon in the combined products, wood energy, and forest than harvesting sustainably at other ages.’

This research demonstrated that an increase in the use of structural timber to displace concrete and steel could lead to substantial emissions savings compared to unharvested forest. The use of wood for energy is an essential component of this displacement process, although it is important to use appropriate feedstocks. Burning wood that could be used for structural timber will not lead to a positive climate impact.

The message here is to manage working forests for optimum sawlog production for long-life solid wood products and utilise the by-products for energy where this is the most viable market, this provides the best all-round climate benefit.

What happens when you close the gate

Closing the forest gate and stopping all harvesting and management is one option being championed by some climate change campaigners. There is certainly a vital role for the preservation and protection of forests globally: primary and virgin forests, intact landscapes, high biodiversity and high conservation value areas all need to be protected.

That doesn’t necessarily mean that there is no forest management. It should mean careful and appropriate management to maintain and ensure the future of the resource. In these cases, management is with an objective to reduce the risk of fire, pests and disease, rather than for timber production.

Globally, we need better governance, understanding and implementation of best practice to achieve this. Forest certification and timber tracing systems are a good start. This can equally apply to the many hundreds of millions of hectares of ‘working forest’ that do not fall into the protection categories; forests that have been managed for many hundreds of years for timber production and other purposes. Harvesting in these forests can be more active, but governance, controls and the development of best practice are required. Better management not less management.

During the 1970s there was a significant change of policy in the US, aimed at removing massive areas of publicly owned forest from active management – effectively closing the gate. The drivers behind this policy were well meaning; it was intended to protect and preserve the habitat of endangered species, but the unintended consequences have also had a substantial impact. In the 1970s little thought was given to the carbon sequestration and storage potential of forests and climate change was not at the top of the agenda.

The west coast of the US was most substantially affected by these changes, more than in the US South, but the data below looks at the example of Mississippi which is primarily ‘working forest’ and 88% in private ownership.

Pine trees in Mississippi working forest

This is the location of Drax’s Amite pellet mill. The charts below show an interesting comparison of forest ownership in Mississippi where limited or no harvesting takes place and where active management for timber production occurs. In the short term the total volume of timber stored per hectare is higher where no harvesting occurs. This makes sense since the forest will keep growing until it reaches its climax point and succumbs to fire, pest or disease.

Average standing volume per unit area in the private sector, where active management occurs, is the lowest as timber is periodically removed for use in solid wood products. Remember that the Oliver et al. analysis (which does not include re-growth), showed that despite a short-term reduction in forest carbon, the total displacement of high-carbon materials with wood for structural timber and energy leads to a far higher emissions saving. It is better to have a lower stock of carbon in a working forest and to be continually sequestering new carbon for storage in solid wood products.
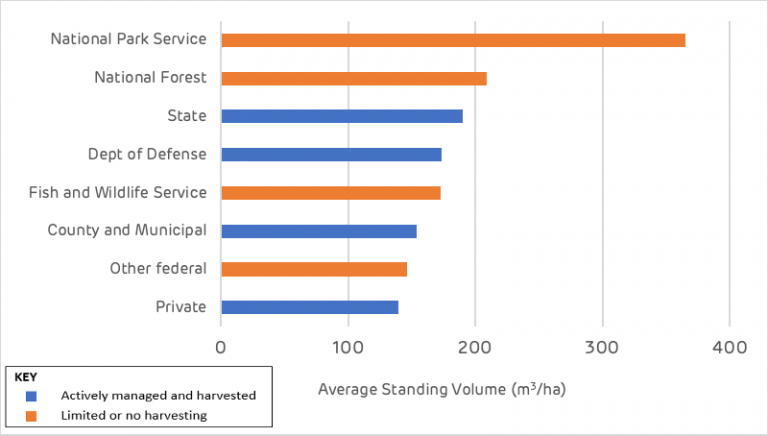
Average standing volume per acre by ownership class, Mississippi[2]
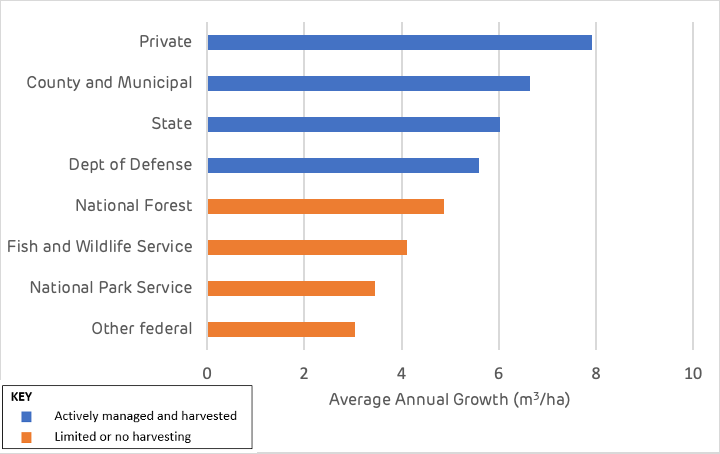
Comparing the average annual growth rates across all forest types in Mississippi, annual growth in the private sector is almost double that in the unharvested public forest. This differential is increased even further if only commercial species like pine are considered and a comparison is made between planted, well managed forests and those that are left to naturally regenerate.

Average growth rates per acre by ownership class, Mississippi[3]

The managed forest area is continually growing and storing more carbon at a materially higher rate than less actively managed forest. As harvesting removes some forest carbon, these products displace high carbon materials in construction and energy and new young forests are replacing the old ones.

We know that forests are not being ‘lost’ and that the overall storage of carbon is increasing. For example, the Drax catchment area analysis for the Amite biomass wood pellet plant showed an increase in forest area of 5,200 ha and an increase in volume of 11 million m3 – just in the area around the pellet mill. But what happens to protected forest area, the forest reserve with limited or no harvesting?

Over the last 20 years the average annual loss of forest to wildfire in the US has been 2.78 million ha per year (the same as the UK’s total area of productive forest). According to the USFS FIA database the average standing volume of forests in the US is 145 m3 per ha (although in the National Park land this is 365 m3 per ha). Therefore, wildfires are responsible for the average annual combustion of 403 million m3 of wood p.a. (equal to the total annual wood harvest of the US) or 2.5 billion m3 if entirely in National Parks.

One cubic metre equates to a similar quantity of CO2 released into the atmosphere each year, therefore wildfires are responsible for between 407 million and 2.5 billion tonnes of CO2 emissions in the US each year[4].
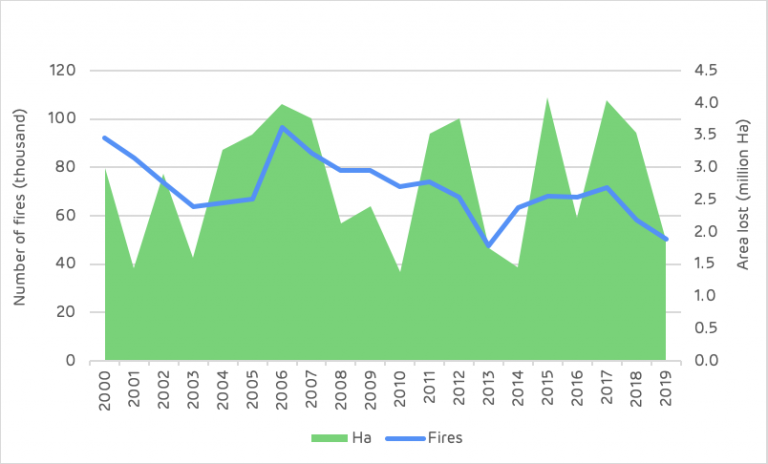
Wildfires in the US

Starrs et al. (2018)[5] demonstrated that the risk of wildfire was significantly higher in federally owned reserved forest (where harvesting and management were restricted), compared to privately owned forests with active management.

In California, the risk of wildfire in federal forest (2000-15) was almost double the risk in private forests where both had State firefighting resources. The risk of fires in federal lands had increased by 93% since 1950-66, compared to only 33% in non-federal forests, due to the change in forest management practice in the 1970s.

Forest fire in California

Closing the gate means that the carbon stock is maintained and grows in the short term, but there is no opportunity for carbon to be stored in solid wood products, no high-carbon materials are displaced (concrete, steel and fossil fuels) and the rate of sequestration declines as the forest ages. Eventually the forest will reach its natural climax and die, releasing all of that carbon back into the atmosphere. The managed forest, by contrast, will have a lower standing volume at a certain point in time, but will be in a continual cycle of sequestration, storage and regrowth – with a much lower risk of fire and disease. If managed correctly, the rate of growth and standing volume will also increase over time.

How should we manage the forest

Forests are extremely variable, there are a vast variety of tree species, soil, geological features, water regimes, temperature, climate and many other factors that combine to make unique ecosystems and forest landscapes. Some of these are rare and valuable for the exceptional assemblages they contain, some are commonplace and widespread. Some are natural, some man-made or influenced by human activity.

Forests have many important roles to play and careful management is required. In some cases that management may be protection, preservation and monitoring. In other cases, it may be active harvesting and planting to optimise growth and carbon storage.

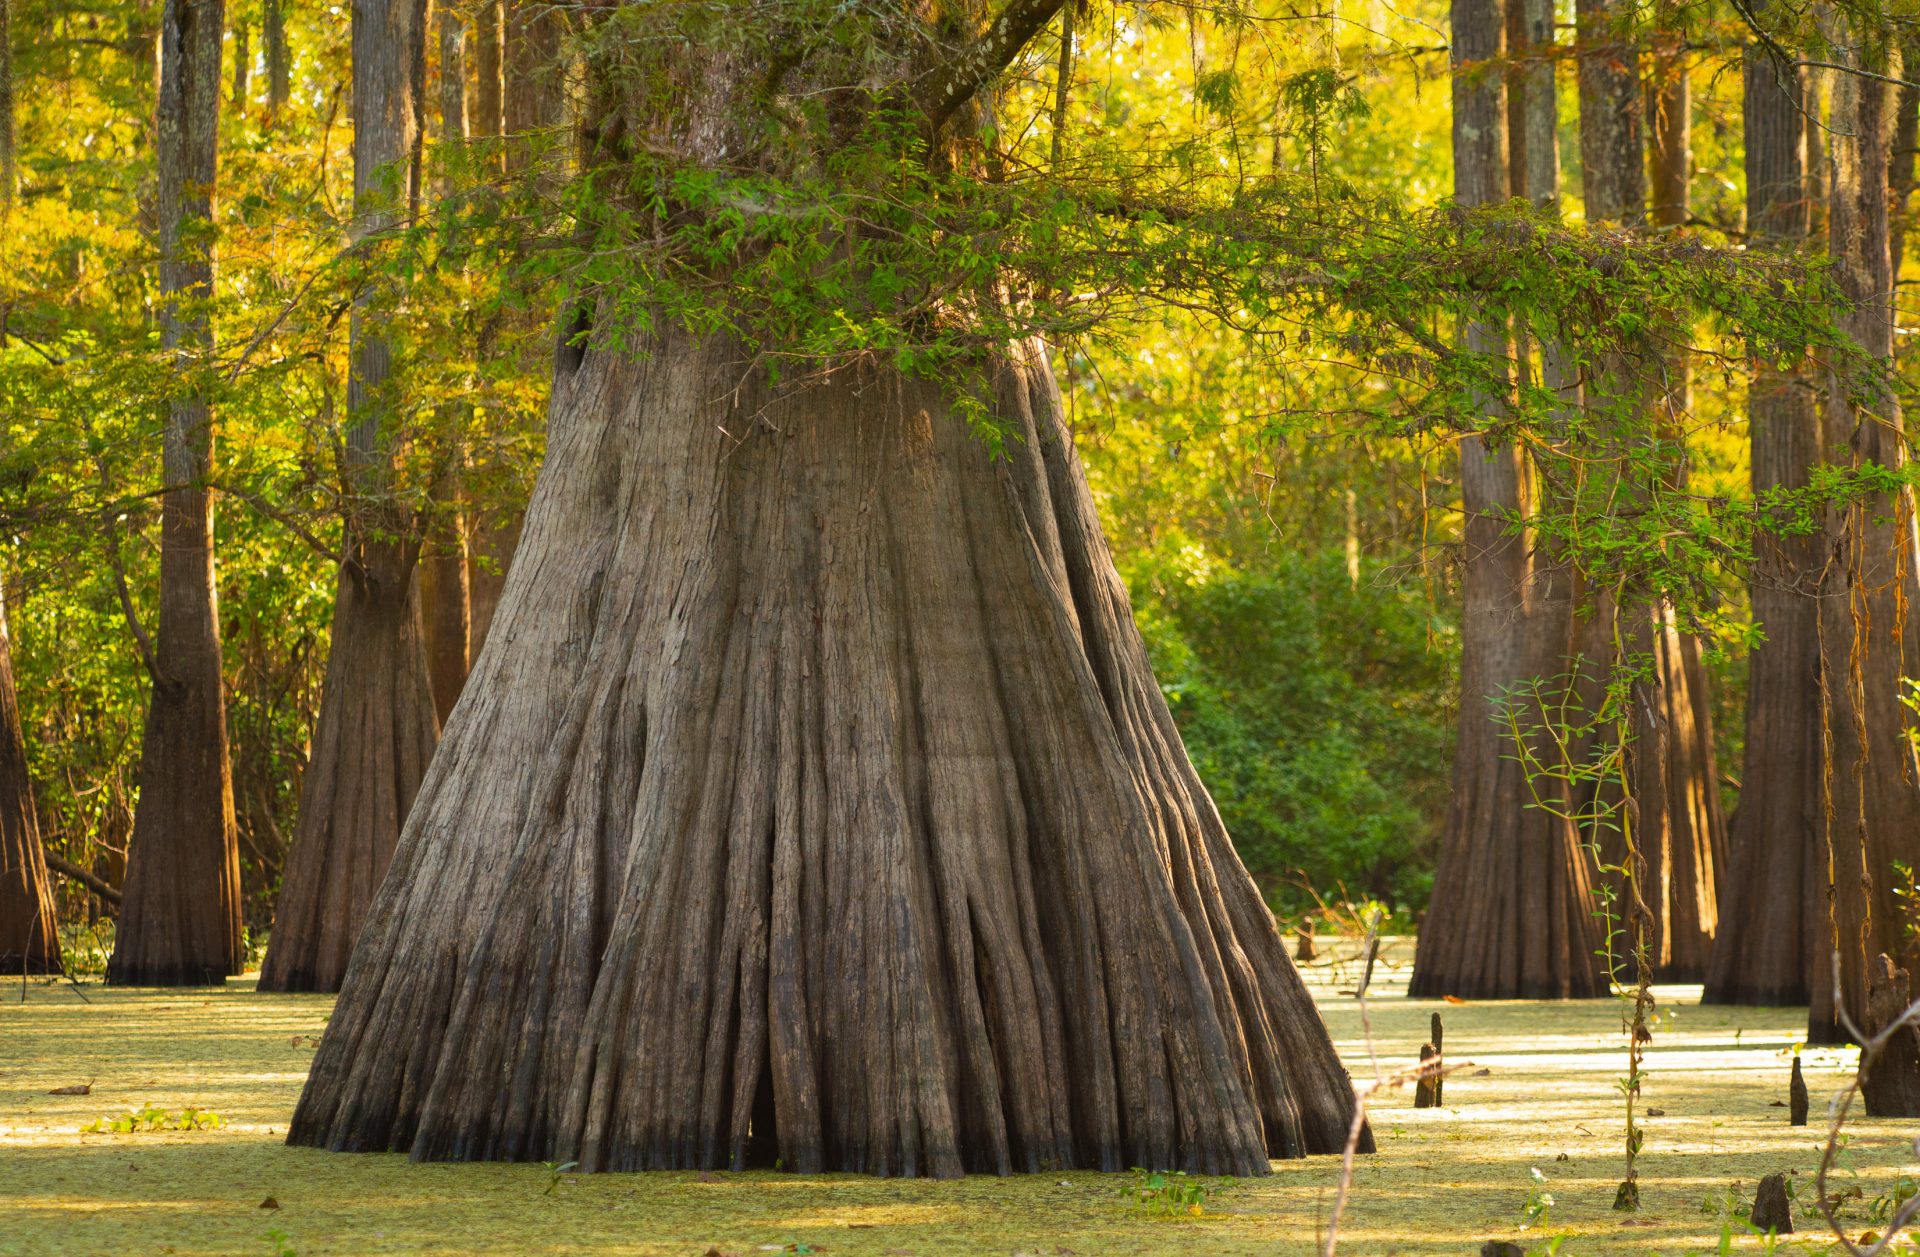
Cypress forests in the Atchafalaya Basin in Louisiana are an example of a forest landscape where the suitable management practice is protection, preservation and monitoring

For each forest type and area, we need to recognise the highest or best purpose(s) for that land in the objectives set and carefully plan the management to optimise and sustain that value. The primary value could be in species and habitat diversity or rarity; provision of recreation and aesthetic value; production of timber, forest products and revenue generation; carbon sequestration and storage; water management and other ecosystem benefits.

Most likely it will be a combination of several of these benefits. Therefore, best management practice usually involves optimising each piece of forest land to provide the most effective combination of values. Forests can deliver many benefits if we are sensible about how we manage them.

In a recent study Favero et al. (2020)[6] concluded that: Increased bioenergy demand increases forest carbon stocks thanks to afforestation activities and more intensive management relative to a no-bioenergy case. Some natural forests, however, are converted to more intensive management, with potential biodiversity losses…the expanded use of wood for bioenergy will result in net carbon benefits, but an efficient policy also needs to regulate forest carbon sequestration.

[1] CHADWICK DEARING OLIVER, NEDAL T. NASSAR, BRUCE R. LIPPKE, and JAMES B. McCARTER, 2014. Carbon, Fossil Fuel, and Biodiversity Mitigation with Wood and Forests.
[2] US Forest Service, FIA Database, 2020.
[3] US Forest Service, FIA Database, 2020.
[4] Assumes an average basic density of 570kg/m3 and 50:25:25 ratio of cellulose, lignin and hemicellulose.
[5] Carlin Frances Starrs, Van Butsic, Connor Stephens and William Stewart, 2018. The impact of land ownership, firefighting, and reserve status on fire probability in California.
[6] Alice Favero, Adam Daigneault, Brent Sohngen, 2020. Forests: Carbon sequestration, biomass energy, or both?

Changing forest structure in Virginia and North Carolina

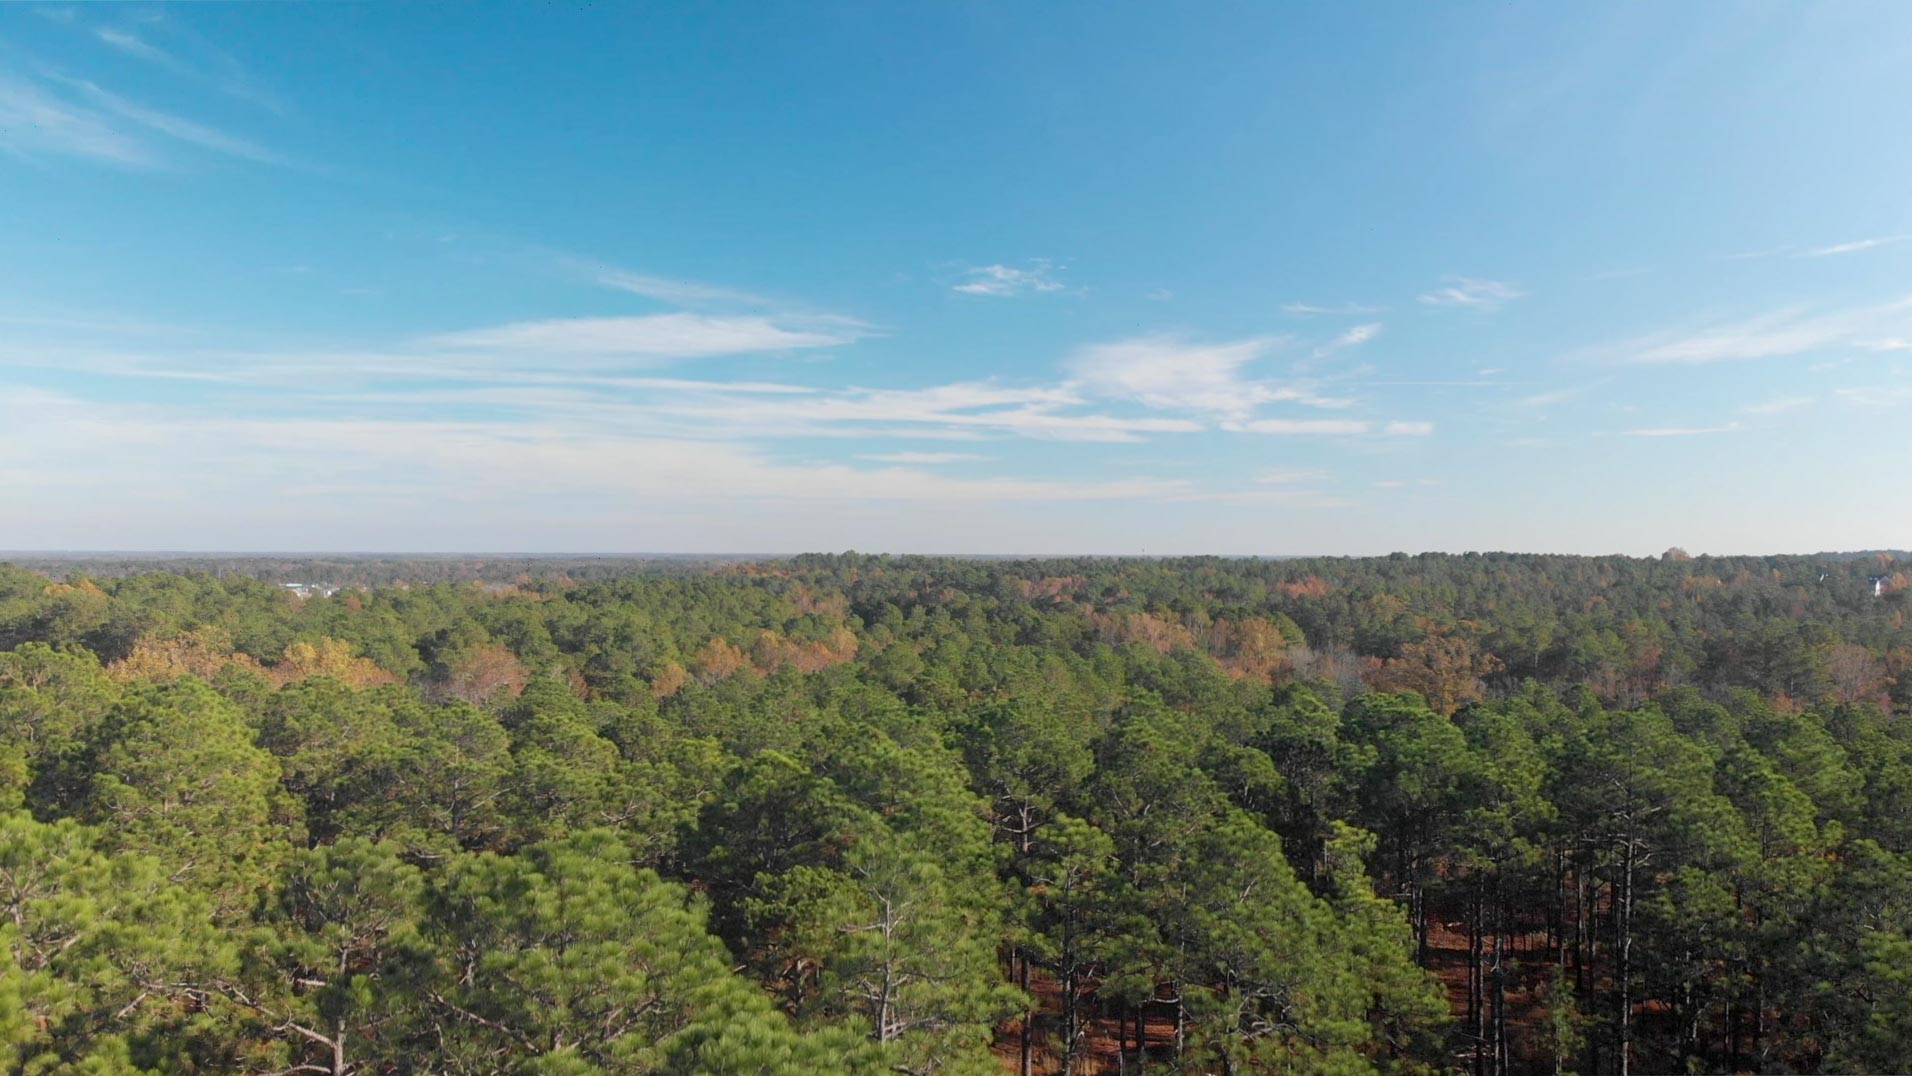
Photos: Roanoke Rapids area near the North Carolina, Virginia border, courtesy of Enviva.

Forest owners have responded to the recovery in pine saw-timber markets, since the global financial crisis of 2008, by planting more forest and investing more in the management of their land. The same period has witnessed increased demand from the biomass sector which has replaced declining need for wood from pulp and paper markets.

The area of timberland (actively managed productive forest) has increase by around 89,000 hectares (ha) since 2010. This change is due to three important factors: new planting on agricultural land; the planting of low-grade self-seeded areas with more productive improved pine; and the re-classification by the US Forest Service (USFS) of some areas of naturally regenerated pine from woodland to timberland.

The 2018 data shows that pine forest makes up 46% of the timberland area, of which 61% is planted and the remainder naturally regenerated. Hardwoods cover 43% of the timberland area, with 93% of this naturally regenerated. The remaining area is mixed stands.

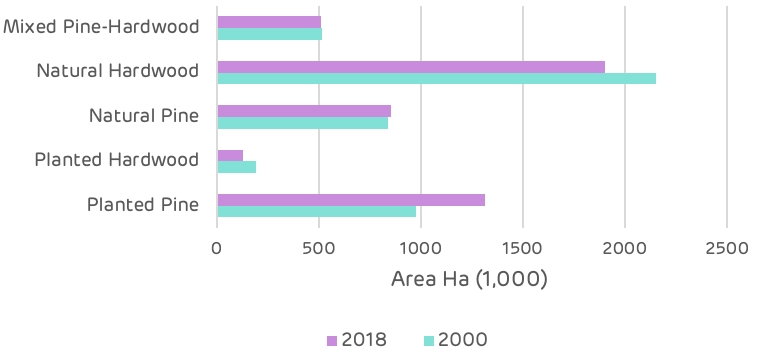
Composition of timberland area

Since 2000 there have been some significant changes in the composition of the timberland area with a transition from hardwood to softwood. Pine has increased from 39% of the total area in 2000 to 46% in 2018 and hardwood has decreased from 50% to 43% over the same period.

All pine areas have increased since 2000 with naturally regenerated pine increasing by 13,000 ha and planted pine by 340,000 ha since 2000. Mixed stands have declined by 6,500 ha as some of these sites have been replanted with improved pine to increase growth and saw-timber production.

The biggest change has been in the hardwood areas where there has been a decline of around 314,000 ha, despite the total area of timberland increasing by 31,000 ha.

Change in forest type

This change has been driven by private forest owners (representing 91% of the total timberland area), seeking to gain a better return on investment from their forest land.

Hardwood markets have declined since the 2008 recession and demand for hardwood saw-timber has not recovered. Demand for pine saw-timber has rebounded and is now as strong as pre-crisis.

Pine also offers much faster growth rates and higher total volumes in a much shorter time frame (typically 25-35 years compared to 75-80 years for hardwoods).

The decision to change species is similar to a farmer changing their agricultural crops based on market demand and prices for each product. Where forests are managed for revenue generation then it is reasonable to optimise the land and crop for this objective. This can be a significant positive, from a carbon perspective more carbon is sequestered in a shorter time frame and more carbon is stored in long term wood products, if the quantity if saw-timber is increased.

Increased revenue generation also helps to maintain the forest area (rather than conversion to urban development, agriculture or other uses).

A potential negative is the change in habitat from a pure hardwood stand to a pure pine stand, each providing a different ecosystem and supporting a different range of flora and fauna. There is no conclusive evidence that one forest type is better or worse than the other; there is a great deal of variety of each type.

Some hardwood forests are rich in species and biodiversity, others can be unremarkable. The key is not to endanger or risk losing any species or sensitive habitat and to ensure that any conversion only occurs where there is no loss of biodiversity and no negative impact to the ecosystem.

It is not clear whether all of the lost hardwood stands have been directly converted to pine forests, some hardwood stands may have been lost to other land uses (urban and other land has increased by 400,000 ha). Some may have been directly converted to pine by forest owners encouraged by the increase in pine saw-timber demand and prices.

Whatever the primary driver of this change it is clearly not being driven by the biomass sector.

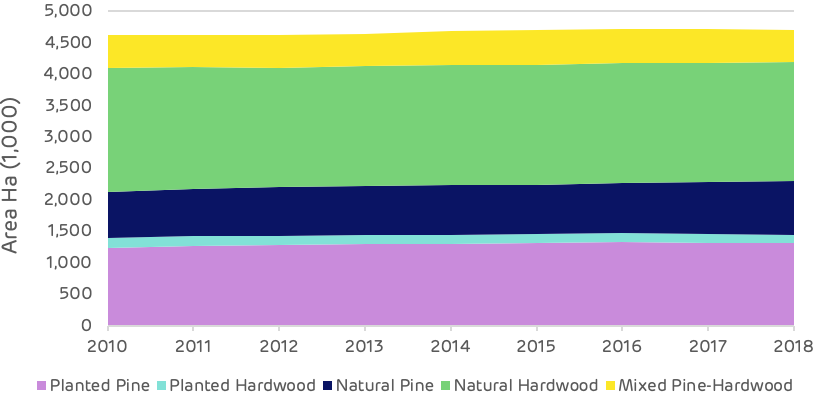
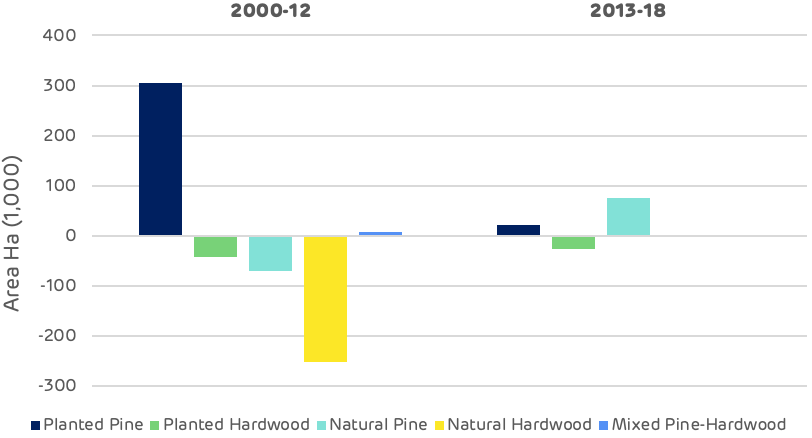
Change in forest type – timing

The chart above demonstrates that the biggest change, loss of hardwood and increase in planted pine, occurred between 2000 and 2012, prior to the operation of the pellet mills. Since 2012, there has been no significant loss of natural hardwood and only a small decline in planted hardwood.

Read the full report: Catchment Area Analysis of Forest Management and Market Trends: Enviva Pellets Ahoskie, Enviva Pellets Northampton, Enviva Pellets Southampton (UK metric version). Explore Enviva’s supply chain via Track & Trace. This is part of a series of catchment area analyses around the forest biomass pellet plants supplying Drax Power Station with renewable fuel. The series includes: Estonia, Morehouse Bioenergy, Amite Bioenergy, and the Drax forestry team’s review of the Chesapeake report on Enviva’s area of operations.

Chesapeake catchment area analysis

Photos: Roanoke Rapids area near the North Carolina, Virginia border, courtesy of Enviva.

Increased timberland, increased carbon stored in the forest, robust prices and new markets benefiting forest owners and forest workers, are among the findings of a report by Hood Consulting.

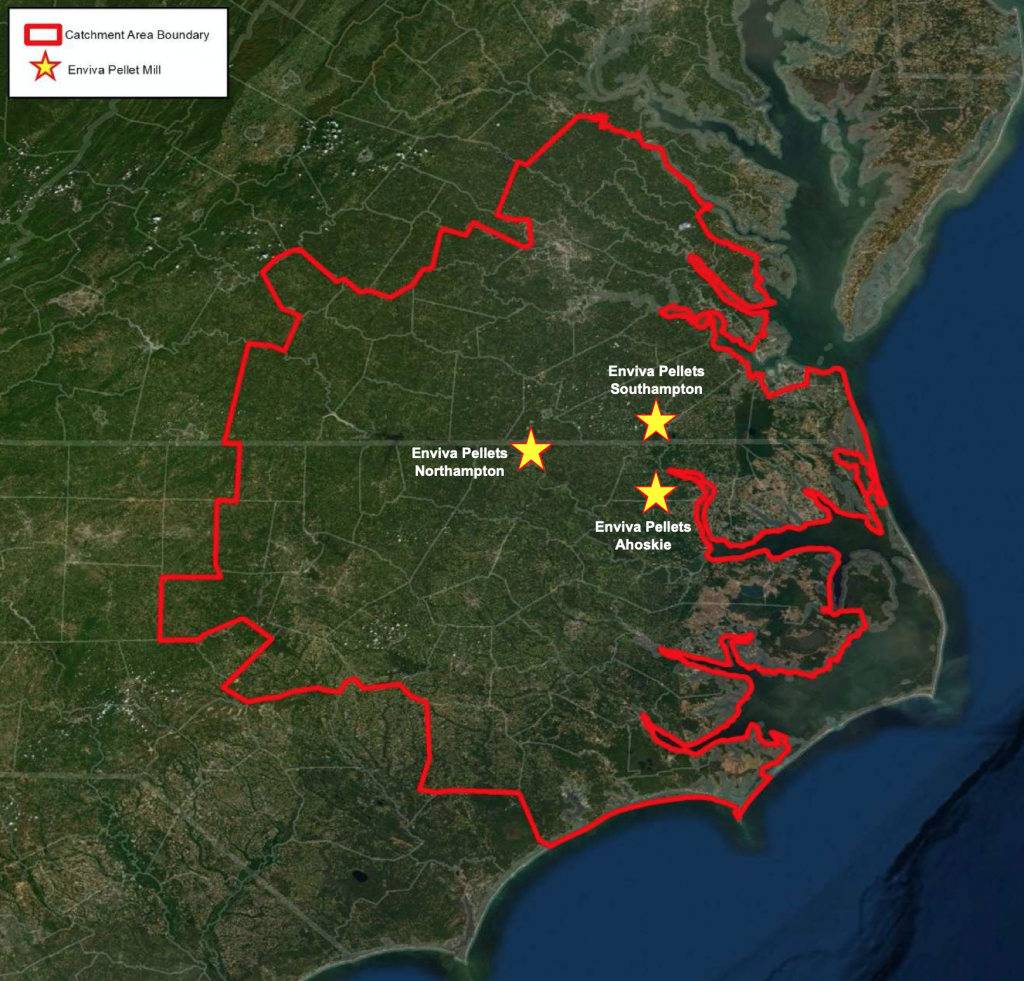
This fourth in a series of catchment area analyses for Drax looks at the area surrounding three pellet plants operated by Enviva: Ahoskie, Northampton and Southampton.

Enviva catchment area in Virginia and North Carolina

Forests and woodlands represent 68% of the total area at just over 5.4 million hectares (ha) with 87% of this area classified as timberland. The area of timberland (actively managed productive forest) has increased by around 89,000 ha since 2010 and there have been some significant changes in forest type.

The overall area of forest has increased and there is no evidence of deforestation occurring.

Land use by area

Since 2000, the total volume of standing timber in the catchment area has increased by 170 million cubic metres (m3). Sixty five percent of this increase has occurred since 2012, indicating a growing/maturing forest resource and an expanding forest area. Most of the increase in volume has been in the saw-timber categories for both pine and hardwood, although the hardwood pulpwood size class has also increased by nearly 10 million m3 since 2012 following a small decline between 2000 and 2012.

Timber inventory by product category

The increased demand from the three Enviva pellet mills, beginning operation in 2012 in the Chesapeake region, appears to have had no negative impact of the accumulation of forest carbon in the growing stock of the region. Since this time, all categories of timber product have increased.

Timber inventory by product category – pre and post-Enviva

This increase in inventory is also reflected in the comparison of average annual growth to removals. The surplus of un-cut growth has increased substantially since 2010 from 4.7 million m3 per year  to 15.9 million m3 p.a. Over this period annual growth has increased by 35.5% whereas removals have decreased by 8.6%.

Annual growth vs. removals and surplus volume

Demand for timber products has fluctuated since 2000. The global financial crisis in 2008-09 impacted all product categories, but particularly pine and hardwood saw-timber where there was a combined drop of over five million tonnes in 2010 compared to 2000. This was a loss of over 20% of total annual demand in the catchment area. Pine saw-timber has now recovered to pre-crisis levels, but hardwood demand has remained low. Hardwood pulpwood demand also declined around this time, with the closure and decline of existing pulp mills in the catchment area. Demand had fallen by one million tonnes p.a. by 2011 prior to the Enviva pellet mills opening. From 2012 the new biomass demand enabled the hardwood pulpwood market to recover to pre-crisis levels with demand in 2018 at almost exactly the same level as in 2000.

Annual demand by product category

This fluctuation in demand is reflected in the average annual stumpage price data shown on the chart below, this is the value that the forest owner gets for each product. The trends are generally as expected, with the exception of the hardwood saw-timber price, which has increased substantially despite a decrease in demand. This is due to supply chain issues, reduced capacity of loggers and access to land.

Average annual stumpage prices

Detailed below is an edited version of the consultant’s review and analysis of key issues in the catchment area.

The full version can be found in the main report.

Is there any evidence that bioenergy demand has caused the following?
Deforestation

No. US Forest Service (USFS) data shows the opposite. The total area of timberland in the Enviva Chesapeake catchment area has increased an estimated 82,818 hectares (+1.8%) since Enviva Pellets Ahoskie commenced full production in 2012.

A change in management practices (rotation lengths, thinnings, conversion from hardwood to pine)?

No / Inconclusive. Changes in management practices have occurred in the catchment area since 2012, but there is little evidence to suggest that bioenergy demand has caused these changes. Conversion of hardwood and mixed pine-hardwood timberland to planted pine timberland has occurred in the catchment area.

Diversion from other markets

No / Inconclusive. Since 2012, pulpwood demand not attributed to bioenergy has decreased 19%; however, this decrease is largely attributed to decreased demand from the pulp/paper sector. Also, demand for softwood and hardwood sawlogs have increased an estimated 14% and 7%, respectively, since 2012.

An unexpected increase in wood prices

No / Inconclusive. The increase in hardwood biomass demand coincided with price increases of 10-24% for delivered hardwood pulpwood. These price increases were likely linked to a combination of both supply chain issues (shortage of local loggers following pulp/paper mill closures in the region) and elevated prices offered by Enviva to ensure guaranteed wood supply for the first several years of operation, as prices for delivered hardwood pulpwood and hardwood chips proceeded to decline 16% and 9%, respectively, from 2014 to2017 once the market stabilised.

Since 2014, prices for pine products have held flat even though softwood raw material purchases (demand) by Enviva have more than doubled. In this catchment area, changes in pine pulpwood and pine chip prices are largely driven by demand attributed to the pulp/paper sector.

A reduction in growing stock timber

No. Total growing stock inventory in the catchment area increased 19% from 2012 through 2018. Over this period, inventories increased as follows for each of the five major timber products: +33% for pine sawtimber, +23% for pine chip-n-saw, +14% for pine pulpwood, +12% for hardwood sawtimber, and +14% for hardwood pulpwood.

The increase in timber inventory can be linked to a combination of increased forest area (additional hectares = additional inventory) and annual harvest levels below the sustainable yield capacity of the catchment area forest (i.e. annual growth has continued to exceed annual removals, resulting in increased inventory levels).

A reduction in the sequestration rate of carbon

No. US Forest Service data shows the average annual growth rate of growing stock timber has increased slightly since 2012. Increased timber growth rates/carbon sequestration rates can be linked to a combination of changes in species composition and silvicultural practices.

Softwood (pine) grows at a much quicker rate compared to hardwood species, and in the Enviva Chesapeake catchment area, pine timberland area increased from 43.6% of total timberland area in 2011 to 46.0% in 2018. Also, improvements in silviculture have continued to enhance growth and overall productivity. Together, these factors help explain how average per hectare volume growth increased from 5.9 m3 in 2011 to 7.7 m3 in 2018.

An increase in harvesting above the sustainable yield capacity of the forest area

No. In 2018, the latest available, growth-to-removals ratio for pine and hardwood pulpwood, the timber products utilised by bioenergy, equalled 2.49 and 2.76, respectively (a value greater than 1.0 indicates sustainable harvest levels). Even with the increased harvesting required to satisfy bioenergy demand, harvest levels remain well below the sustainable yield capacity of the catchment forest area.

What has been the impact of bioenergy demand on?

Timber growing stock inventory

Neutral. Total wood demand increased an estimated 14% from 2012-2018, and much of that increase can be attributed to increased demand from bioenergy. In this catchment area, inventories are so substantial that increases in demand from bioenergy, as well as from other sources, have not been great enough to offset annual timber growth. Total growing stock inventory has continued to increase – an average of 2.9% per year since Enviva first entered this market in 2012.

Timber growth rates

Neutral. Timber growth rates have increased for pine sawtimber, pine chip-n-saw, pine pulpwood, and hardwood pulpwood since 2012; hardwood sawtimber growth rates have declined slightly. Evidence suggests these overall increases in growth rates are linked to changes in age class distribution (i.e. a younger forest), not due to changes in bioenergy demand

Forest area

Positive / Neutral. Total forest (timberland) area in the catchment area increased nearly 83,000 hectares (+1.8%) from 2012 through 2018, the latest available. Our analysis of biomass demand and forest area found a strong positive correlation between these two variables but also a moderately strong correlation between softwood sawlog demand and forest area.

Wood prices

Neutral / Negative. The additional wood demand placed on this market by Enviva from 2012-2014 coincided with a 19% increase in delivered pine pulpwood price and a 24% increase in delivered hardwood pulpwood price. Pine and hardwood chip prices also increased 10-11% over this period. Analysis found evidence that increases in hardwood pulpwood and hardwood chip prices can be linked to increases in total hardwood pulpwood demand. However, given that hardwood bioenergy demand has accounted for over 75% of total hardwood pulpwood demand in the catchment area since 2014, it is reasonable to conclude that hardwood pulpwood demand attributed to bioenergy has had some level of impact on delivered hardwood pulpwood and hardwood chip prices.

Markets for solid wood products

Positive. In the Enviva Chesapeake catchment area, demand for softwood and hardwood sawlogs used to produce lumber and other solid wood products increased 15% and 9%, respectively, from 2012-2018. A by-product of the sawmilling process are sawmill residuals – a material utilied by Enviva’s three mills to produce wood pellets. With the increased production of both softwood and hardwood lumber, so too has come an increase in sawmill residuals, some of which has been purchased/consumed by Enviva.

Not only has Enviva benefited from the greater availability of this by-product, but lumber producers have also benefited, as Enviva’s three mills have provided an additional outlet for these producers and their by-products.

Forest landowners

Positive. Increased demand attributed to bioenergy has been a positive for forest landowners in the Chesapeake catchment area. Not only has bioenergy provided an additional outlet for pulpwood (particularly hardwood pulpwood), but the increase in pulpwood prices as a result of an overall increase in both softwood and hardwood pulpwood demand has transferred through to landowners (improved compensation).

Specifically, since 2013 (the first year all three Enviva pellet mills were operating), hardwood pulpwood stumpage price – the price paid to landowners – has averaged roughly $5.60 per ton in the Chesapeake catchment area. This represents a 47% increase over the approximately $3.80 per ton averaged by hardwood pulpwood stumpage in the catchment area over the 10 years prior (2003-2012). Similarly, pine pulpwood stumpage price has averaged $12.95 per ton in the catchment area since 2013, up 67% from the 2003-2012 average of $7.75 per ton.

Read the full report: Catchment Area Analysis of Forest Management and Market Trends: Enviva Pellets Ahoskie, Enviva Pellets Northampton, Enviva Pellets Southampton (UK metric version). Read the Drax forestry team’s blog ‘Changing forest structure in Virginia and North Carolina. Explore Enviva’s supply chain via Track & Trace. This is part of a series of catchment area analyses around the forest biomass pellet plants supplying Drax Power Station with renewable fuel. Others in the series include: Georgia Mill, Estonia, Latvia, Morehouse Bioenergy and Amite Bioenergy.

From steel to soil – how industries are capturing carbon

Construction metallic bars in a row

Carbon capture, use and storage (CCUS) is a vital technology in the energy industry, with facilities already in place all over the world aiming to eliminate carbon dioxide (CO2) emissions.

However, for decarbonisation to go far enough to keep global warming below 2oC – as per the Paris Climate Agreement – emission reductions are needed throughout the global economy.

From cement factories to farmland, CCUS technology is beginning to be deployed in a wide variety of sectors around the world.

Construction

The global population is increasingly urban and by 2050 it’s estimated 68% of all people will live in cities. For cities to grow sustainably, it’s crucial the environmental impact of the construction industry is reduced.

Construction currently accounts for 11% of all global carbon emissions. This includes emissions from the actual construction work, such as from vehicle exhaust pipes, but a more difficult challenge is reducing embedded emissions from the production of construction materials.

Steel and concrete are emissions-heavy to make; they require intense heat and use processes that produce further emissions. Deploying widespread CCUS in the production of these two materials holds the key to drastically reducing carbon emissions from the built environment.

Steel manufacturing alone, regardless of the electricity used to power production, is responsible for about 7% of global emissions. Projects aimed at reducing the levels of carbon released in production are planned in Europe and are already in motion in the United Arab Emirates.

Abu Dhabi National Oil Company and Masdar, a renewable energy and sustainability company, formed a joint venture in 2013 with the aim of developing commercial-scale CCUS projects.

In its project with Emirates Steel, which began in 2016, about 800,000 tonnes of CO2 is captured a year from the steel manufacturing plant. This is sequestered and used in enhanced oil recovery (EOR). The commercially self-sustaining nature of this project has led to investigation into multiple future industrial-scale projects in the region.

Cement manufacturing, a process that produces as much as 8% of global greenhouse gases, is also experiencing the growth of innovative CCUS projects.

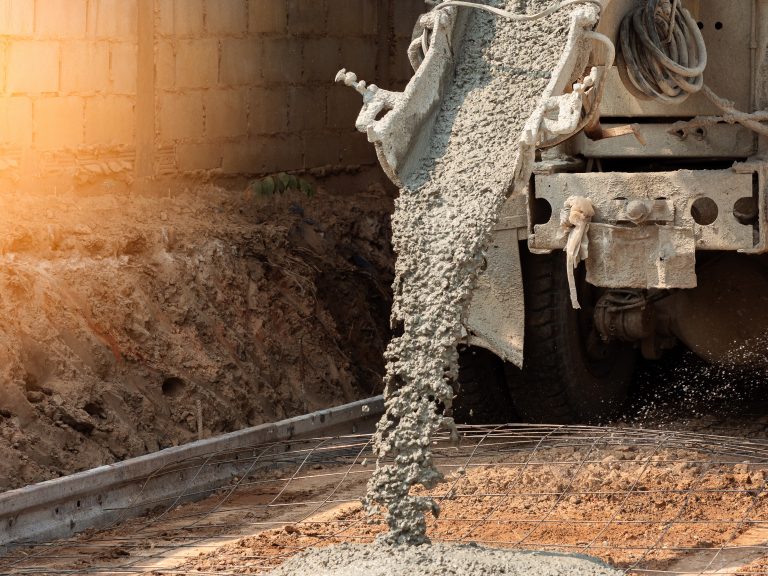
Pouring ready-mixed concrete after placing steel reinforcement to make the road by mixing in construction site

Norcem Cement plant in Brevik, Norway has already begun experimenting with CCUS, calculating that it could capture 400,000 tonnes of CO2 per year and store it under the North Sea. If the project wins government approval, Norcem could commence operations as soon as 2023.

However, as well as reducing emissions from traditional cement manufacturing and the electricity sources that power it, a team at Massachusetts Institute of Technology is exploring a new method of cement production that is more CCUS friendly.

By pre-treating the limestone used in cement creation with an electrochemical process, the CO2 produced is released in a pure, concentrated stream that can be more easily captured and sequestered underground or harnessed for products, such as fizzy drinks.

Agriculture

It’s hard to overstate the importance of the agriculture industry. As well as feeding the world, it employs a third of it.

Within this sector, fertiliser plays an essential role in maintaining the global food supply. However, the fertiliser production industry represents approximately 2% of global CO2 emissions.

CCUS technology can reduce the CO2 contributions made by the manufacturing of fertiliser, while maintaining crop reliability. In 2019, Oil and Gas Climate Initiative’s (OGCI) Climate Investments announced funding for what is expected to be the biggest CCUS project in the US.

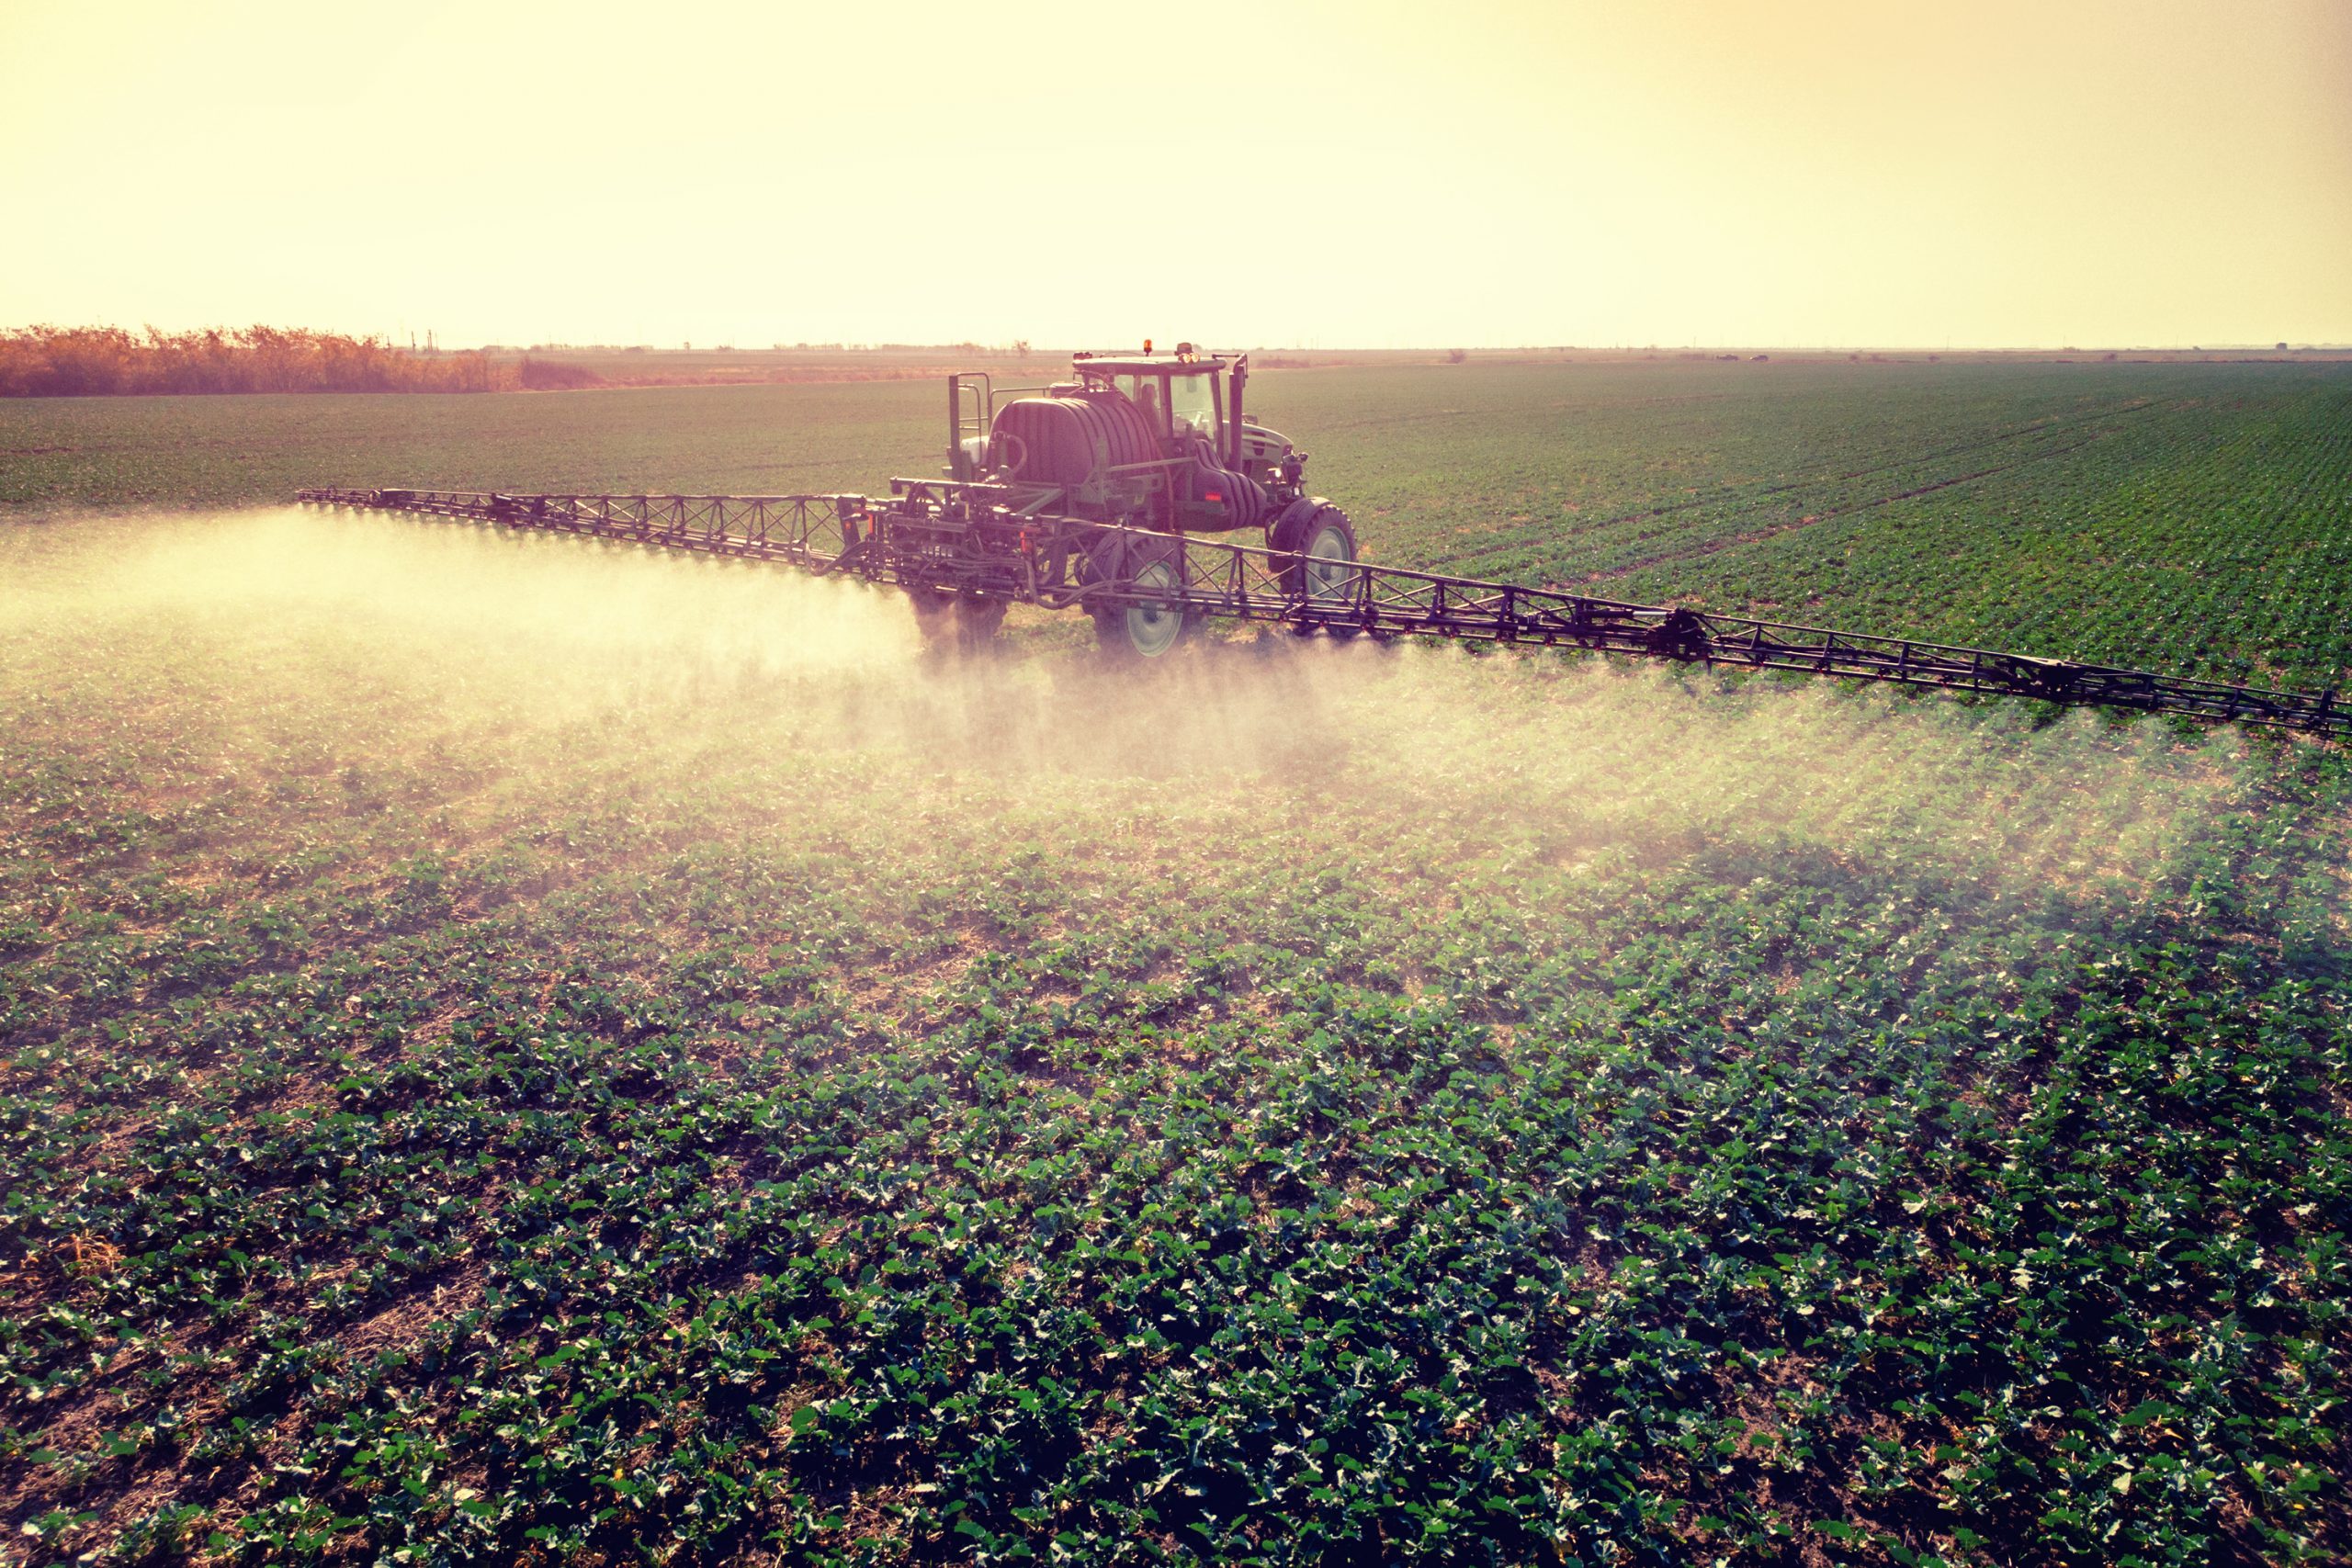
Tractor with pesticide fungicide insecticide sprayer on farm land top view Spraying with pesticides and herbicides crops

Based at the Wabash Valley Resources fertiliser plant in Indiana, the project will capture between 1.3 and 1.6 million tonnes of CO2 from the ammonia producer per year. The captured carbon will then be stored 2,000 metres below ground in a saline aquifer.

Similarly, since the turn of the millennium Mitsubishi Heavy Industries Engineering has deployed CCUS technology at fertiliser plants around Asia. CO2 is captured from natural gas pre-combustion, and used to create the urea fertiliser.

However, the agriculture industry can also capture carbon in more nature-based and cheaper ways.

Soil acts as a carbon sink, capturing and locking in the carbon from plants and grasses that die and decay into it. However, intensive ploughing can damage the soil’s ability to retain CO2.

It only takes slight adjustments in farming techniques, like minimising soil disturbance, or crop and grazing rotations, to enable soil and grasslands to sequester greater levels of CO2 and even make farms carbon negative.

Transport

The transport sector is the fastest growing contributor to climate emissions, according to the World Health Organisation. Electric vehicles and hydrogen fuels are expected to serve as the driving force for much of the sector’s decarbonisation, however, at present these technologies are only really making an impact on roads. There are other essential modes of transport where CCUS has a role to play. 

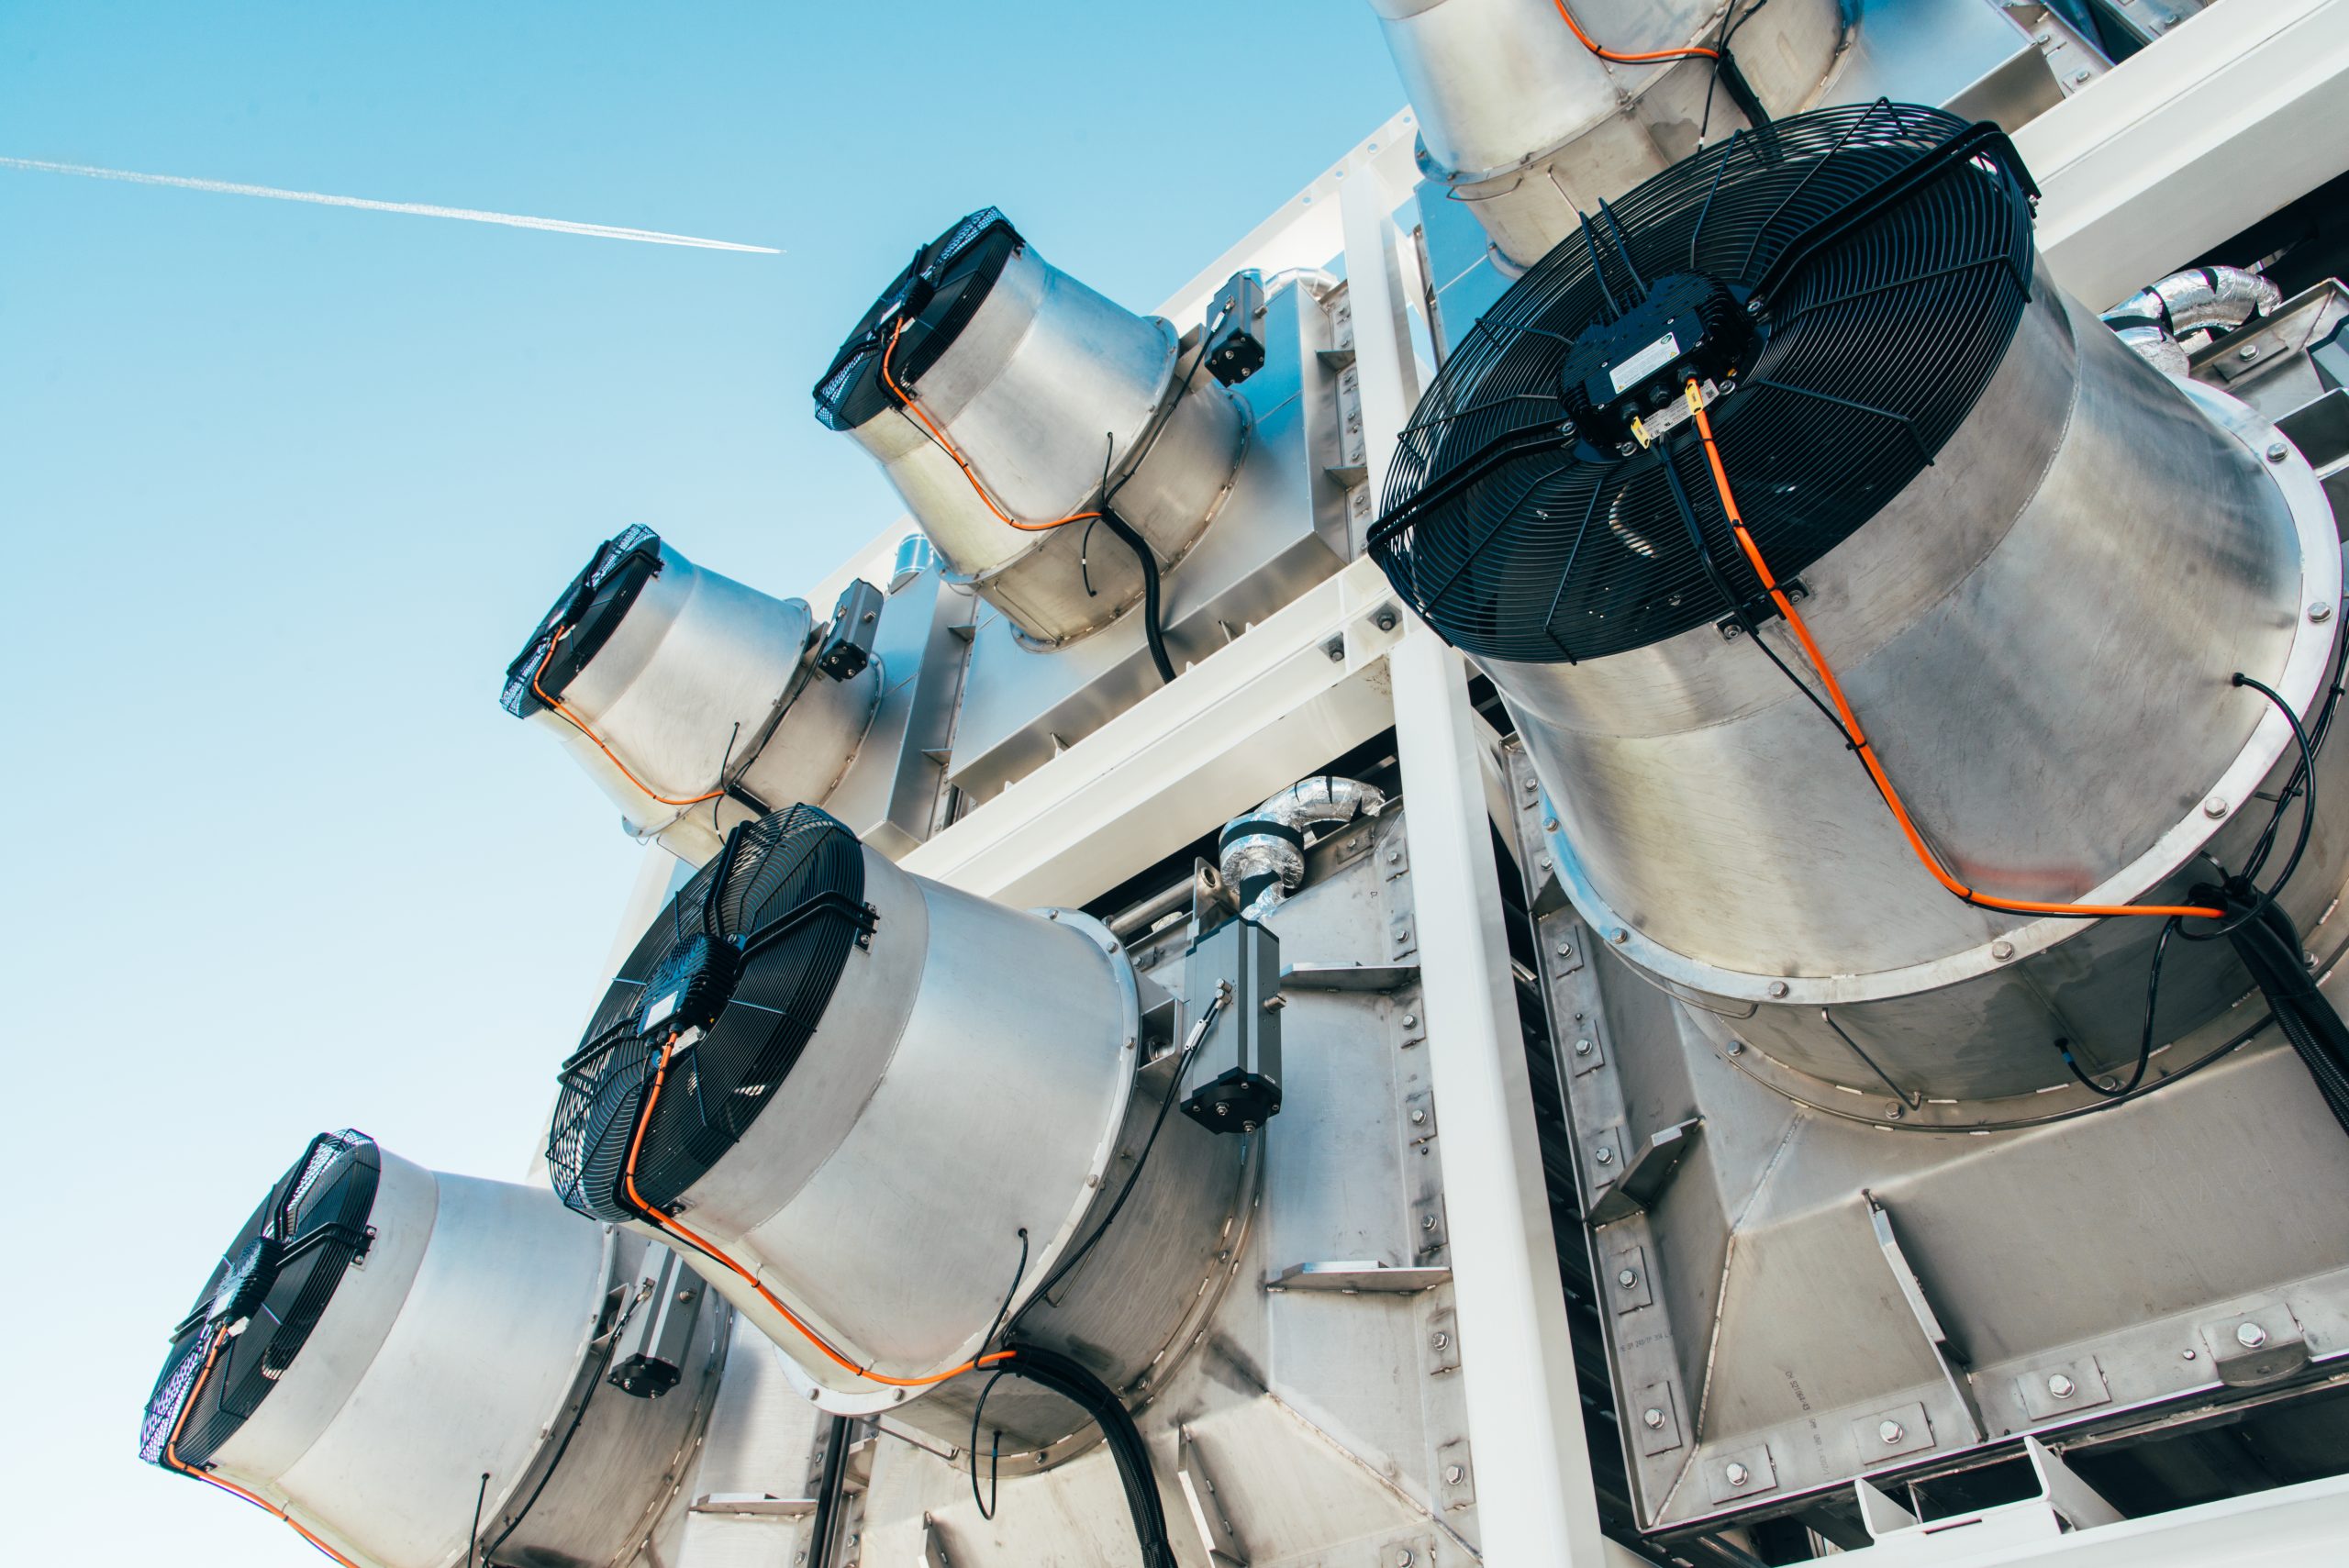
Climeworks, a Swiss company developing units that capture CO2 directly from the air, has begun working with Rotterdam The Hague Airport to develop a direct air capture (DAC) unit on the airport’s grounds.

Climeworks Plant technology [Source: Climeworks Photo by Julia Dunlop]

hydrogen filling station in the Hamburg harbor city

Hydrogen filling station in Hamburg, Germany.

However, beyond just capturing CO2 from planes taking off, Climeworks aims to use the CO2 to produce a synthetic jet fuel – creating a cycle of carbon reusage that ensures none is emitted into the atmosphere. A pilot project aims to create 1,000 litres of the fuel per day in 2021.

Another approach to zero-carbon transport fuel is the utilisation of hydrogen, which is already powering cars, trains, buses and even spacecraft.

Hydrogen can be produced in a number of ways, but it’s predominantly created from natural gas, through a process in which CO2 is a by-product. CCUS can play an important role here in capturing the CO2 and storing it, preventing it entering the atmosphere.

The hydrogen-powered vehicles then only emit water vapour and heat.

From every industry to every business to everyone

As CCUS technology continues to be deployed at scale and made increasingly affordable, it has the potential to go beyond just large industrial sites, to entire economic regions.

Global Thermostat is developing DAC technology which can be fitted to any factory or plant that produces heat in its processes. The system uses the waste heat to power a DAC unit, either from a particular source or from the surrounding atmosphere. Such technologies along with those already in action like bioenergy with carbon capture and storage (BECCS), can quickly make negative emissions a reality at scale.

However, to capture, transport and permanently store CO2 at the scale needed to reach net zero, collaboration partnerships and shared infrastructure between businesses in industrial regions is essential.

The UK’s Humber region is an example of an industrial cluster where a large number of high-carbon industrial sites sit in close proximity to one another. By installing BECCS and CCUS infrastructure that can be utilised by multiple industries, the UK can have a far greater impact on emissions levels than through individual, small-scale CCUS projects.

Decarbonising the UK and the world will not be achieved by individual sites and industries but by collective action that transcends sectors, regions and supply chains. Implementing CCUS at as large a scale as possible takes a greater stride towards bringing the wider economy and society to net zero.

Learn more about carbon capture, usage and storage in our series:

5 projects proving carbon capture is a reality

Petra Nova Power Station

The concept of capturing carbon dioxide (CO2) from power station, refinery and factory exhausts has long been hailed as crucial in mitigating the climate crisis and getting the UK and the rest of the world to net zero. After a number of false starts and policy hurdles, the technology is now growing with more momentum than ever. Carbon capture, use and storage (CCUS) is finally coming of age.

Increasing innovation and investment in the space is enabling the development of CCUS schemes at scale. Today, there are over 19 large-scale CCUS facilities in operation worldwide, while a further 32 in development as confidence in government policies and investment frameworks improves.

Once CO2 is captured it can be stored underground in empty oil and gas reservoirs and naturally occurring saline aquifers, in a process known as sequestration. It has also long been used in enhanced oil recovery (EOR), a process where captured CO2 is injected into oil reservoirs to increase oil production.

Drax Power Station is already trialling Europe’s first bioenergy carbon capture and storage (BECCS) project. This combination of sustainable biomass with carbon capture technology could remove and capture more than 16 million tonnes of CO2 a year and put Drax Power Station at the centre of wider decarbonisation efforts across the region as part of Zero Carbon Humber.

Here are five other projects making carbon capture a reality today:

Snøhvit & Sleipner Vest 

Who: Sleipner – Equinor Energy, Var Energi, LOTOS, KUFPEC; Snøhvit – Equinor Energy, Petoro, Total, Neptune Energy, Wintershall Dean

Where: Norway

Sleipner Vest Norway

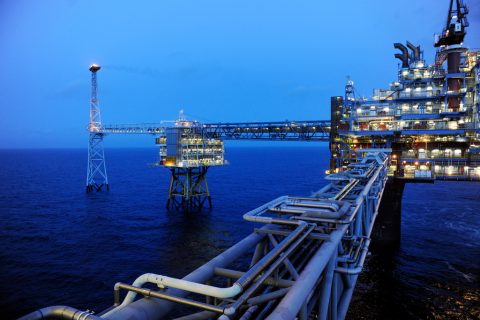
Sleipner Vest offshore carbon capture and storage (CCS) plant, Norway [Click to view/download]

Sleipner Vest was the world’s first ever offshore carbon capture and storage (CCS) plant, and has been active since 1996. The facility separates CO2 from natural gas extracted from the Sleipner field, as well as from at the Utgard field, about 20km away. This method of carbon capture means CO2 is removed before the natural gas is combusted, allowing it to be used as an energy source with lower carbon emissions.

Snøhvit, located offshore in Norway’s northern Barents Sea, operates similarly but here natural gas is pumped to an onshore facility for carbon removal. The separated and compressed CO2 from both facilities is then stored, or sequestered, in empty reservoirs under the sea.

The two projects demonstrate the safety and reality of long-term CO2 sequestration – as of 2019, Sleipner has captured and stored over 23 million tonnes of CO2 while Snøhvit stores 700,000 tonnes of CO2 per year.

Petra Nova

Who: NRG, Mitsubishi Heavy Industries America, Inc. (MHIA) and JX Nippon, a joint venture with Hilcorp Energy 

Where: Texas, USA

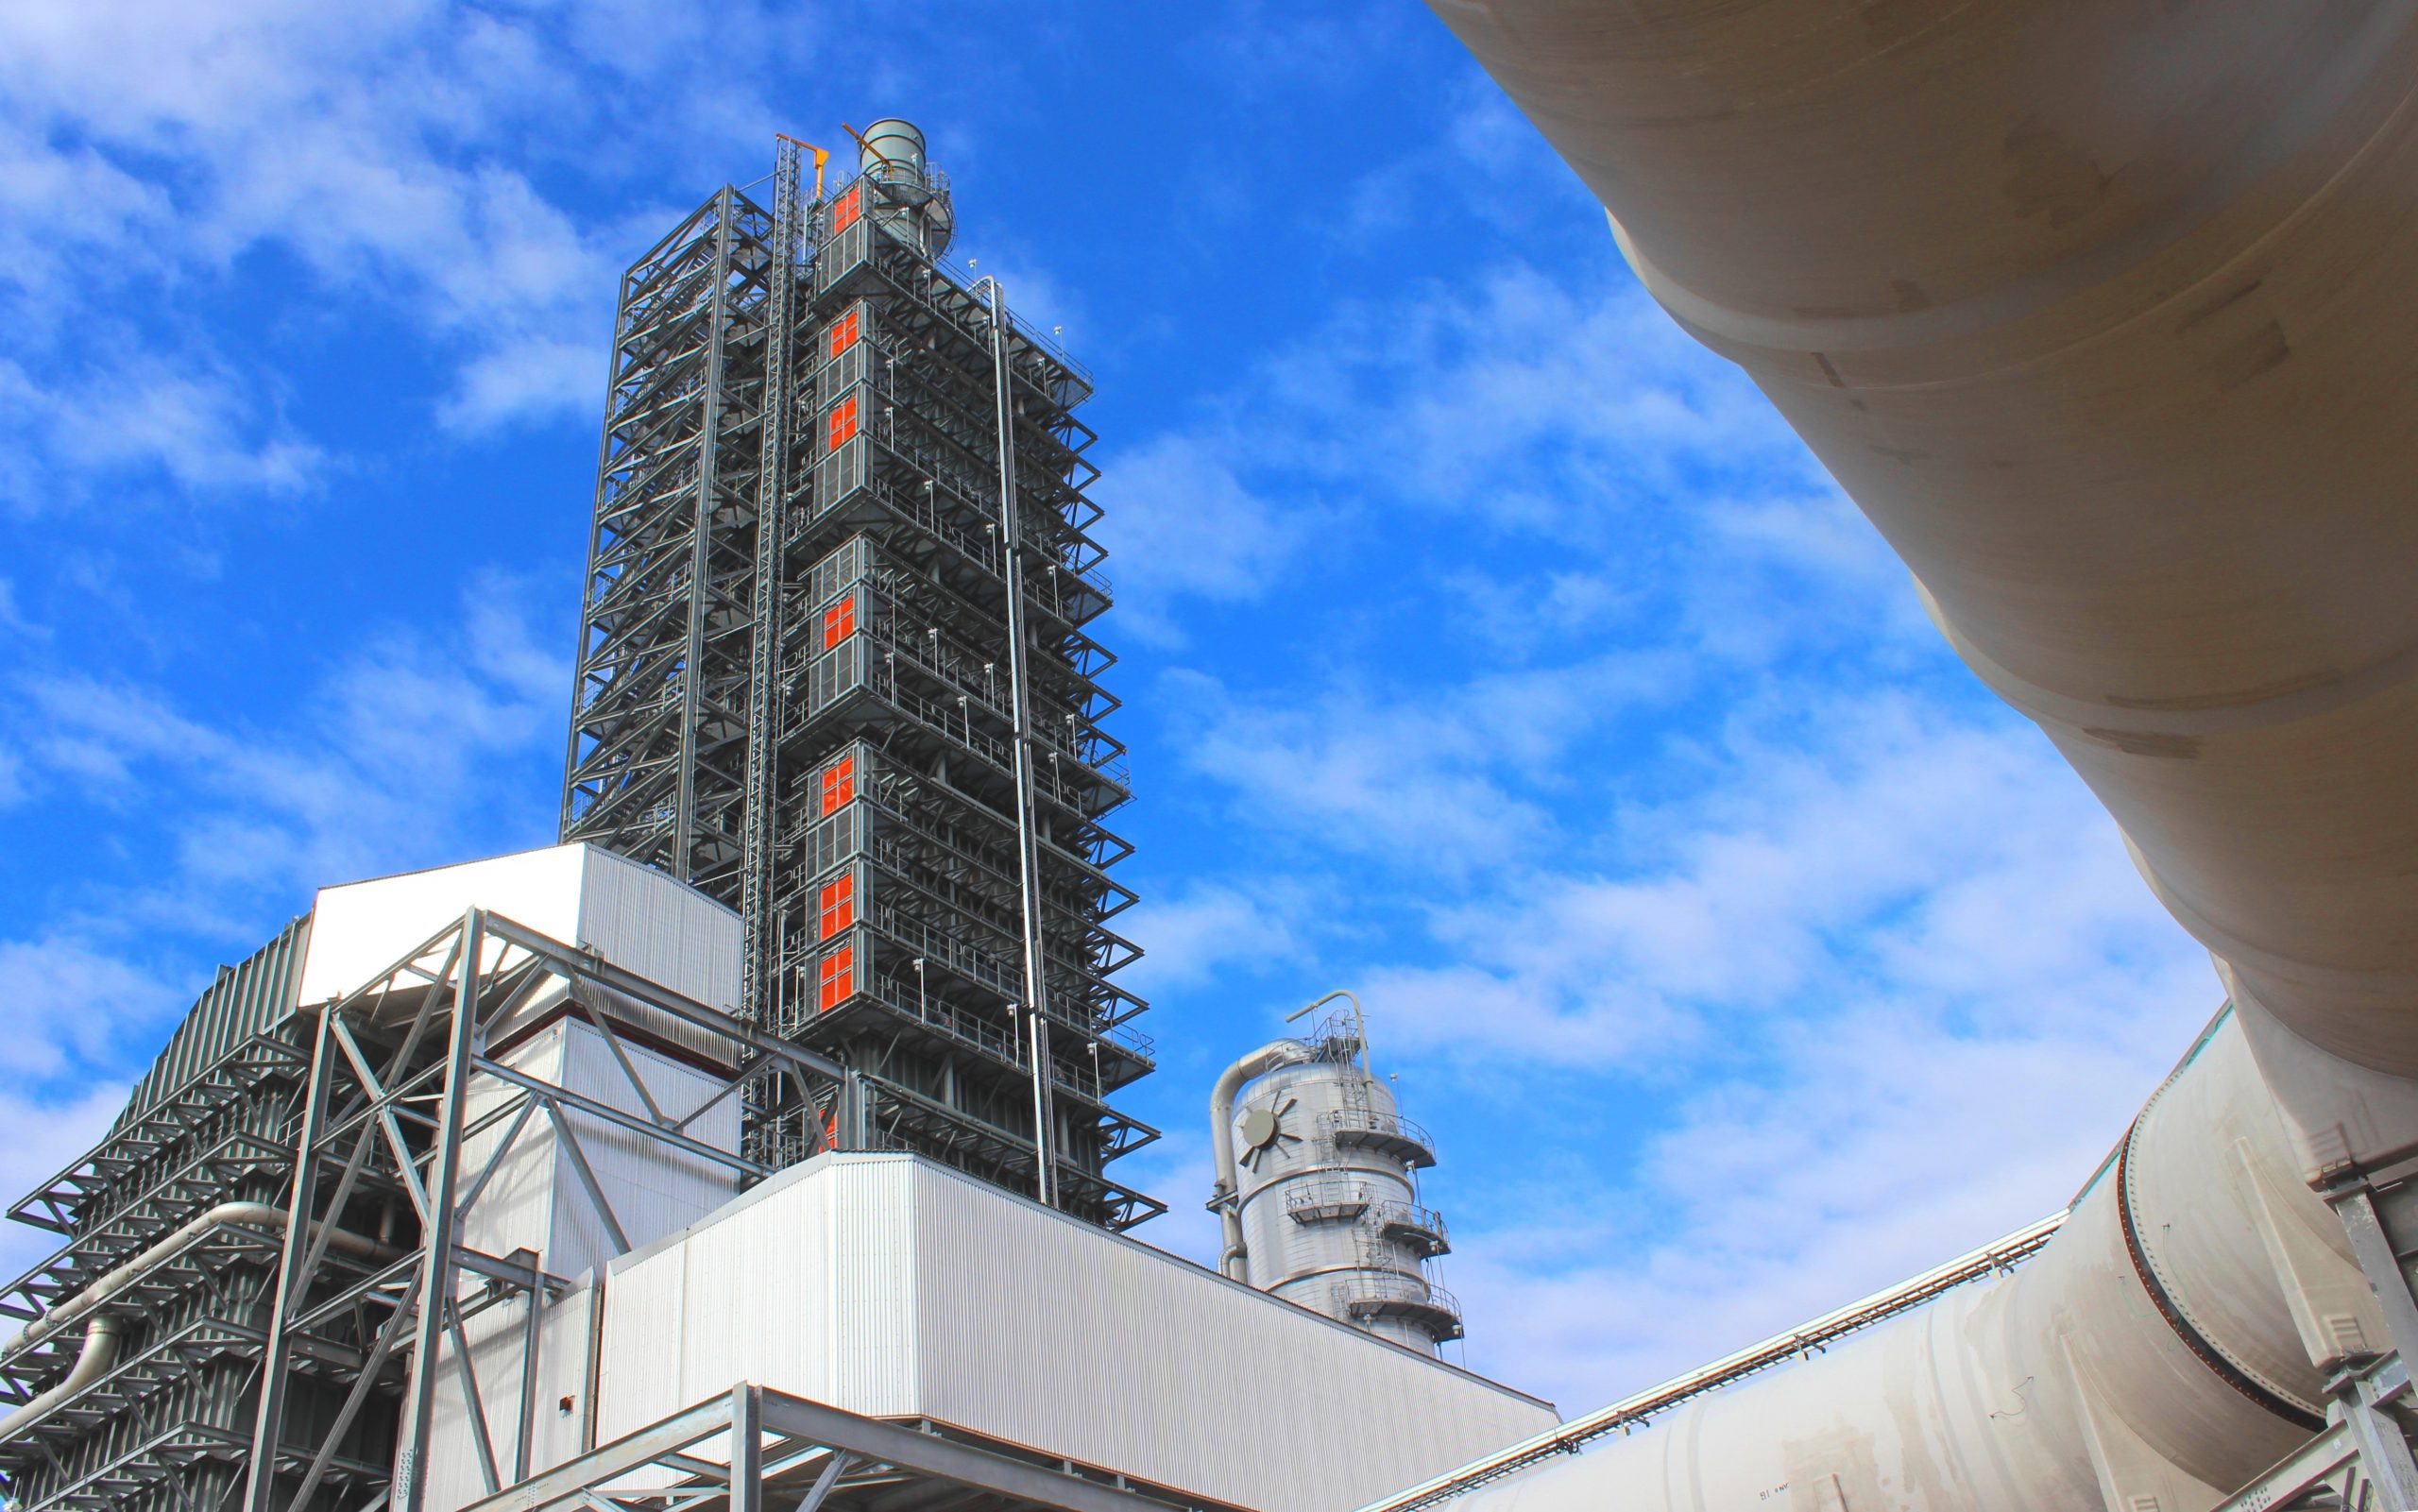
In 2016, the largest carbon capture facility in the world began operation at the Petra Nova coal-fired power plant.

Using a solvent developed by Mitsubishi and Kansai Electric Power, called KS-1, the CO2 is absorbed and compressed from the exhausts of the plant after the coal has been combusted. The captured CO2 is then transported and used for EOR 80 miles away on the West Ranch oil field.

Carbon capture facility at the Petra Nova coal-fired power plant, Texas, USA

As of January 2020, over 3.5 million tonnes of CO2 had been captured, reducing the plant’s carbon emissions by 90%. Oil production, on the other hand, increased by 1,300% to 4,000 barrels a day. As well as preventing CO2 from being released into the atmosphere, CCUS has also aided the site’s sustainability by eliminating the need for hydraulic drilling.


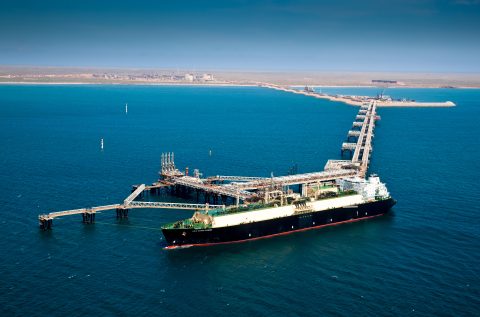
Gorgon LNG, Barrow Island, Australia [Click to view/download]

Gorgon LNG

Who: Operated by Chevron, in a joint venture with Shell, Exxon Mobil, Osaka Gas, Tokyo Gas, Jera

Where: Barrow Island, Australia

In 2019 CCS operations began at one of Australia’s largest liquified natural gas production facilities, located off the Western coast. Here, CO2 is removed from natural gas before the gas is cooled to -162oC, turning it into a liquid.

The removed CO2 is then injected via wells into the Dupuy Formation, a saline aquifer 2km underneath Barrow Island.

Once fully operational (estimated to be in 2020), the project aims to reduce the facility’s emissions by about 40% and plans to store between 3.4 and 4 million tonnes of CO2 each year.

Quest

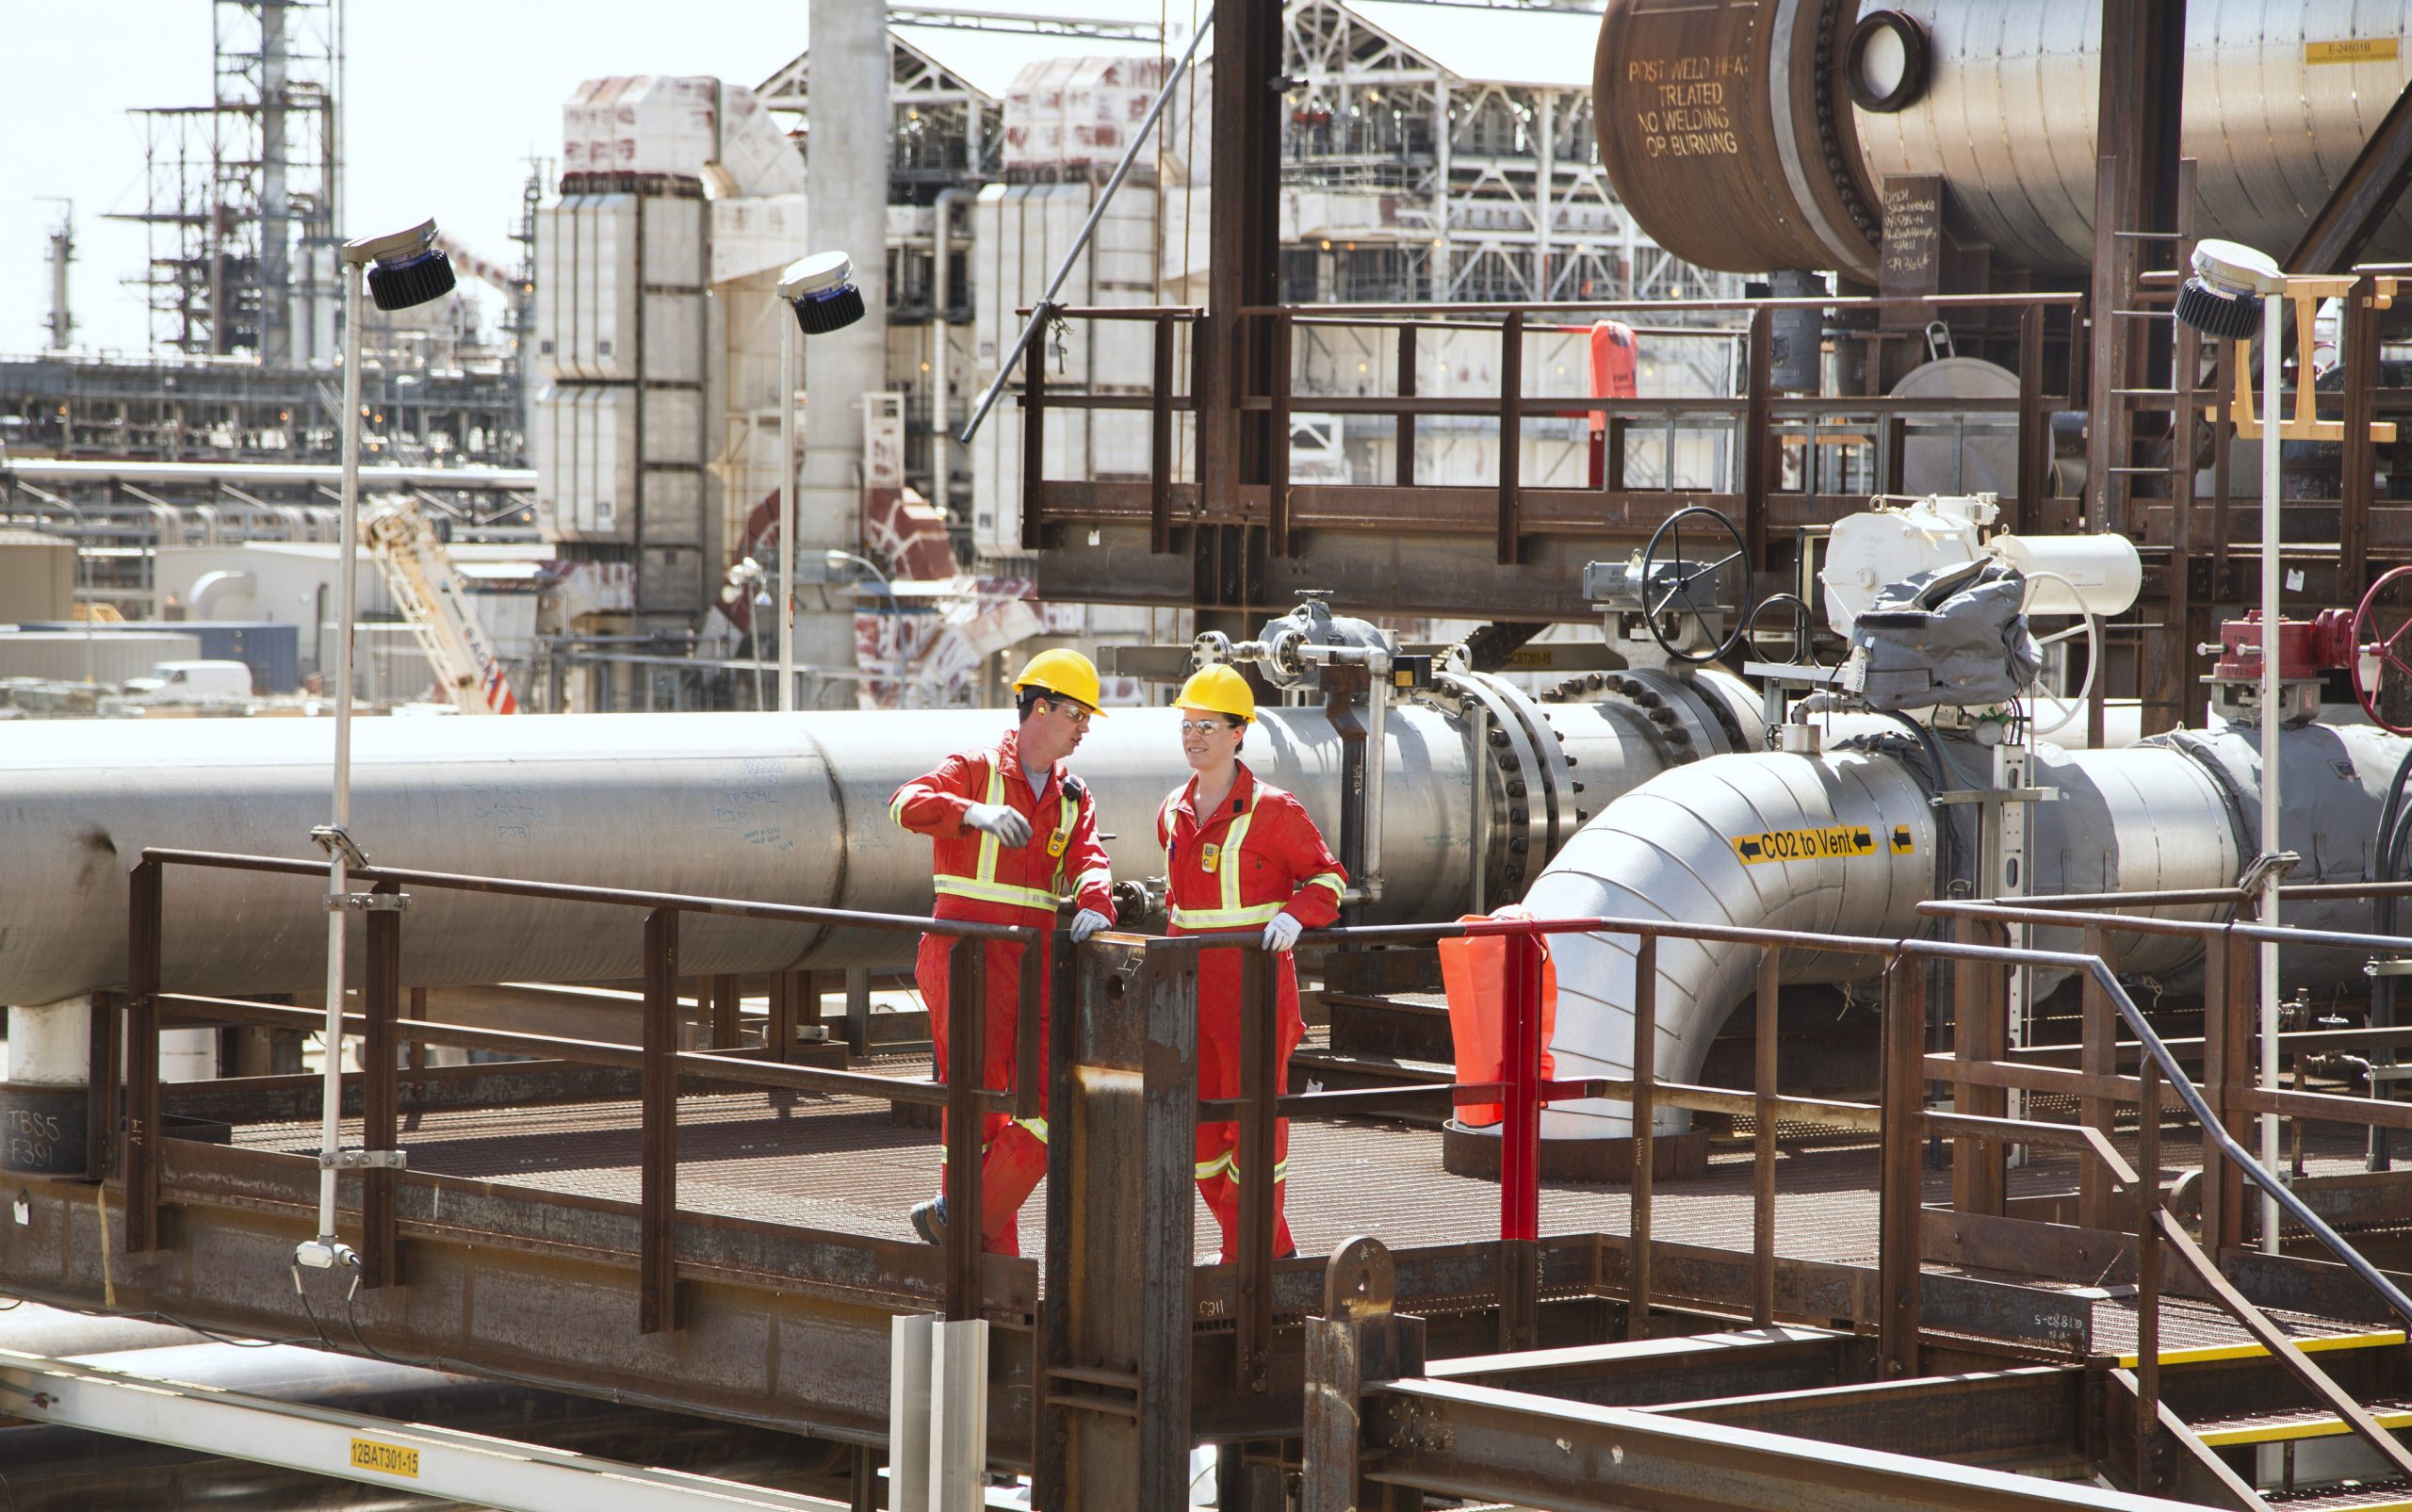
Shell’s Quest carbon capture facility, Alberta, Canada

Who: Operated by Shell, owned by Chevron and Canadian Natural Resources

Where: Alberta, Canada

The Scotford Upgrader facility in Canada’s oil sands uses hydrogen to upgrade bitumen (a substance similar to asphalt) to make a synthetic crude oil.

In 2015, the Quest carbon capture facility was added to Scotford Upgrader to capture the CO2 created as a result of making the site’s hydrogen. Once captured, the CO2 is pressurised and turned into a liquid, which is piped and stored 60km away in the Basal Cambrian Sandstone saline aquifer.

Over its four years of crude oil production, four million tonnes of CO2 have been captured. It is estimated that, over its 25-year life span, this CCS technology could capture and store over 27 million tonnes of CO2.

Chevron estimates that if the facility were to be built today, it would cost 20-30% less, a sign of the falling cost of the technology.

Boundary Dam

Who: SaskPower

Where: Saskatchewan, Canada

Boundary Dam, a coal-fired power station, became the world’s first post-combustion CCS facility in 2014.

The technology uses Shell’s Cansolv solvent to remove CO2 from the exhaust of one of the power station’s 115 MW units. Part of the captured CO2 is used for EOR, while any unused CO2 is stored in the Deadwood Formation, a brine and sandstone reservoir, deep underground.

As of December 2019, more than three million tonnes of CO2 had been captured at Boundary Dam. The continuous improvement and optimisations made at the facility are proving CCS technology at scale and informing CCS projects around the world, including a possible retrofit project at SaskPower‘s 305 MW Shand Power Station.

Top image: Carbon capture facility at the Petra Nova coal-fired power plant, Texas, USA

Learn more about carbon capture, usage and storage in our series:

How biomass wood pellet mills can help landowners grow healthy forests

Working Forests US South

International Paper’s pulp and paper mill, located in the Morehouse parish of Louisiana, had been in operation since 1927 and was once the largest employer in the area. However, as a result of the global recession of 2008, the company was forced to lay off over 550 employees and shut the facility. Other mills in the area have also reduced production including Georgia Pacific which let go around 530 people at its Crossett, Arkansas plant 18 miles to the north of Morehouse in 2019.

For an area dominated by forests, such as Northern Louisiana and Southern Arkansas, this decline in traditional markets came as a serious blow. It’s a region where a healthy market for wood products is vital for the local economy and, in turn, the health of the region’s forests. Luckily other wood product manufacturers and industries have since began to fill the gap.

Engineers in front of wood pellet storage silos at Drax's Morehouse BioEnergy biomass manufacturing facility in northern Louisiana

Engineers in front of wood pellet storage silos at Drax’s Morehouse BioEnergy biomass manufacturing facility in northern Louisiana

Drax Biomass has opened a mill in Morehouse parish that uses some of the the low-grade wood previously used to supply the paper industry to produce compressed wood pellets, which are used to generate renewable electricity in the UK.

Commissioned in 2015, the plant employs 74 people and can produce as much as 525,000 metric tonnes of biomass pellets a year. This makes it an important facility for local employment and the wood market in the region. However, to ensure it is positively contributing to the area and its environment, the demand for wood must be sustainably managed.

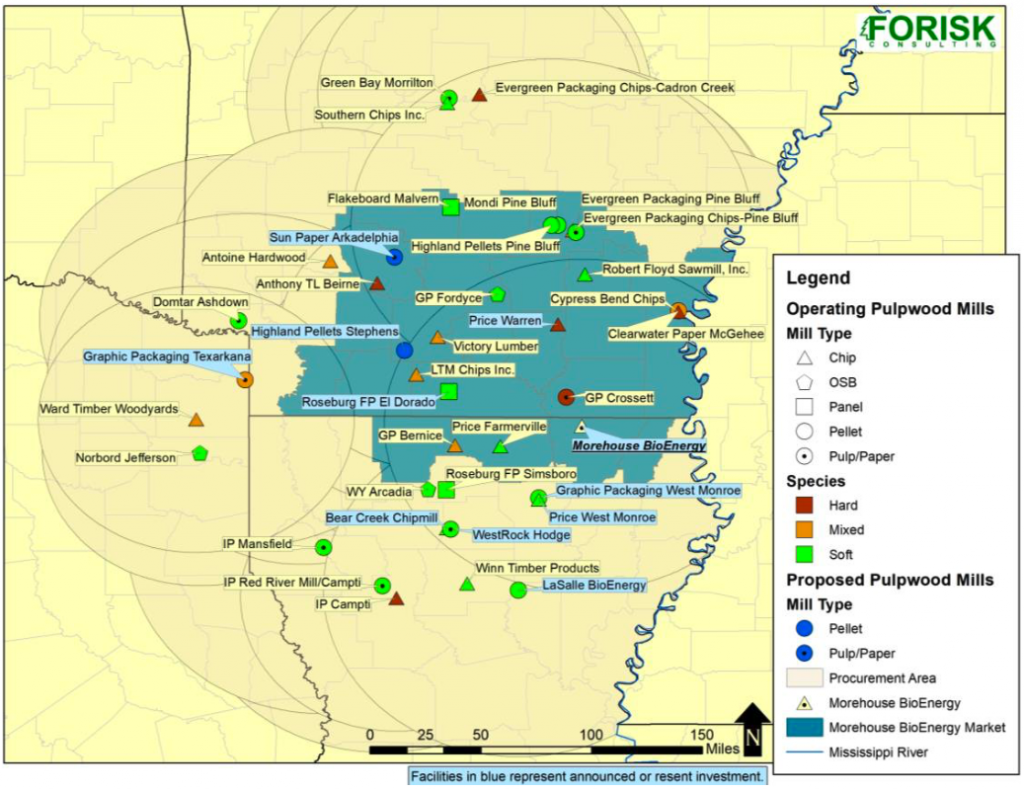
Morehouse BioEnergy sources low-grade wood from a catchment area that covers a 60-mile radius and includes 18 counties in Arkansas and four in Louisiana.

As Drax Biomass doesn’t own any of the forests it sources wood products from, it regularly examines the environmental impact of its pellet mills on the forests and markets in which it operates. The aim is to ensure the biomass used by Drax to generate 12% of Great Britain’s renewable electricity is sustainably sourced and does not contribute to deforestation or other negative climate and environment impacts.

A new report by forestry research and consulting firm Forisk evaluates the impact of biomass pellet demand from Morehouse BioEnergy on the forests and wood markets within the mill’s catchment area.

Map of pulpwood-using mills near Morehouse timber market

Map of pulpwood-using mills near Morehouse timber market

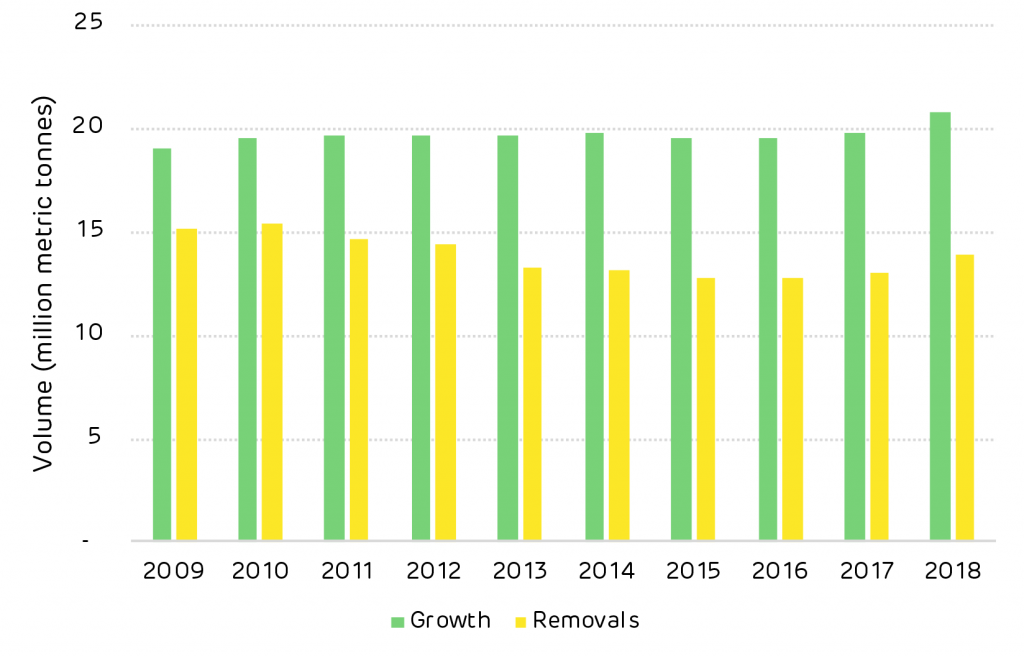
It found that biomass demand in the region does not contribute to deforestation, nor increase forest harvesting above a sustainable level. Overall, growth of the region’s pine timberland, which supplies Morehouse BioEnergy, continues to exceed removals, pointing to expanding forest carbon and wood inventory.

Annual growth compared to harvesting removals

Annual growth compared to harvesting removals

Growing forests and increasing timber stocks

The study focuses on timberland – working forests – in the plant’s sourcing area, which the US Forestry Service categorises as productive land capable of providing timber on an industrial scale.

The timberland here is made up of 63% softwood trees, which includes pines, and 37% hardwoods such as oak. Pellet manufacturing as a whole (including other pellet producers in the area), accounts for only 6% of the demand for wood products in the region. Of that, Morehouse BioEnergy contributes to 4% of total pellet demand.

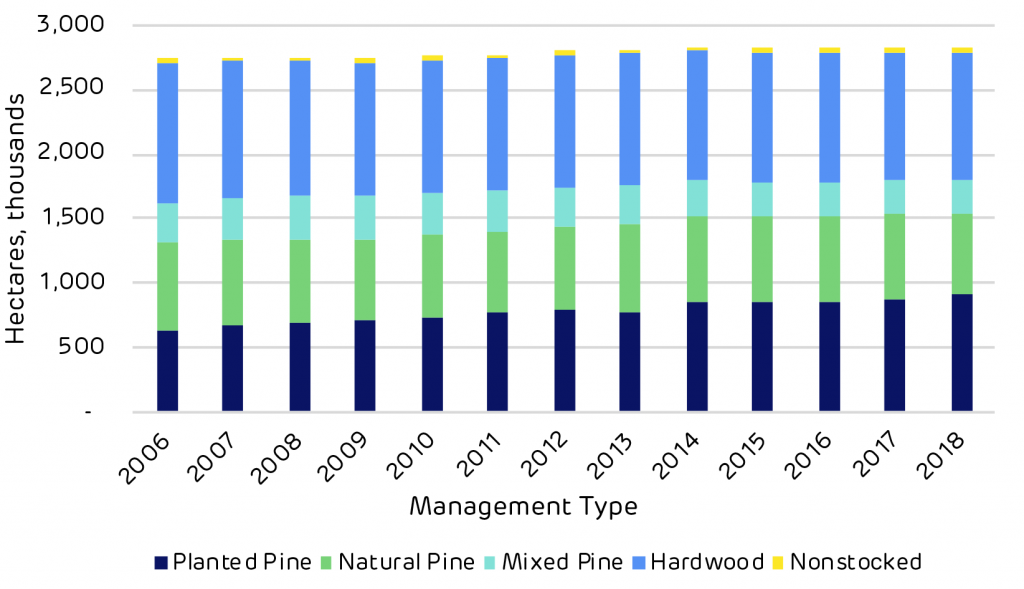
Total area of timberland

Total area of timberland

Lumber – such as sawtimber – makes up the bulk of demand for wood products, accounting for 46% of total demand, largely as a result of its high market value and landowners’ aims to extract maximum revenue from their pine stands.

However, the less valuable wood – parts of trees that are misshapen, too short or thin to be used for lumber – can be sold at a lower price to biomass pellet mills. This wood might previously have been sold to paper and pulp mills exclusively, but with International Paper’s departure, Morehouse BioEnergy now fills a part of that role.

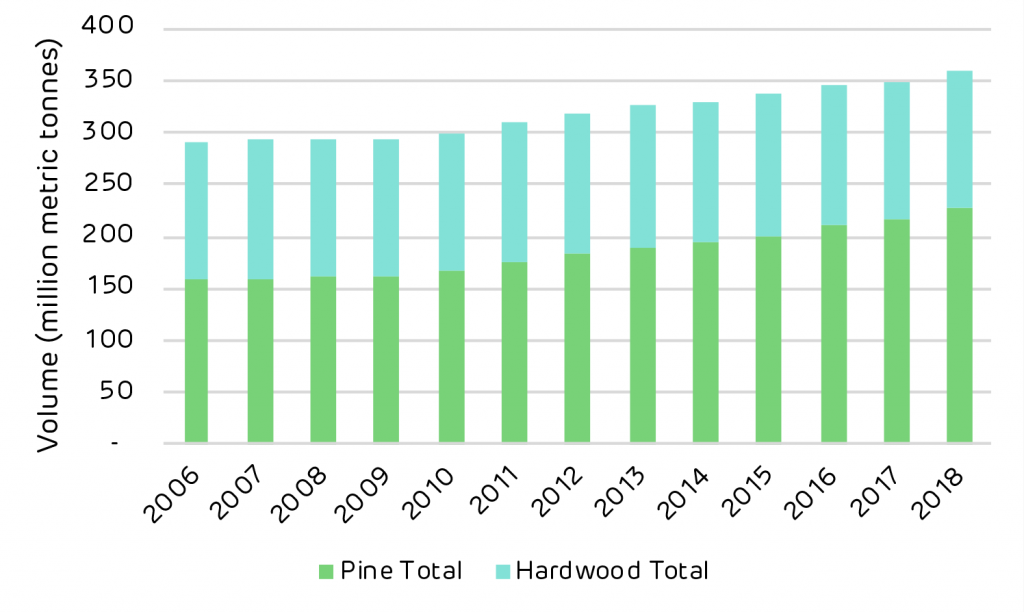
Total volume of growing stock on timberland

Total volume of growing stock on timberland

Maintaining healthy markets for both high and low-value wood is key to enabling landowners to reforest areas once they have been harvested in the knowledge it will provide a valuable return in the future. Ultimately, however, the way forests are maintained depends on the individual landowners and how they want to use their land.

The advantages of corporate ownership

Morehouse BioEnergy’s catchment area covers 28,000 square kilometres of timberland, within which 96% of the timber is privately owned. While some of that is owned by families with small patches of productive land, 54% is held by corporate owners. This includes businesses such as real estate investment trusts (REITs) and timber investment management organisations (TIMOs), which advise institutional investors on how to manage their forest assets.

This high percentage of corporate ownership influences forest management and replanting, as owners look to maximise the value of forests and seek to continue to generate returns from their land.

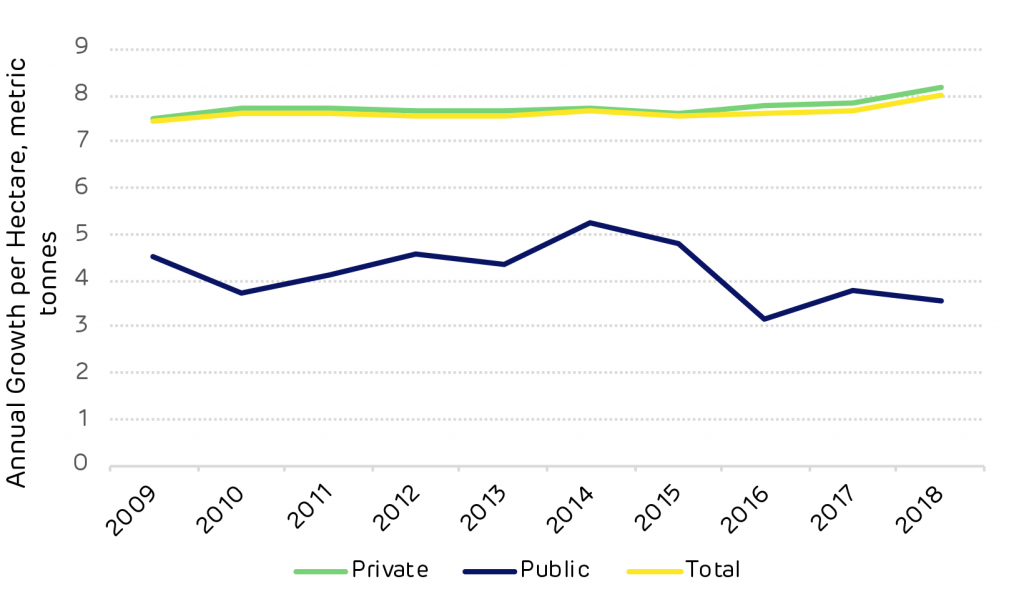
“In general, corporate owners are spending more money on silviculture and actively managing their timber stands,” explains Forisk Consulting Partner Amanda Lang. “They are investing more in fertiliser, their seedlings and harvest control on pine stands, because that leads to larger trees of a higher quality and more profit in the long run.” This is reflected in the higher growth rates found in the private sector, leading to faster rates of carbon sequestration.

Annual growth per hectare by owner type

Annual growth per hectare by owner type

Smaller private landowners, meanwhile, may have other objectives for their land like recreation and hunting, in addition to timber income. As a result, some owners may be less inclined to intensively manage their timber stands, forgoing fertilisation and competition control (due to cost) and might harvest on a less regular basis. Although these landowners may not be maximising the productivity of their timber resource to the same degree corporate owners do, their unique management often contribute to greater diversity on the landscape.

Demand and forest health

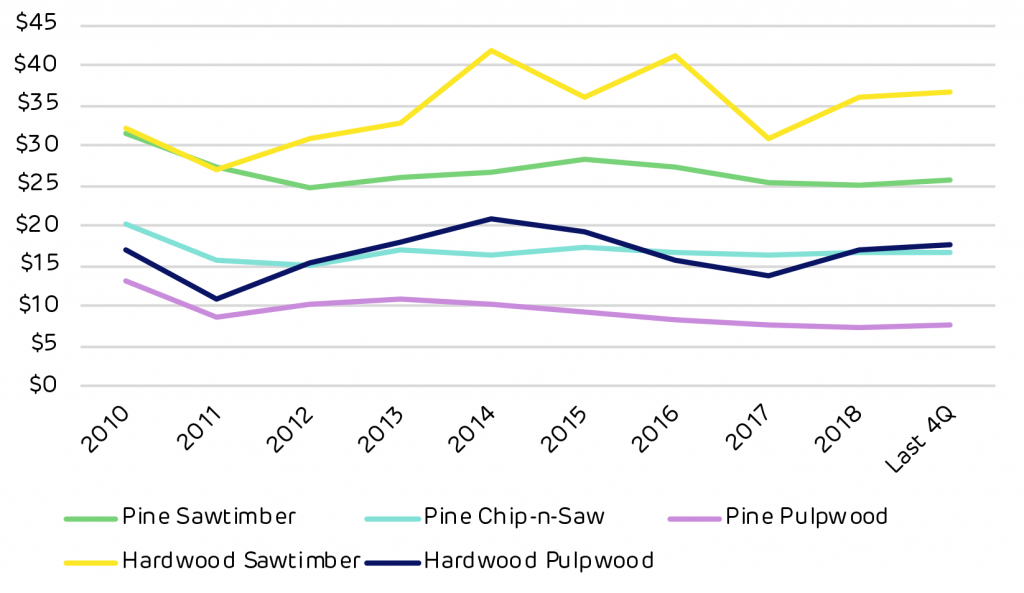
In 2018 the annual average price for a metric tonne of pine sawtimber in Morehouse BioEnergy’s catchment area was $25.71, down from a 10-year high of $31.60 in 2010. Similarly, pine pulpwood, from which biomass pellets are made, was valued at $7.75 per metric tonne in 2018, down from a 10-year high of $13 in 2010.

These low wood prices have caused many landowners to delay harvesting forests in hopes for a more lucrative wood price. As a result, pine timber inventories have grown across Morehouse BioEnergy’s catchment area. In 2010 the US Forest Service counted more than 167 million metric tonnes of pine inventory. By 2018 this had increased by more than 35% to reach 226 million.

Morehouse BioEnergy market historic stumpage prices, $/metric tonne

Morehouse BioEnergy market historic stumpage prices, $/metric tonne

The report suggests this price slump is an ongoing result of the 2008 recession, which greatly affected US house construction – one of the primary uses of sawtimber and many other types of wood products in the US. Some areas have already seen sawtimber prices increase as they recover from the recession, however, the report suggests this is not spread evenly on a national level.

The inventory overhang in Morehouse BioEnergy’s catchment area is expected to begin reversing in 2024 or 2025, as Lang explains: “We expect inventories to increase for a few more years and then start to decline. That said, inventories will remain higher than pre-recession levels.”

While high inventories suggest an abundant resource, lower inventory volumes are not indicative of declining or unhealthy forests. Rather, they can point to younger, growing forests that have recently been replanted, which will later grow to higher inventory volumes as they mature. Both suggest a healthy forestry industry in which landowners continue to reinvest in forests.

Overall, the analysis of the region points to healthy, growing forests and, importantly, a sustainable industry from which Drax can responsibly source biomass pellets. Ensuring the biomass used at Drax Power Station is sustainably sourced is crucial to its generation of renewable, carbon-neutral electricity, and in turn laying the path to negative emissions.

Read the full report: Morehouse, Louisiana Catchment Area Analysis. A short summary of its analysis and conclusions, written by our forestry team, can be read here. Explore every delivery of wood to Morehouse BioEnergy using our ForestScope data transparency tool.

Morehouse catchment area analysis

Working forest in southern Arkansas within the Morehouse catchment area

The forest area around the Drax Morehouse BioEnergy plant has a long history of active management for timber production. 96% of the forest owners are private and around half of these are corporate investors seeking a financial return from forest management. The pulp and paper (p&p) sector dominates the market for low grade roundwood with over 75% of the total demand. The wood pellet markets use only 6% of the roundwood, of which 4% is used by Morehouse.

Given the small scale of demand in the pellet sector, the extent of influence is limited. However, the new pellet markets have had a positive impact, replacing some of the declining demand in the p&p sector and providing a market for thinnings for some forest owners and a new off-take for sawmill residues.

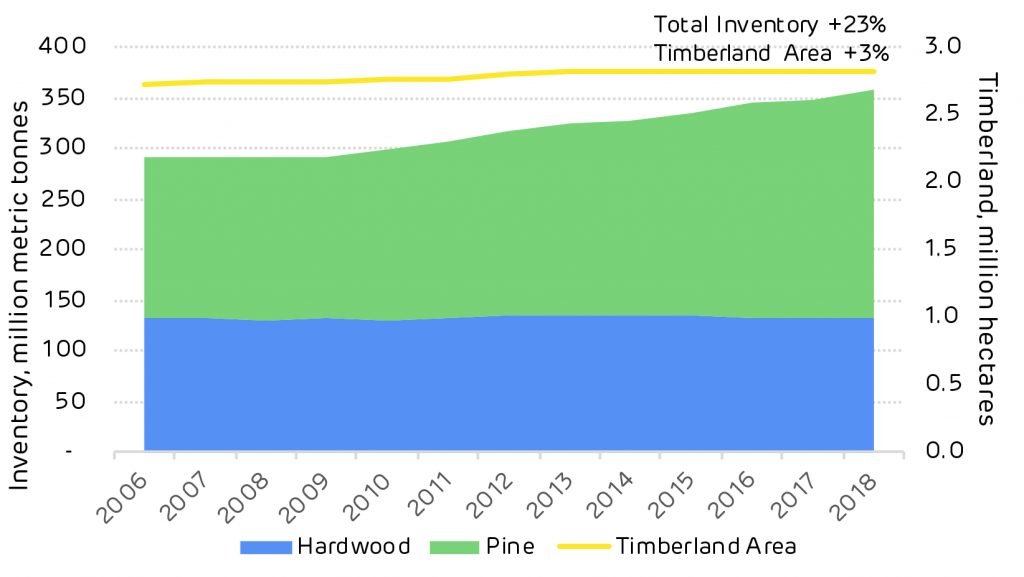
Pine forest is dominant in this area with an increasing inventory (growing stock) despite a stable forest area. Active management of pine forests has increased the amount of timber stored in the standing trees by 68 million tonnes from 2006 to 2018.  Over the same period the hardwood inventory remained static.

Chart showing historic inventory and timberland area in Morehouse catchment

Historic inventory and timberland area in Morehouse catchment; click to view/download.

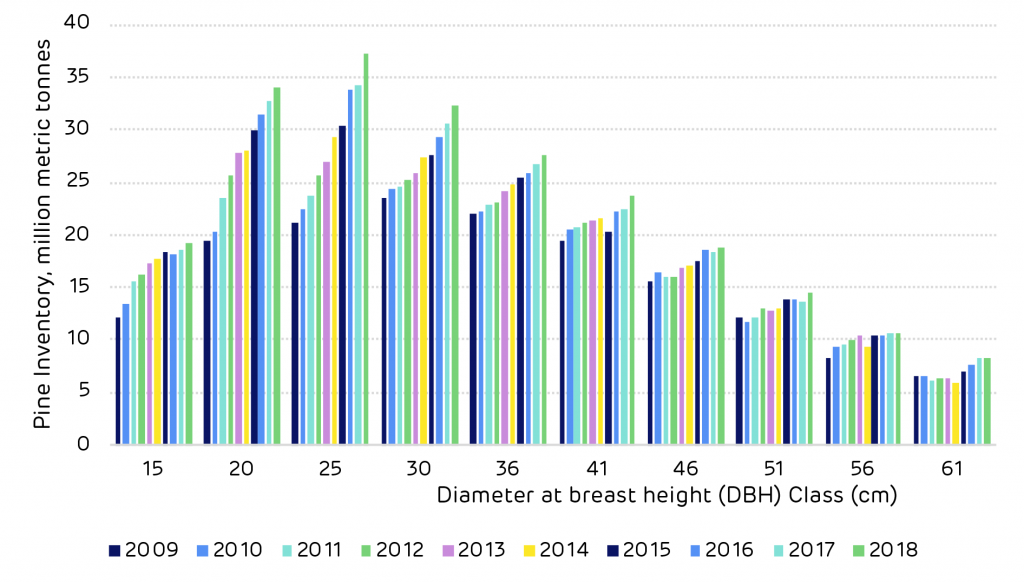
US Forest Service FIA data shows that the pine resource in this catchment area has been maturing, the volume of timber has been increasing in each size class year on year. This means that the volume available for harvesting is increasing and that more markets will be required to utilise this surplus volume and ensure that the long-term future of the forest area can be maintained.

Chart showing historic pine inventory by DBH Class

Historic pine inventory by DBH Class in Morehouse catchment; click to view/download.

This is reflected in the growth drain ratio – the comparison of annual growth versus harvesting. A ratio of one shows a forest area in balance, less than one shows that harvesting is greater than growth. This can be the case when the forest area is predominantly mature and at the age when clear cutting is necessary.

A growth drain ratio of more than one shows that growth exceeds harvesting, this is typically the case in younger forests that are not yet ready for harvesting and are in the peak growing phase, but it can also occur when insufficient market demand exists and owners are forced to retain stands for longer in the absence of a viable market.

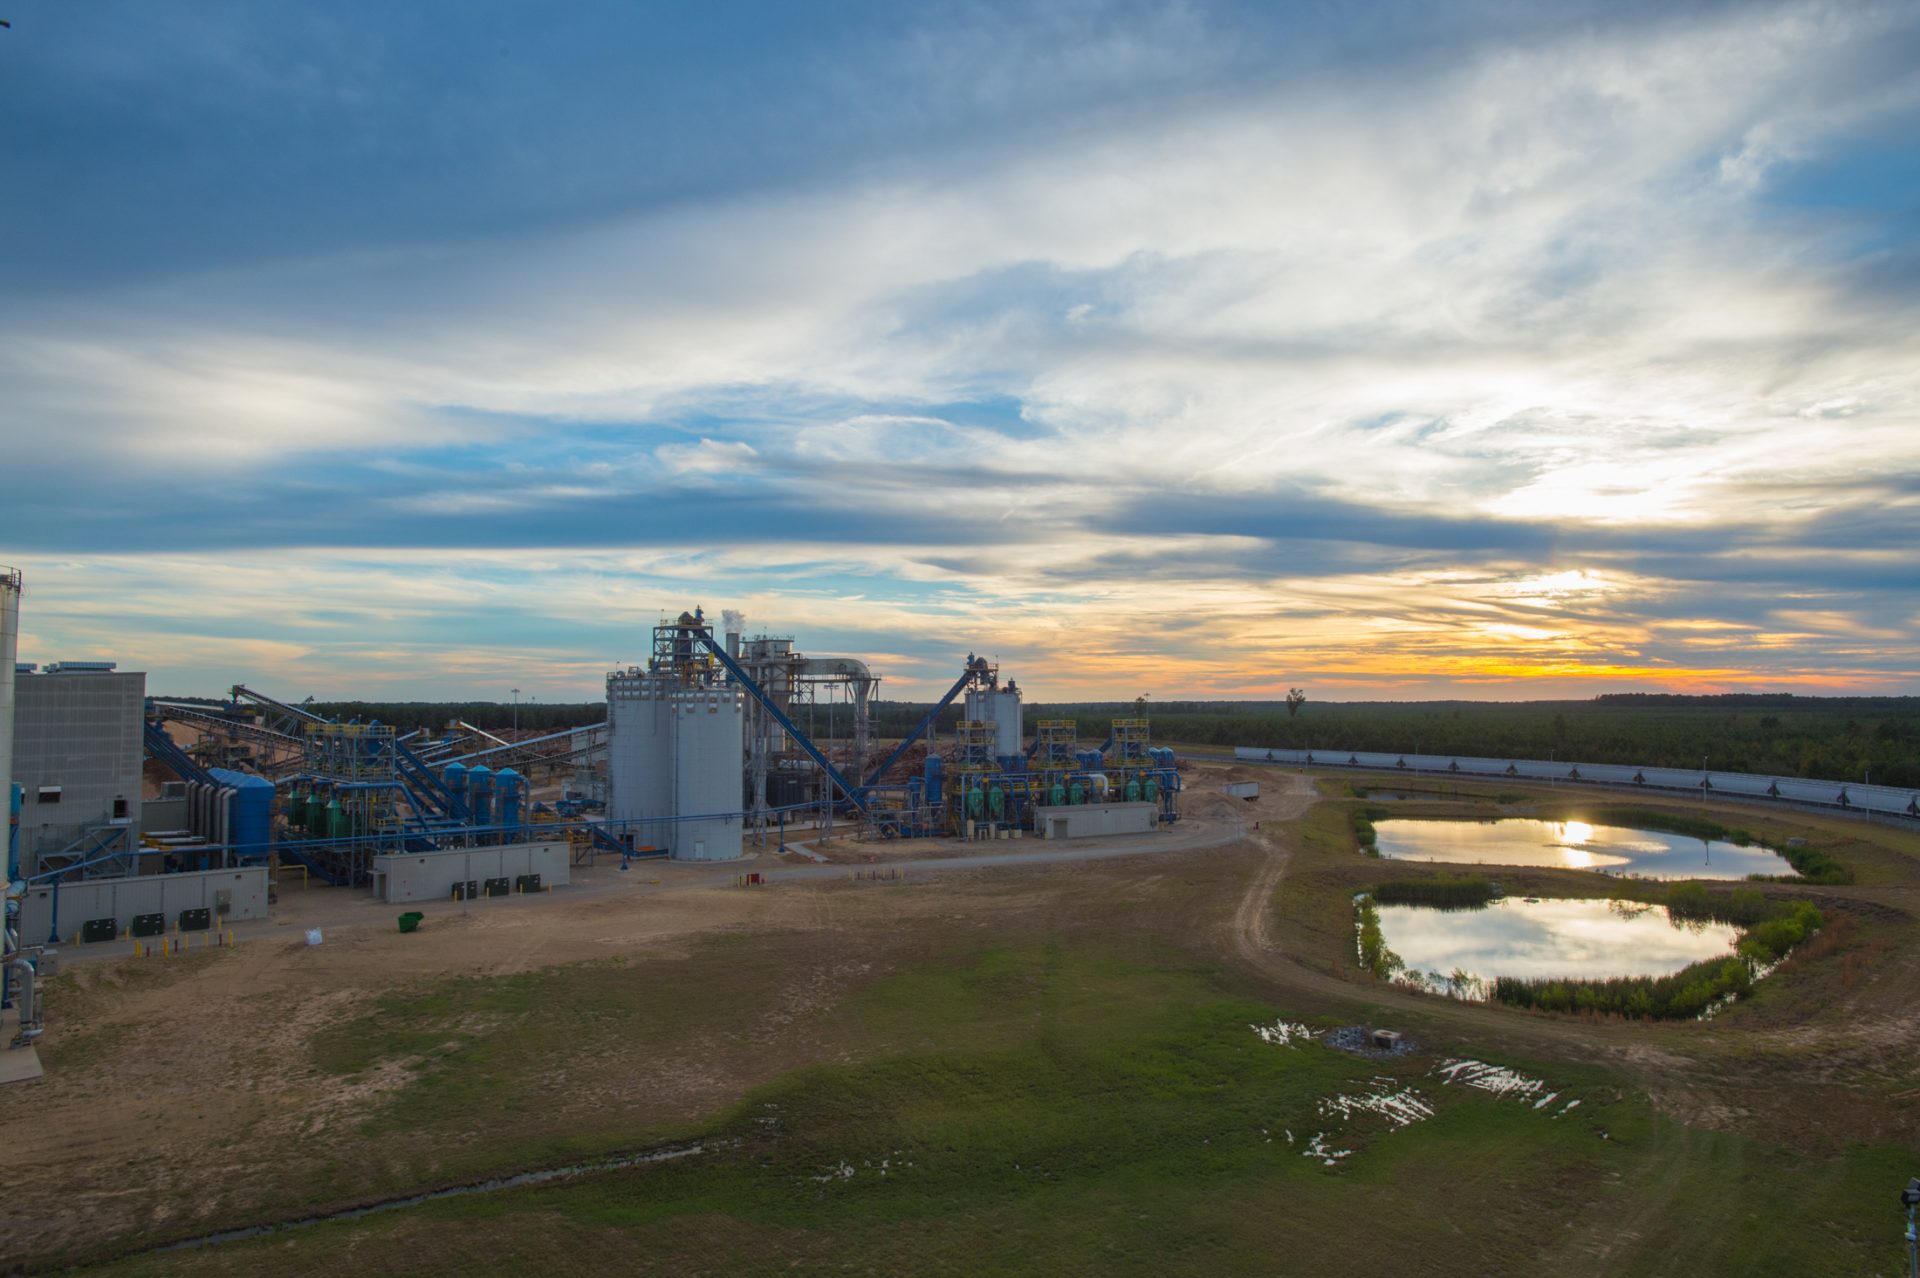
Drax Morehouse plant

Drax’s Morehouse BioEnergy compressed wood pellet plant in northern Louisiana

This can have a negative impact on the future growth of the forest; limiting the financial return to forest owners and reducing the cumulative sequestration of carbon by enforcing sub-optimal rotation lengths.

The current growth drain ratio of pine around Morehouse is 1.67 with an average annual surplus of around 7 million metric tonnes. This surplus of growth is partly due to a decline in saw-timber demand due to the global financial crisis but also due to the maturing age class of the forest resource and the increasing quantity of timber available for harvesting.

Historic growth and removals of pine in Morehouse catchment (million metric tonnes)

YearGrowthRemovalsNet GrowthGrowth-to-Drain
200914.112960762411.1860124622.92694830041.26166145535
201014.580331100610.91819493463.662136166021.33541589869
201115.129903273610.72162297824.408280295451.41115792865
201215.357258404710.30755904395.049699360811.48990254039
201315.63898206189.701617808065.93736425371.61199733603
201415.91041518229.376564771556.533850410651.69682773701
201515.94235364499.669133266476.273220378431.64878828387
201616.43527840789.579357241816.855921165961.71569740985
201716.838075354610.1594737396.678601615681.65737672908
201817.770968348910.65938820047.111580148561.66716588371

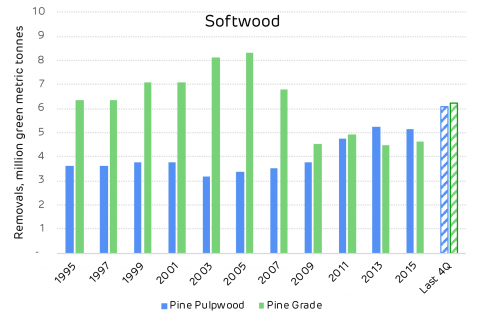
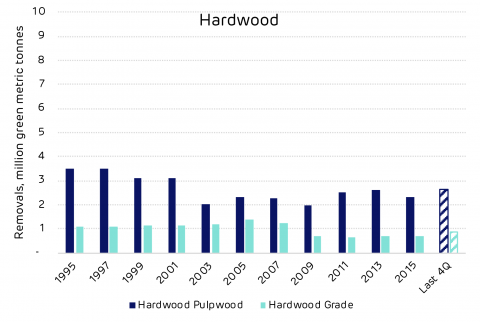
The chart below shows the decline in pine saw-timber demand in the catchment area following the financial crisis in 2008. It also shows the recent increase in pulpwood demand driven by the new pellet mill markets that have supplemented the declining p&p mills.

Sawmills are a vital component of the forest industry around Morehouse, with most private owners seeking to maximise revenue through saw-timber production from pine forests.

As detailed in the table below, there are 70 markets for higher value timber products around this catchment area. These mills also need an off-taker for their residues and the pellet mills can provide a valuable market for this material, increasing the viability of the saw-timber market.

Operating grade-using facilities near Morehouse timber market

TypeNumber of MillsCapacityCapacity UnitsHardwood Roundwood At Mill From MarketSoftwood Roundwood At Mill From Market
Consumption, million green metric tonnes
Lumber6810538.8235294M m³1.737194320550.88604623042613.06745552335.69986977638
Plywood/Veneer2904M m³000.9617438725360.506109617373
Total701.737194320550.88604623042614.02919939586.20597939376

Pulp and paper mills dominate the low grade roundwood market for both hardwood and softwood. The pellet mill market is small with just 3 mills and therefore does not influence forest management decisions or macro trends in the catchment area. However, demand for wood pellet feedstock exceeds 1.5 million tonnes p.a. and this can provide a valuable market for thinnings and sawmill residues. A healthy forest landscape requires a combination of diverse markets co-existing to utilise the full range of forest products.

Operating pulpwood-using facilities near Morehouse timber market

TypeNumber of MillsCapacityCapacity UnitsHardwood Roundwood At Mill From MarketSoftwood Roundwood At Mill From Market
Consumption, million green metric tons
Pulp/Paper117634.86896M metric tons3.489826926741.192570970097.557287050371.66598821268
OSB/Panel62412.55M m³002.567325398621.19890681942
Chips178395.08999M metric tons2.938909722111.46484421365.287607151192.18745126814
Pellets31573.965975M metric tons002.078219858451.01128896402
Total346.428736648862.6574151836917.49043945866.06363526426

In its analysis, Forisk Consulting considered the impact that the new pellet mills including Morehouse BioEnergy have had on the significant trends in the local forest industry. The tables below summarise the Forisk view on the key issues. In its opinion, the Morehouse plant has had no negative impact.

Bioenergy impacts on markets and forest supplies in the Morehouse market

ActivityIs there evidence that bioenergy demand has caused the following?Explanation
DeforestationNo
Change in forest management practiceNo
Diversion from other marketsPossiblyBioenergy plants compete with pulp/paper and OSB mills for pulpwood and residual feedstocks. There is no evidence that these facilities reduced production as a result of bioenergy markets, however.
Increase in wood priceNoThere is no evidence that bioenergy demand increased stumpage prices in the market.
Reduction in growing stocking timberNo
Reduction in sequestration of carbon / growth rateNo
Increasing harvesting above the sustainable yieldNo

Bioenergy impacts on forests markets in the Morehouse market

Forest metric Bioenergy impact
Growing Stock Neutral
Growth Rates Neutral
Forest Area Neutral
Wood Prices Neutral
Markets for Solid Wood Neutral to Positive*
*Access to viable residual markets benefits users of solid wood (i.e. lumber producers).

Read the full report: Morehouse, Louisiana Catchment Area Analysis. An interview with the co-author, Amanda Hamsley Lang, COO and partner at Forisk Consulting, can be read here. Explore every delivery of wood to Morehouse BioEnergy using our ForestScope data transparency tool.

This is part of a series of catchment area analyses around the forest biomass pellet plants supplying Drax Power Station with renewable fuel. Others in the series include: ,

Others in the series include: Georgia MillEstonia, Latvia, Chesapeake and Drax’s own, other three mills LaSalle BionergyMorehouse Bioenergy and Amite Bioenergy.

What is net zero?

Skyscraper vertical forest in Milan

For age-old rivals Glasgow and Edinburgh, the race to the top has taken a sharp turn downwards. Instead, they’re in a race to the bottom to earn the title of the first ‘net zero’ carbon city in the UK.

While they might be battling to be the first in the UK to reach net zero, they are far from the only cities with net zero in their sights. In the wake of the growing climate emergency, cities, companies and countries around the world have all announced their own ambitions for hitting ‘net zero’.

It has become a global focus based on necessity – for the world to hit the Paris Agreement targets and limit global temperature rise to under two degrees Celsius, it’s predicted the world must become net zero by 2070.

Yet despite its ubiquity, net zero is a term that’s not always fully understood. So, what does net zero actually mean?

Glasgow, Scotland. Host of COP26.

What does net zero mean?

‘Going net zero’ most often refers specifically to reaching net zero carbon emissions. But this doesn’t just mean cutting all emissions down to zero.

Instead, net zero describes a state where the greenhouse gas (GHG) emitted [*] and removed by a company, geographic area or facility is in balance.

In practice, this means that as well as making efforts to reduce its emissions, an entity must capture, absorb or offset an equal amount of carbon from the atmosphere to the amount it releases. The result is that the carbon it emits is the same as the amount it removes, so it does not increase carbon levels in the atmosphere. Its carbon contributions are effectively zero – or more specifically, net zero.

The Grantham Research Institute on Climate Change and the Environment likens the net zero target to running a bath – an ideal level of water can be achieved by either turning down the taps (the mechanism adding emissions) or draining some of the water from the bathtub (the thing removing of emissions from the atmosphere). If these two things are equally matched, the water level in the bath doesn’t change.

To reach net zero and drive a sustained effort to combat climate change, a similar overall balance between emissions produced and emissions removed from the atmosphere must be achieved.

But while the analogy of a bath might make it sound simple, actually reaching net zero at the scale necessary will take significant work across industries, countries and governments.

How to achieve net zero

The UK’s Committee on Climate Change (CCC) recommends that to reach net zero all industries must be widely decarbonised, heavy good vehicles must switch to low-carbon fuel sources, and a fifth of agricultural land must change to alternative uses that bolster emission reductions, such as biomass production.

However, given the nature of many of these industries (and others considered ‘hard-to-treat’, such as aviation and manufacturing), completely eliminating emissions is often difficult or even impossible. Instead, residual emissions must be counterbalanced by natural or engineered solutions.

Natural solutions can include afforestation (planting new forests) and reforestation (replanting trees in areas that were previous forestland), which use trees’ natural ability to absorb carbon from the atmosphere to offset emissions.

On the other hand, engineering solutions such as carbon capture usage and storage (CCUS) can capture and permanently store carbon from industry before it’s released into the atmosphere. It is estimated this technology can capture in excess of 90% of the carbon released by fossil fuels during power generation or industrial processes such as cement production.

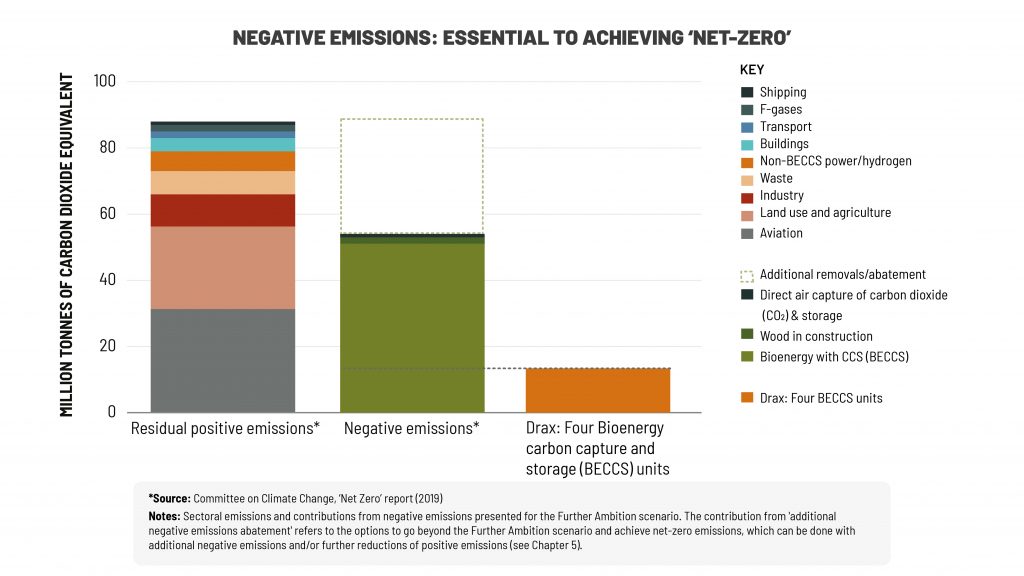
Negative emissions essential to achieving net zero

Click to view/download graphic. Source: Zero Carbon Humber.

Bioenergy with carbon capture and storage (BECCS) could actually take this a step further and lead to a net removal of carbon emissions from the atmosphere, often referred to as negative emissions. BECCS combines the use of biomass as a fuel source with CCUS. When that biomass comes from trees grown in responsibly managed working forests that absorb carbon, it becomes a low carbon fuel. When this process is combined with CCUS and the carbon emissions are captured at point of the biomass’ use, the overall process removes more carbon than is released, creating ‘negative emissions’.

According to the Global CCS Institute, BECCS is quickly emerging as the best solution to decarbonise emission-heavy industries. A joint report by The Royal Academy of Engineering and Royal Society estimates that BECCS could help the UK to capture 50 million tonnes of carbon per year by 2050 – eliminating almost half of the emissions projected to remain in the economy.

The UK’s move to net zero

In June 2019, the UK became the first major global economy to pass a law to reduce all greenhouse gas emissions to net zero by 2050. It is one of a small group of countries, including France and Sweden, that have enacted this ambition into law, forcing the government to take action towards meeting net zero.

Electrical radiator

Although this is an ambitious target, the UK is making steady progress towards it. In 2018 the UK’s emissions were 44% below 1990 levels, while some of the most intensive industries are fast decarbonising – June 2019 saw the carbon content of electricity hit an all-time low, falling below 100 g/kWh for the first time. This is especially important as the shift to net zero will create a much greater demand for electricity as fossil fuel use in transport and home heating must be switched with power from the grid.

Hitting net zero will take more than just this consistent reduction in emissions, however. An increase in capture and removal technologies will also be required. On the whole, the CCC predict an estimated 75 to 175 million tonnes of carbon and equivalent emissions will need to be removed by CCUS solutions annually in 2050 to fully meet the UK’s net zero target.

This will need substantial financial backing. The CCC forecasts that, at present, a net zero target can be reached at an annual resource cost of up to 1-2% of GDP between now and 2050. However, there is still much debate about the role the global carbon markets need to play to facilitate a more cost-effective and efficient way for countries to work together through market mechanisms.

Industries across the UK are starting to take affirmative action to work towards the net zero target. In the energy sector, projects such as Drax Power Station’s carbon capture pilots are turning BECCS increasingly into a reality ready to be deployed at scale.

Along with these individual projects, reaching net zero also requires greater cooperation across the industrial sectors. The Zero Carbon Humber partnership between energy companies, industrial emitters and local organisations, for example, aims to deliver the UK’s first zero carbon industrial cluster in the Humber region by the mid-2020s.

Nonetheless, efforts from all sectors must be made to ensure that the UK stays on course to meet all its immediate and long-term emissions targets. And regardless of whether or not Edinburgh or Glasgow realise their net zero goals first, the competition demonstrates how important the idea of net zero has become and society’s drive for real change across the UK.

Drax has announced an ambition to become carbon negative by 2030 – removing more carbon from the atmosphere than produced in our operations, creating a negative carbon footprint. Track our progress at Towards Carbon Negative.

[*] In this article we’ve simplified our explanation of net zero. Carbon dioxide (CO2) is the most abundant greenhouse gas (GHG). It is also a long-lived GHG that creates warming that persists in the long term. Although the land and ocean absorb it, a significant proportion stays in the atmosphere for centuries or even millennia causing climate change. It is, therefore, the most important GHG to abate. Other long-lived GHGs include include nitrous oxide (N2O, lifetime of circa 120 years) and some F-Gasses (e.g. SF6 with a lifetime of circa 3,200 years). GHGs are often aggregated as carbon dioxide equivalent (abbreviated as CO2e or CO2eq) and it is this that net zero targets measure. In this article, ‘carbon’ is used for simplicity and as a proxy for ‘carbon dioxide’, ‘CO2‘, ‘GHGs’ or ‘CO2e’.