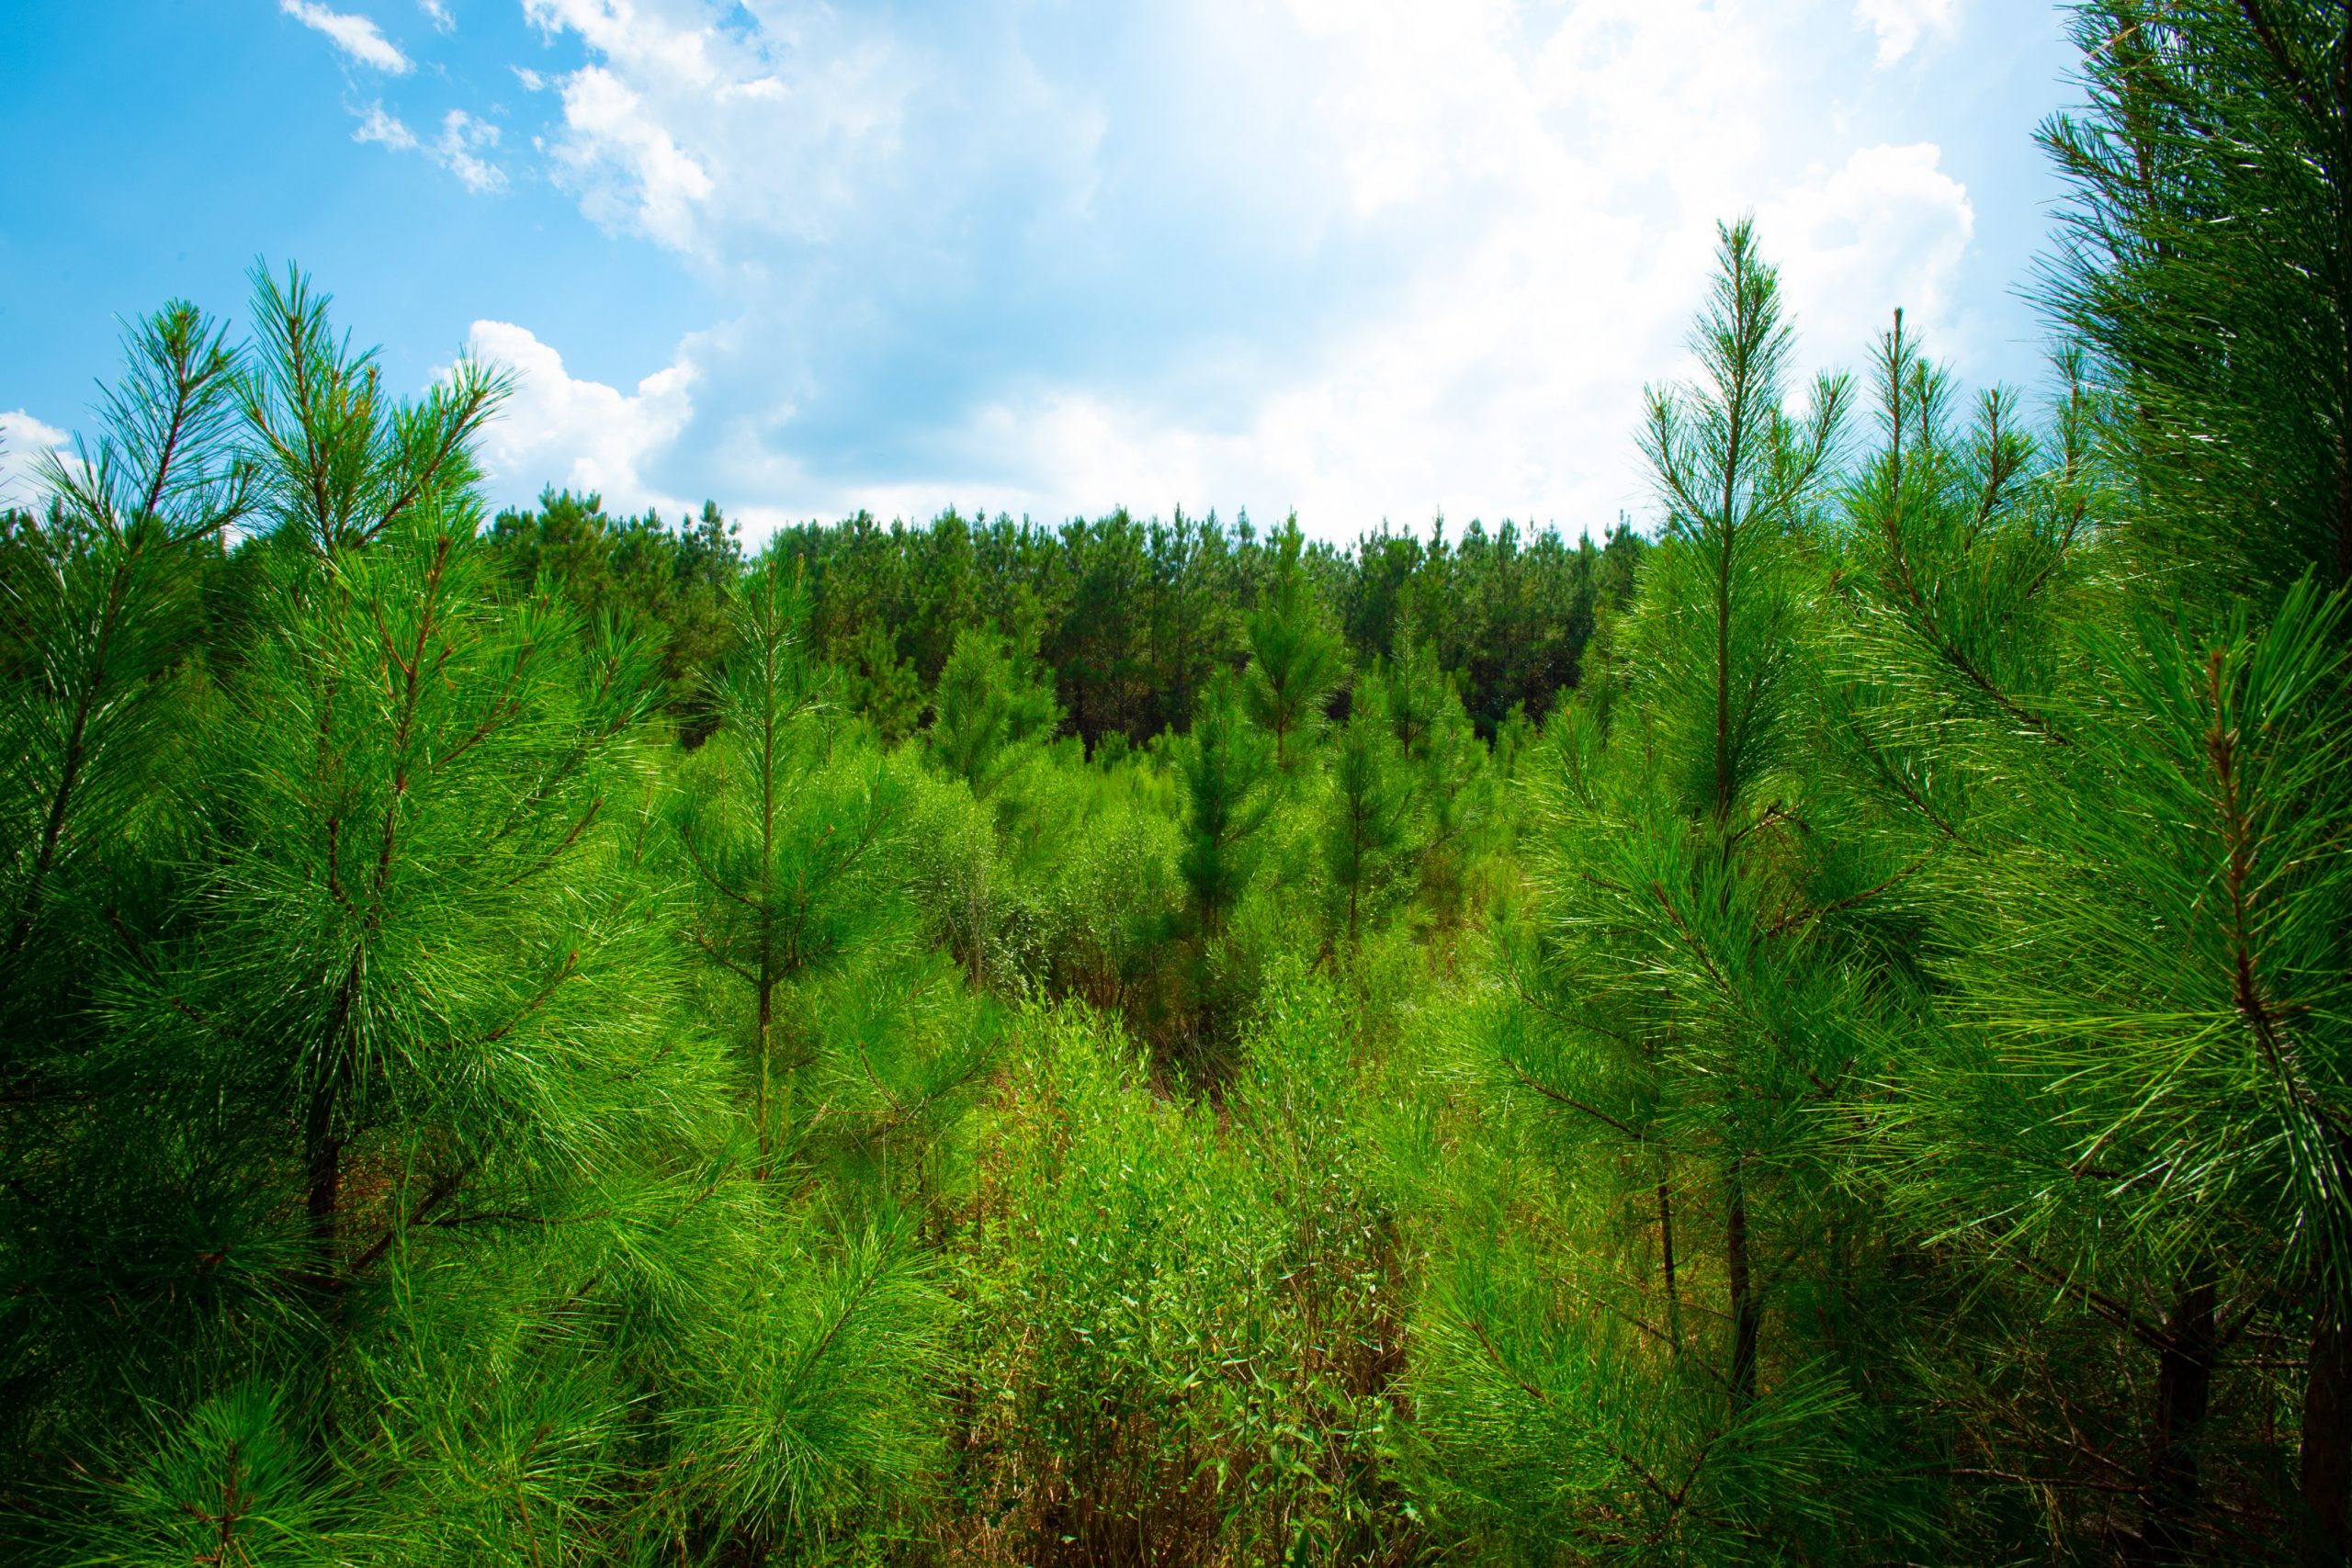
Tag: wood pellets

The world’s leading sustainable biomass generation and supply business

Today we completed a transformational deal – our acquisition of Canadian biomass pellet producer Pinnacle Renewable Energy.

I’m very excited about this important acquisition and welcoming our new colleagues to the Drax family – together we will build on what we have already achieved, having become the biggest decarbonisation project in Europe and the UK’s largest single site renewable power generator as a result of us using sustainable biomass instead of coal.

The deal positions Drax as the world’s leading sustainable biomass generation and supply business – making us a truly international business, trading biomass from North America to Europe and Asia. It also advances our strategy to increase our self supply, reduces our biomass production costs and creates a long-term future for sustainable biomass – a renewable energy source that the UN’s IPCC says will be needed to achieve global climate targets.

It’s also an important milestone in Drax’s ambition to become a carbon negative company by 2030 and play an important role in tackling the global climate crisis with our pioneering negative emissions technology BECCS.

That’s because increasing our annual production capacity of sustainable biomass while also reducing costs helps pave the way for our plans to use bioenergy with carbon capture and storage (BECCS) at Drax.

Negative emissions from BECCS are vital to address the global climate emergency while also providing the renewable electricity needed for a net zero economy, supporting jobs and clean growth in a post-Covid recovery.

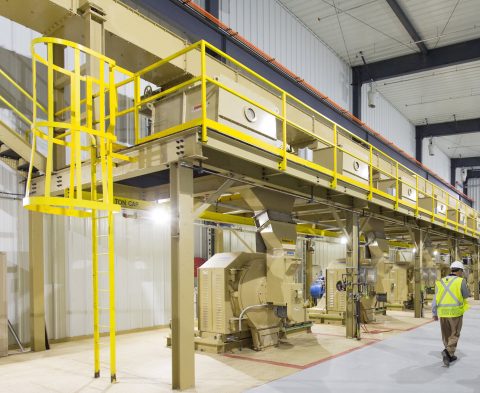
Inside a Pinnacle pellet mill

Inside a Pinnacle pellet mill

We already know Pinnacle well – it is one of our key suppliers and the company is a natural fit with Drax.

Our new colleagues have a wealth of operational and commercial expertise so I’m looking forward to seeing what we can achieve together.

We will benefit from Pinnacle’s scale, operational efficiency and low-cost fibre sourcing, that includes a high proportion of sawmill residues. In 2019, Pinnacle’s production cost was 20% lower than Drax’s.

Completing this deal will increase our annual production capacity to 4.9 million tonnes of sustainable biomass pellets at 17 plants in locations across Western Canada and the US South – up from 1.6Mt now.

It also expands our access to three major North American fibre baskets and four export facilities, giving us a large and geographically diversified asset base, which enhances our sourcing flexibility and security of supply.

This positions us well to take advantage of the global growth opportunities for sustainable biomass. The market for biomass wood pellets for renewable generation in Europe and Asia is expected to grow in the current decade, principally driven by demand in Asia.

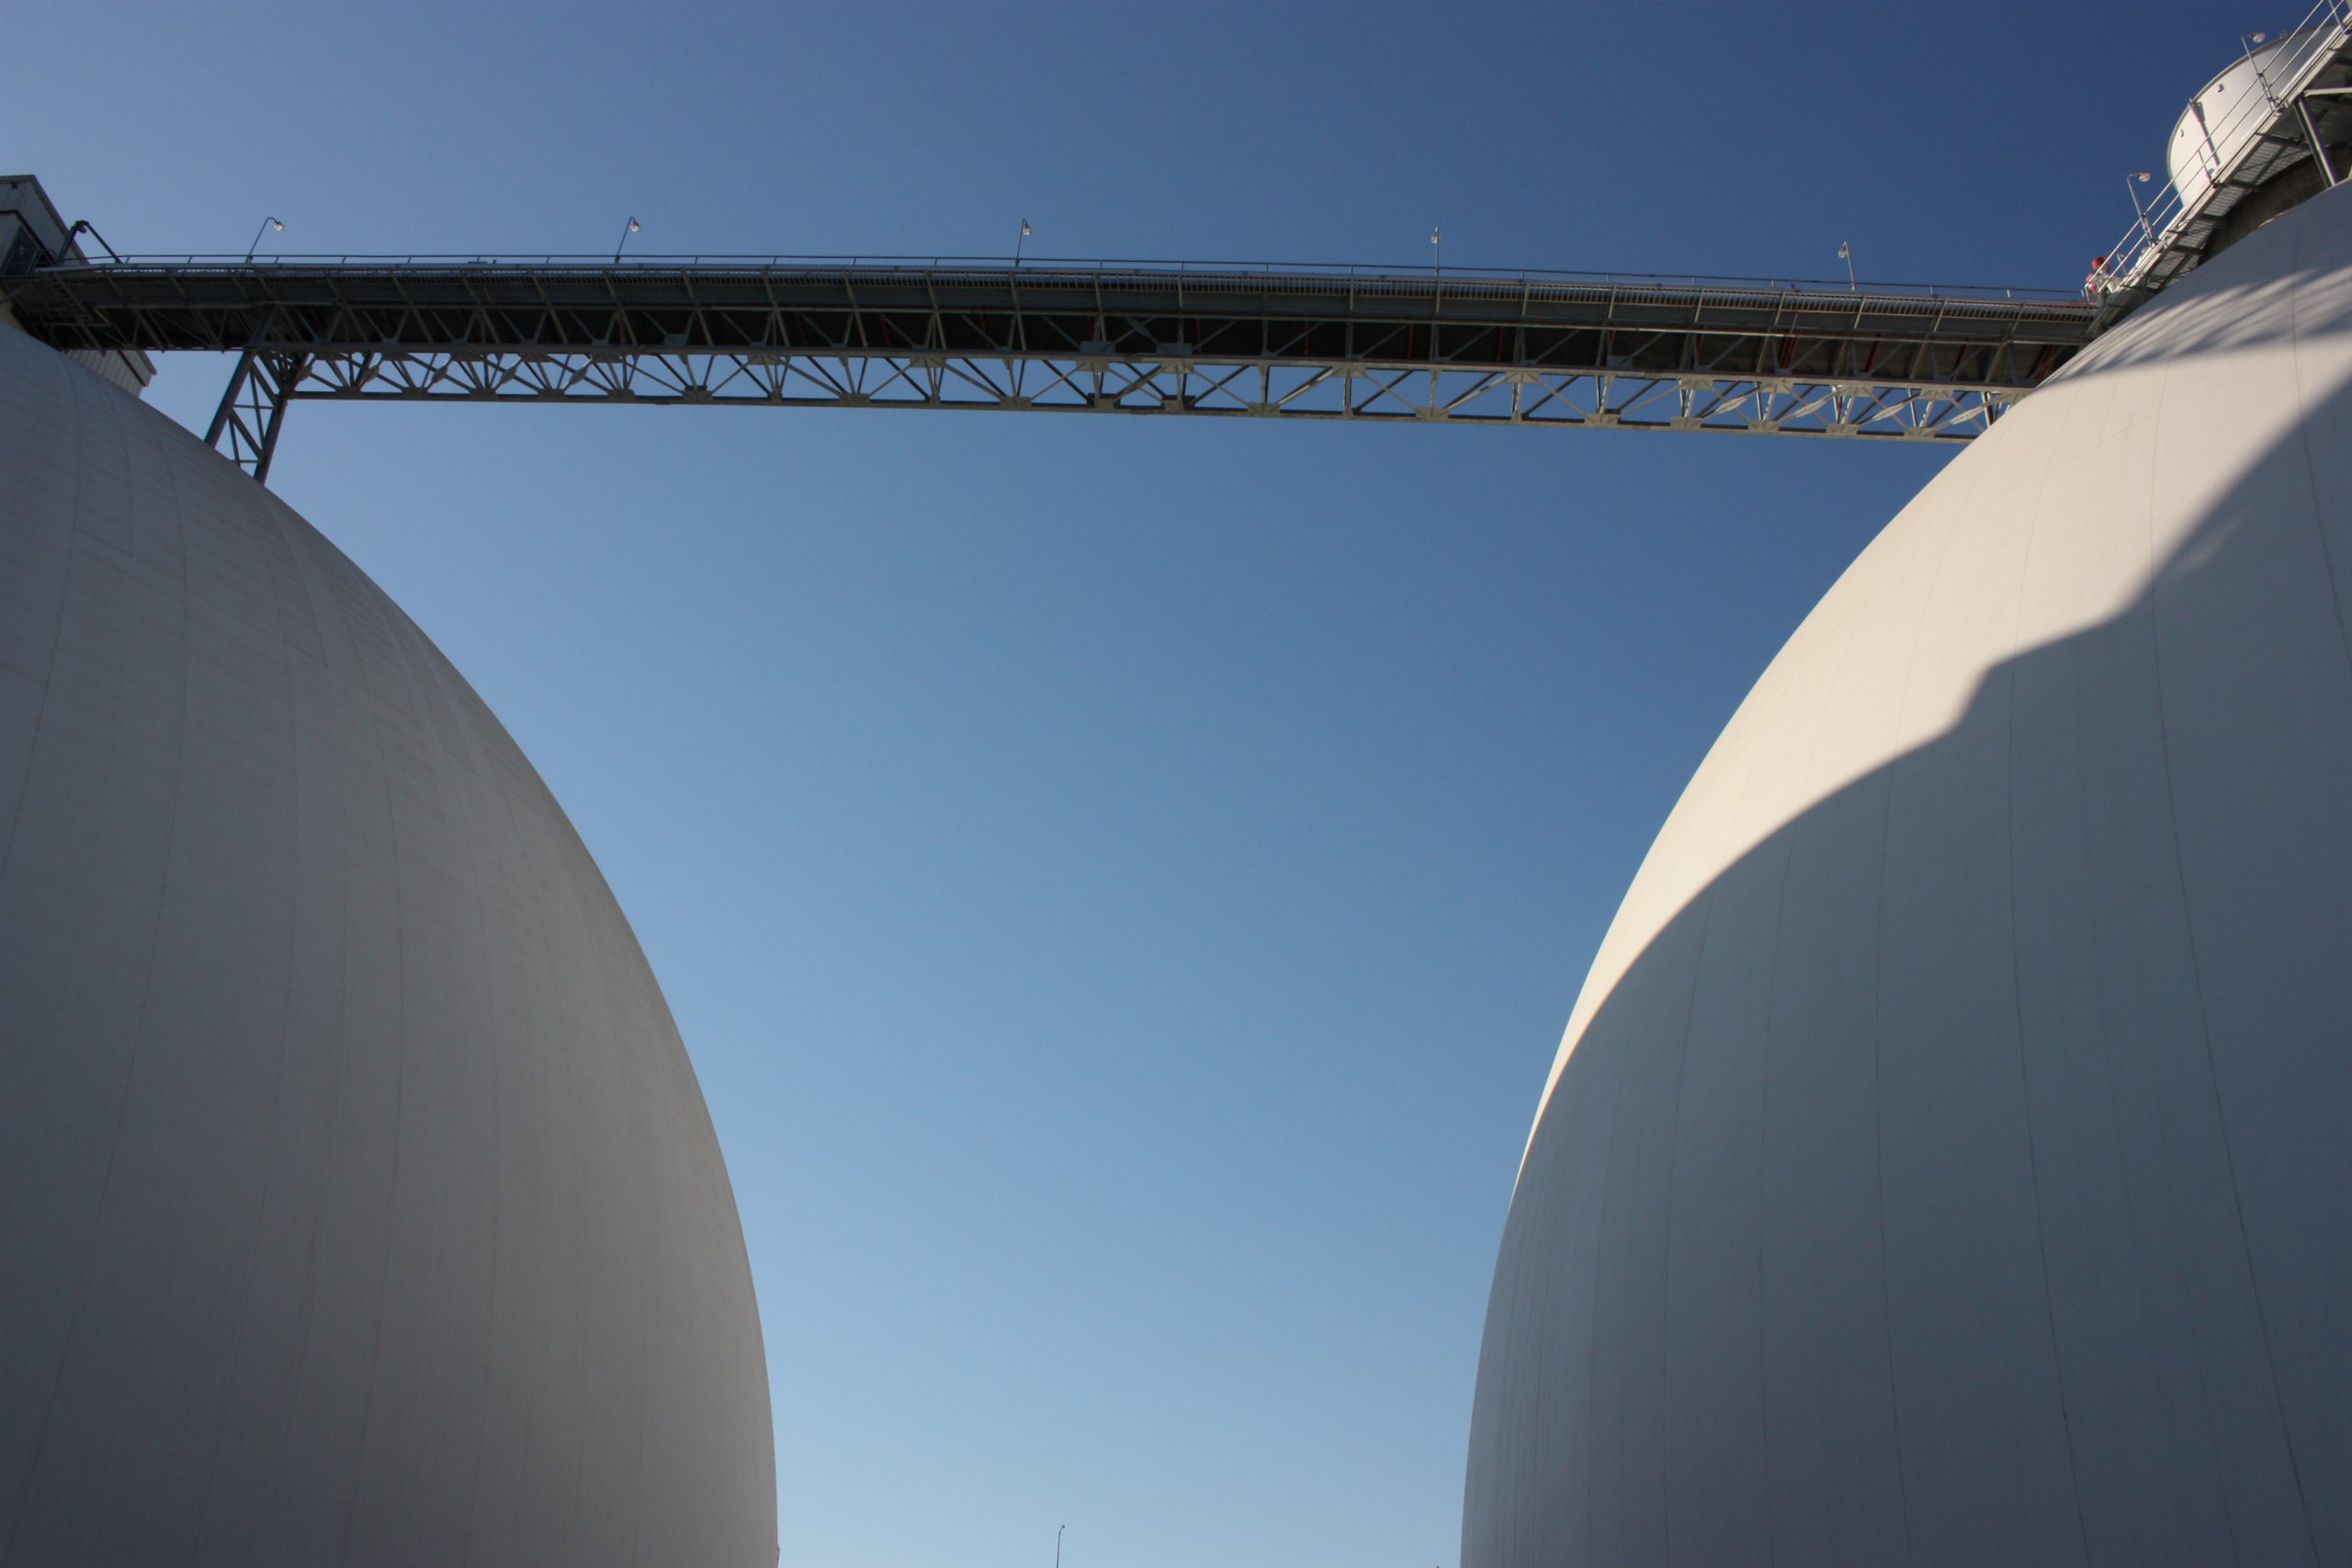
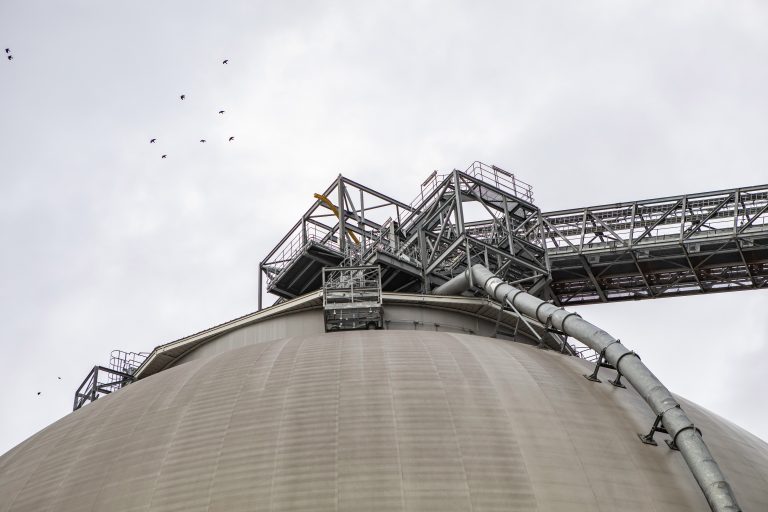
Biomass wood pellet storage dome, Drax Power Station

Biomass wood pellet storage dome, Drax Power Station

We believe that with increasingly ambitious global decarbonisation targets, the need for negative emissions and improved understanding of the role that sustainably sourced biomass can play, will result in continued robust demand.

Pinnacle is already a key supplier of wood pellets to other markets with C$6.7 billion of long-term contracts with high quality Asian and European customers, including Drax, and a significant volume contracted beyond 2027.

Drax aims to leverage Pinnacle’s trading capability across its expanded portfolio. We believe that the enlarged supply chain will provide greater opportunities to optimise the supply of biomass from its own assets and third-party suppliers.

The transport and shipping requirements of the enlarged company will provide further opportunities to optimise delivery logistics, helping to reduce distance, time, carbon footprint and cost.

Train transporting biomass wood pellets arriving at Drax Power Station

Importantly – there will also be opportunities to share best practice and drive sustainability standards higher across the group.

We recognise that the forest landscape in British Columbia and Alberta is different to the commercially managed forests in the south eastern US where we currently operate.

In line with our world leading responsible sourcing policy, Drax will work closely with environmental groups, Indigenous First Nation communities and other stakeholders and invest to deliver good environmental, social and climate outcomes in Pinnacle’s sourcing areas.

We are determined to create a long-term future for sustainable biomass and deliver BECCS –  the negative emissions technology that will be needed around the world to meet global climate targets. The acquisition of Pinnacle takes us a big step forward in achieving our goals.


Read press release: Drax completes acquisition of Pinnacle Renewable Energy Inc.


The science behind measuring and analysing trees

Weyerhaeuser working forest in Amite catchment area

We have published independent Catchment Area Analysis (CAA) reports for around 68% of the total biomass wood pellet supply to Drax Power Station in 2019. Within that, 73% of the pellets were manufactured in the US South accounting for 49% of that year’s total supply quantity.

A key component of CAA analysis are measurements, data and calculations provided by the National Forest Inventory (NFI). Bespoke wood price data, mill production capacity, market trends and interviews with local experts complete the picture.

The NFI in each country or region can be quite different in its intensity and frequency of measurement and overall degree of accuracy. In this article we examine the Forest Inventory and Analysis (FIA) database produced by the US Department of Agriculture Forest Service (USDA FS).

FIA traces its origin back to the McSweeney – McNary Forest Research Act of 1928 and began the first inventory in 1930. Since that time, it has been in continuous operation with a stated mission to: make and keep current a comprehensive inventory and analysis of the present and prospective conditions of and requirements for the renewable resources of the forest and rangelands of the US.

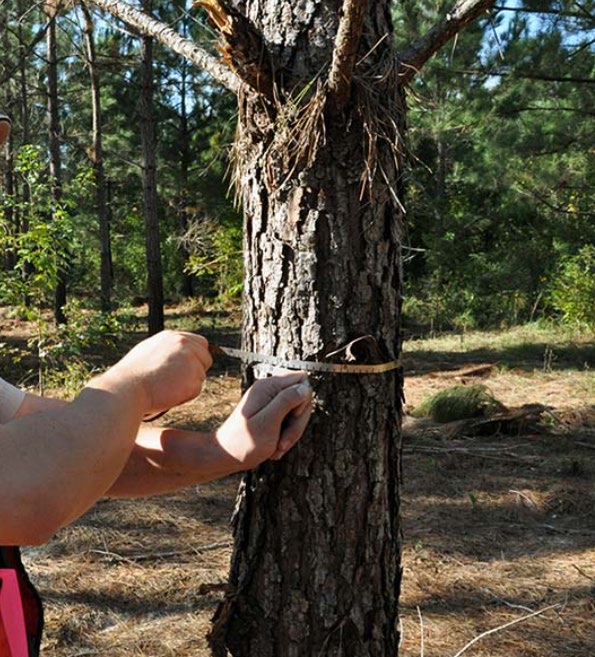
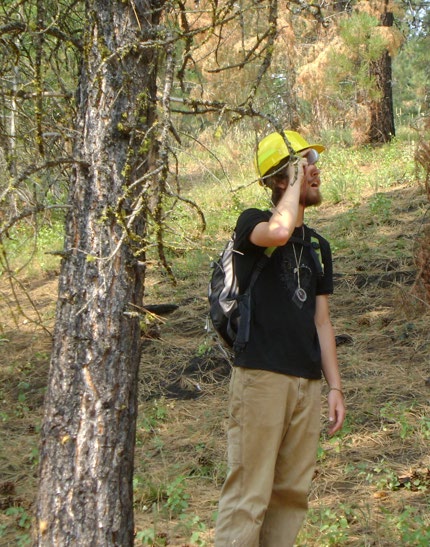
The fundamental science behind measuring tree height and diameter to calculate growth and volume has not changed much over the decades. A girth tape is used to measure the diameter at breast height (DBH), which is a point on the tree stem 1.37m above the base of the tree or the root collar (the exact height can vary by country). The height of a standing tree is conventionally measured using a clinometer or hypsometer, which measures the angle from the top of the tree to a measured distance away from the base. This forms a triangle from which the tree height can be calculated.

Example of girth and height measurement in the US South

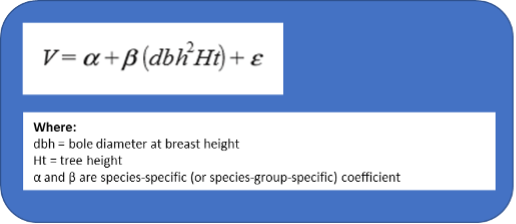
The combination of height and girth are then used to estimate total tree volume based on historical models for that particular species in that country or region. Many decades worth of data measurements and modelling have been used to develop complex equations to estimate volume for each species and circumstance. This calculation process needs to estimate the rate of taper of the stem, or the difference in diameter between the base and the top of the tree. This can be consistent within a single species, but it can depend on growth rates and planting density (for example closely stocked trees may grow taller and thinner but more openly planted trees tend to be shorter and wider). Whether the site has been thinned, how many times, and at what age, can impact the degree of taper in the stem. Through many years of research, measuring and modelling the Southern Research Station (SRS) FIA team has developed the following formula for under-bark volume calculation:

under-bark volume calculation

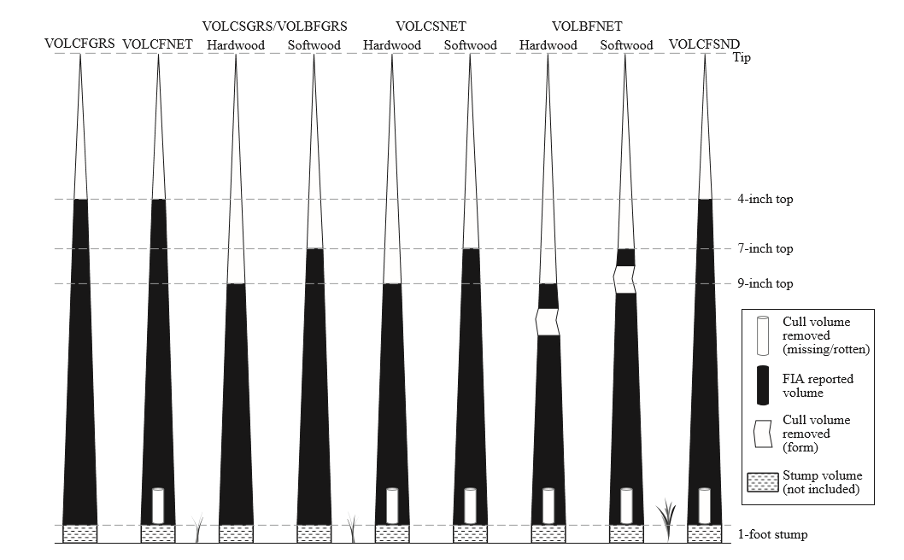
This is then modified according to the parameters shown below, depending on species and stem characteristics.

Example of volume

Example of volume

Once the volume has been calculated, the basic density (solid wood per cubic metre) and moisture content can be used to calculate wet and dry weight, fibre content and yield.

A comprehensive record of data

The US Forest Service has built up an extensive historical record of data points through years of physical measurements – from both sampling and cutting down individual sample trees to determine the actual dimensions and statistics to compare against the estimated values. Over time, forest scientists are able to build up reasonably accurate tables for each tree species that can be used to estimate growth and volume based on the DBH and estimated tree height.

In the UK we have a forester’s handbook known as The Blue Book which contains a vast quantity of modelled data to help a forester calculate volume and growth in a range of different forest types across the country. This data has been collected and modelled by the Forestry Commission’s Forest Research branch. In the US they have a similar system of data collection and modelling but on a bigger scale, given the much larger forest area and greater variety in tree species and site type.

How can you measure an entire forest?

The forestland area of the US South covers more than 100 million hectares (ha) in total which can present quite a challenge to measure, survey and accurately predict forest growth and health. The FIA does this through a network of sample plots randomly but sequentially distributed across the forestland in each State with undisclosed locations so as to avoid biased management. Field crews collect data on forest type, site attributes, tree species, tree size, and overall tree condition on accessible forest land.

Recently, the programme has involved a five-year rolling measurement system where 20% of the plots are measured in each State, on an annual basis. At the end of a five-year period all plots will have been measured and the process begins again. This process is overseen by a robust quality assurance system to maintain and ensure the quality and accuracy of the fieldwork.

Plots are distributed at a rate of 1 plot per 6,000 acres of land (or one per 2,400 ha). This degree of plot distribution is at an extremely course scale if attempting to understand the growth of an individual stand or forest area. For example, The Blue Book recommends using 8-12 plots (and top height measurements) for a relatively uniform stand of around 10 ha. This degree of accuracy would be required to calculate the volume of standing wood for sale. In comparison, the FIA data would be completely inaccurate if trying to monitor growth and trends at an individual forest level or even at county level. This sampling intensity and the scale of measurement are the most critical factors in assessing the validity of data and trends that are identified through the FIA and through the CAA analysis.

Quantifying the level of accuracy

The physical measurement procedure and volume modelling are well established processes with data and analysis collected over many decades to support the findings; this leads to a clearly quantifiable degree of error for each measured plot. The challenge comes when using plot data to estimate the values in the surrounding forest. At this scale, the level of accuracy will depend on the ratio of plots to total forest area and the total number of plots measured. The ratio of plots per ha in the US South is pre-determined, limited by the physical and financial constraints of actually measuring trees on the ground. However, the total number of plots used to evaluate trends can vary according to how large an area is assessed.

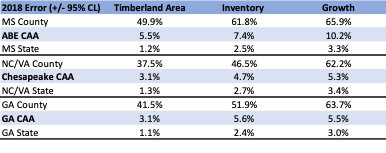
Fundamentally, if a single county is assessed then the total number of sample plots will be low and the potential for error will be high. If an entire State is assessed, then the number of plots is much larger (despite the same ratio of plots per ha) therefore the data and the trend is statistically much more accurate. Drax’s CAA analysis falls somewhere in between these two points, with each catchment area including multiple counties but not quite at the same scale as State level analysis. An example of the variation in error is shown in the table below.

Degree of error for key metrics in Drax’s CAA analysis

Degree of error for key metrics in Drax’s CAA analysis

The data showing total inventory (volume of wood growing in the forest) has been assessed for the Chesapeake catchment area in North Carolina and Virginia. When looking at each individual county, the data error calculation is +/- 46.5%, therefore not very accurate. If looking at State level, the data error is only +/- 2.7%. This degree of error is much more accurate and demonstrates more credible and reliable data due to the much larger number of plots available across the entire State. The Drax CAA analysis for inventory in the Chesapeake area is +/- 4.7% which is reasonably close to the State level accuracy due to the large number of countries that are included in the CAA analysis.

Since the catchment area boundary is defined by the pellet mill’s historical and future sourcing pattern, this can vary in size according to each mill’s procurement strategy and local market conditions. For example, the Amite BioEnergy pellet plant sources from a much smaller area close to the mill and therefore the catchment area includes fewer counties. This can lead to a higher degree of error than in the other CAA reports as the total number of plots used is smaller.

A long history of measurement and analysis

Despite this, the overall degree of error is still in single figures and can be considered reasonable in each CAA report by the standards of forest measurement and modelling, an error of under 10% is generally considered acceptable. Measuring standing trees that are still growing is not an exact science – it is an estimation. Trees cannot be accurately weighed or measured until they are cut down. Therefore, there will always be degree of error in estimated data. In the US South, the long history of measurement, analysis and data modelling and the relatively homogenous nature of the main commercial species (southern yellow pine), mean that the error is relatively uniform and predictable if a large sample area is considered.

The potential for remote sensing data collection and analysis to replace traditional field measurement is an interesting and developing field. At an individual forest or stand level, it is possible to carry out intensive measurement with Laser or Lidar, to calculate volume and growth. However, there is currently no reliable, accurate and cost-effective way to do this at a large-scale across several million hectares. This may be a possibility as the technology and data interpretation tools continue to develop and Drax is working closely with remote sensing specialists to trial and develop this process. Until then, we can rely on boots on the ground and traditional fieldwork for an accurate view of the forest trends across our supply chain.

This blog supports a series of catchment area analyses around the forest biomass pellet plants supplying Drax Power Station with renewable fuel. Read more.


Georgia Mill Cluster catchment area analysis

Forest in LaSalle catchment area

The seventh report in a series of catchment area analyses for Drax looks at the fibre sourcing area surrounding a number of compressed wood pellet plants operated by Georgia Biomass (now owned by Enviva) and Fram Renewable Fuels.

The evidence found in the report by Hood Consulting shows a substantial increase in forest inventory (stored carbon) and a relatively stable forest area. However, with continued pressure from urban development, future losses of timberland area are possible.  Despite this, increasing growth rates can maintain and improve wood supply and carbon stock for the foreseeable future.

Increasing forest growing stock and carbon sequestration

The overall inventory of growing stock in the catchment area has increased by 63 million cubic metres (m3) between 2000 and 2018, a growth of 19.3%.  All of this increase has been in the pine area, which increased by nearly 68 million m3, whereas the hardwood species decreased in volume by 4.5 million m3. Overall, the inventory volume split by species in 2018 was 72% to 28% softwood to hardwood. The breakdown by product category is shown in Figure 3 below.

Figure 1: Change in growing stock by major product category and species (USFS)

The pine saw-timber and chip-n-saw product categories, larger dimension and higher value material, showed the largest increase in inventory, whereas pine pulpwood decreased in total volume.  The most substantial change occurred from 2010 to 2018, where pulpwood went from an increasing trend to a decreasing trend and saw-timber increased in volume much more rapidly – this is shown in Table 1 and Figure 2 below.

Change (cubic metres (m3))Pine SawtimberPine Chip-n-sawPine PulpwoodHardwood SawtimberHardwood PulpwoodTotal
2000-201851,301,62822,277,139-5,835,2301,211,110-5,657,11463,297,533
2000-201014,722,99512,707,6745,262,192-3,740,507-5,76989923,182,455
2010-201836,578,6329,569,465-11,097,4224,951,618112,78440,115078
Table 1: Change in growing stock volume by major product category (USFS)

These changes are likely to reflect an increasing age class in the catchment area, with younger stands of pine (previously classed as pulpwood), growing into a larger size class and being reclassified as saw-timber.  This means that the volume of saw-timber availability in future will be significantly higher, but pulpwood availability will be diminished.  For pellet mill markets any loss in pulpwood availability can be compensated by an increase in sawmill residue production if market demand is maintained or increased.

Figure 2: Change in growing stock by major product category and species (USFS)

Growth rates for both softwood and hardwood species have been increasing since 2000 as shown in Figure 3 below. Softwood growth has increased by 18.5% since 2000 and hardwood by 1.4%. The improved softwood growth rate probably resulted from increased investment in the management of pine forests, the superior quality of seedlings and better management practice (ground preparation, weed control, fertilisation etc.). This is a very positive trend for the sequestration rate of carbon and also for providing landowners with the potential to increase revenue per hectare and encourage the retention and improved management of forests, rather than converting to other land uses. The Georgia catchment area is likely split between passive owners that do not actively manage, where growth rates are slower or decline and the incentive to convert land is greater, and owners that actively manage to improve growth and quality, increasing revenue and maintaining productive forest.  There is likely to be a much greater differential in growth rate between these two management approaches than reflected by the trend in Figure 3, highlighting the importance of active management for carbon abatement.

Average annual growth rate per hectare (USFS)

Figure 3: Average annual growth rate per hectare (USFS)

Stable forest area

At a macro scale, the distribution of land use categories has remained relatively stable since 2000, with no apparent major shifts in land use. The timberland area around the seven mills has decreased by around 135 thousand hectares (ha) between 2000 and 2018 (2.3% of the total land area), whilst the area of arable and urban land increased by 98 thousand (1.7% of total area) and 158 thousand (2.7% of total area) ha respectively.  In 2018, timberland represented 67% of total land area and all forest and woodland 80% of total area, down from 69% and 82% respectively in 2000 (Figure 1).

Change in land use category (USDA)

Figure 4: Change in land use category (USDA)

Looking at this change in land use more closely, the timberland area shows the most pronounced decline between 2010 and 2018, a drop of 117 thousand ha. The largest change in other land use categories over this period was an increase of 97 thousand ha in urban and other land, suggesting that a large proportion of the timberland area has been converted to urban areas.
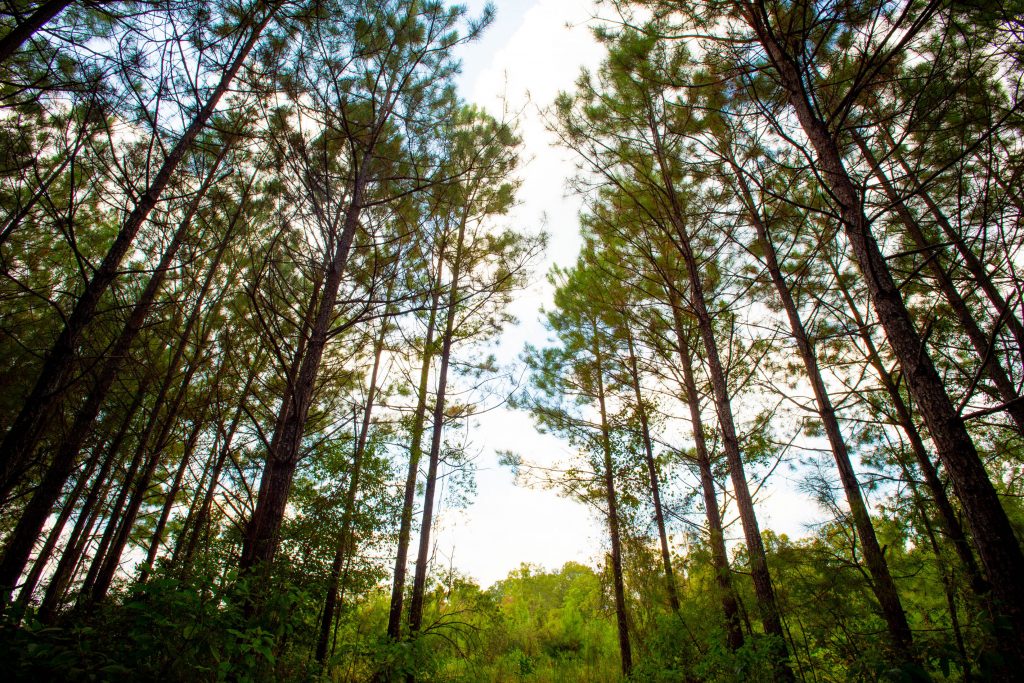
LaSalle Bioenergy forest area

The most significant change in agricultural land occurred prior to 2010, when the timberland area remained relatively stable, this change appears to have involved the transition of pastureland to arable crops. There may also have been some reclassification of forest and woodland types, with a decrease in the area of woodland and an increase in forestland during the period between 2000 and 2010 (Table 2).

Change (hectares (ha))TimberlandOther ForestlandArable CroplandWoodlandPasturelandUrban & Other Land
2000-2018-135,19570,07398,436-77,904-113,725178,315
2000-2010-18,53953,15073,243-73,077-95,63060,852
2010-2018-116,65616,92225,193-4,827-18,09697,463
Table 2: Timing of land use change in Georgia catchment area (USDA)

These trends are also clear and apparent in Figure 3 below which shows the sharp decline in timberland area, albeit small in absolute area relative to the total catchment area size, and the steady increase in urban land.  Georgia ranks 8th in the list of US States and territories by total population with 10.6 million and 17th by population density at 184 per square mile (mi2) compared to just 63 per mi2  in Mississippi where Drax’s Amite Bioenergy (ABE) pellet plant is located and 108 per mi2 in Louisiana where the Morehouse Bioenergy (MBE) and LaSalle Bioenergy (LBE) mills are located (US Census Bureau). This population pressure and increased development can lead to more forest loss and land use change.

Trends in major land use categories (USDA)

Figure 5: Trends in major land use categories (USDA)

Drax’s suppliers in the Georgia catchment area have made a commitment not to source wood from areas where land use change is taking place. This commitment is monitored and verified through the Sustainable Biomass Program (SBP) certification process that is maintained by each mill.  Any land use change in the catchment area is likely to be a result of prevailing economic drivers in the region rather than due to actions being taken by the pellet producers.

Increasing demand and surplus forest growth

Strong markets are essential for ensuring that forests are managed and restocked to optimum benefit, sawlog markets are particularly important as this is highest revenue stream for forest owners. Figure 6 shows the trend in market demand for each major product category since 2000 and demonstrates the recent increase in softwood sawlog demand as the US economy (particularly housing starts) recovered from the global recession at the end of the last decade. Softwood pulpwood demand increased through the 2000s but has remained relatively stable since 2011, with the exception of a peak during 2018 which resulted from an increase in volume generated by salvage operations after hurricane Michael.

Figure 6: Demand for wood products (USFS, TMS)

Figure 6: Demand for wood products (USFS, TMS)

The comparison of average annual growth and removals in the Georgia catchment area is much more tightly balance than in Drax’s other supply regions, as shown in Figure 7. Since 2000 the average annual surplus of growth has been around 3.6 million m3 with both demand and growth increasing in recent years.

Figure 7: Average annual growth, removals and surplus (USFS)

Figure 7: Average annual growth, removals and surplus (USFS)

As shown in Figures 2 & 3, growth rates are strong and inventory is increasing, this is not a problem in the Georgia area.  The relatively small surplus, as compared to other catchment areas in the US South, is due to the higher concentration of wood fibre markets and the more intense forest industry activity in this region.  As of July 2020, there were over 50 major wood-consuming mills operating within the Georgia catchment area and an additional 80+ mills operating within close proximity, overlapping the catchment area.  Total pulpwood demand in 2019 was 12.9 million tons, of which approximately 87% was attributed to non‐bioenergy‐related sources (predominantly pulp/paper) and 13% was attributed to the bioenergy sector.  Given the bio-energy sector’s low ranking position in the market (with the lowest ability to pay for fibre), combined with the relatively small scale in demand compared to the pulp and paper industry, the influence of biomass markets can be considered to be minimal in this region, particular when it comes to impacts on wood prices and forest management practice.

Wood price trends

Pine sawtimber prices suffered a significant decline between 2000 and 2010, dropping almost $21 per ton as a result of the global financial crisis and the decline in demand due to the collapse in housing markets and construction (Table 3).  Since 2010 pine sawtimber has remained relatively stable, with some minor fluctuations shown in Figure 8 below.

Change ($/ton)Pine SawtimberPine Chip-n-sawPine PulpwoodHardwood SawtimberHardwood Pulpwood
2000-2019-$20.92$15.14$5.95$12.55$4.70
2000-2010-$20.92-$21.41$2.11$11.25$5.67
2010-2019$0.00$6.27$3.84$1.30-$0.97
Table 3: Stumpage price trends (TMS)

Pine pulpwood prices have been on a generally increasing trend since 2000, with a more significant increase since 2011.  This increase does not reflect an increase in demand or total volume, which has remained relatively stable over this period, but a shifting of the geographic distribution of the market with some new mills opening and old mills closing, resulting in increased competition in some localised fibre baskets and leading to an overall increase in stumpage price.

Figure 8: Stumpage price trends (TMS)

Figure 8: Stumpage price trends (TMS)

Figure 9 below shows that, with the exception of the hurricane salvage volume in 2018, pulpwood removals have declined or remained relatively stable since 2010, whereas pulpwood stumpage prices increased by 41% from 2010 to 2018.

Figure 9: Pulpwood demand and stumpage price (USFS, TMS)

Figure 9: Pulpwood demand and stumpage price (USFS, TMS)

Comparing this stumpage price trend with other catchment areas of the US South (Figure 10), where Drax sources wood pellets, the Georgia area is on average 35% higher than the next highest area (Chesapeake) and 87% higher than the lowest cost area (Amite Bioenergy in Mississippi).  This price differential is predominantly due to the scale of demand and availability of surplus low-grade fibre.

Figure 10: Comparison of pine pulpwood stumpage prices in Drax supply areas US South (TMS)

Figure 10: Comparison of pine pulpwood stumpage prices in Drax supply areas US South (TMS)

Hood Consulting summary of the impact of the seven pellet plants on key trends and metrics in this catchment area.

Is there any evidence that bioenergy demand has caused the following…

Deforestation?

No. US Forest Service (USFS) data shows a 108,130-hectare (-2.6%) decrease in total timberland in the Georgia catchment area since Georgia Biomass’ first full year of production in 2012. Specifically, this loss in total area of timberland coincided with a more than 21,000-hectare increase in cropland/pastureland and a more than 73,000-hectare increase in urban land and land classified as having other uses.

However, there is little evidence to suggest that increased wood demand from the bioenergy sector has caused this decrease in total timberland. Furthermore, pine timberland – the primary source of roundwood utilized by the bioenergy industry – has increased more than 17,000 hectares in the catchment area since 2016.

A change in management practices (rotation lengths, thinnings, conversion from hardwood to pine)?

No. Changes in management practices have occurred in the catchment area over the last two decades. However, there is little evidence to suggest that bioenergy demand, which accounts for roughly 10-14% of total pulpwood demand (and only 5-7% of total wood demand in the catchment area), has caused or is responsible for these changes.

Clearcuts and thinnings are the two major types of harvests that occur in this region, both of which are long-standing, widely used methods of harvesting timber. TimberMart-South (TMS) data shows that thinnings accounted for 67% of total reported harvest area in the southeast Georgia market from 2000-2010, but only 43% of total harvest area reported from 2012-2019. Specifically, this downward shift was initiated by the bursting of the US housing bubble in the mid-2000s and had been completed by the early 2010s. We’d like to note that this shift coincided with a nearly 50% decrease in pine sawtimber stumpage price from 2006-2012. This is important because the strength of pine sawtimber markets had been a driving force behind timber management decisions in this region in the early and mid-2000s.

Also, contributing to the decreased prevalence of thinnings was the strengthening of pine pulpwood markets in the mid-2000s, as pine pulpwood stumpage prices increased more than 40% in the Georgia catchment area from 2003-2008. So, with sawtimber markets continuing to weaken and pulpwood markets doing just the opposite, the data suggests that many landowners decided to alter their management approach (to take advantage of strong pulpwood markets) and focus on short pulpwood rotations that typically do not utilize thinnings.

Ultimately, the shift in management approach that occurred in this market can be linked to the weakening of one type of timber market and the strengthening of another. In the early and mid-2000s, timber management was focused on sawtimber production – a type of management that utilizes thinnings. However, for more than a decade now, this market has been driven to a large degree by the pulp/paper industry, with a significant portion of the timber management in this area focused on short pulpwood rotations.

Diversion from other markets?

No. Demand for softwood (pine) sawlogs increased an estimated 39% in the Georgia catchment area from 2011-2019. Also, increased bioenergy demand has caused no diversion from other pulpwood markets (i.e. pulp/paper), as pulpwood demand not attributed to bioenergy held steady and remained nearly unchanged from 2012-2017 before increasing in 2018 and 2019 due to the influx of salvage wood brought about by Hurricane Michael.

We’d like to make special note that increased demand for softwood sawlogs since 2011 has not resulted in a full pine sawtimber (PST) stumpage price recovery in this market. Reduced demand for softwood sawlogs in the late 2000s and early 2010s resulted in oversupply, and this oversupply has remained, despite increased demand the last 6-8 years. As a result, PST stumpage prices have held steady and averaged roughly $30 per ton in the catchment area since 2013 – down approximately 35% from the 2000-2006 average of more than $46 per ton, but up roughly 15% from the 2011-2012 average of approximately $26 per ton.

An unexpected or abnormal increase in wood prices?

No / Inconclusive. The delivered price of pine pulpwood (PPW) – the primary roundwood product consumed by both Georgia Biomass and Fram – increased 26% in the Georgia catchment area over the six years directly following the startup of Georgia Biomass, increasing from $29.16 per ton in 2011 to $36.63 per ton in 2017. And while this 26% increase in delivered PPW price coincided with a roughly 1.1 million metric ton increase in annual pine pulpwood demand from Georgia Biomass and Fram, total demand for pine pulpwood (from both bioenergy and other sources) actually decreased 7% over this period. Moreover, evidence suggest that this increase in PPW price is more closely linked to changes in wood supply, specifically, the 9% decrease in PPW inventory from 2011-2017.

However, there is evidence that links increased demand from the bioenergy sector to an increase in secondary residual (i.e. sawmill chips, sawdust, and shavings) prices. Specifically, the price of pine sawmill chips – a residual feedstock utilized by the bioenergy industry for wood pellet production – held steady and averaged approximately $26 per ton in the Georgia catchment area from 2008-2012. However, from 2012-2016, pine sawmill chip prices increased more than 15% (to $29.55 per ton in 2016). This increase in price coincided with annual pine residual feedstock purchases by Georgia Biomass and Fram increasing from roughly 325,000 metric tons to nearly 1.0 million metric tons over this period. However, note that pine sawmill chip prices have held steady and averaged roughly $29.50 per ton in the catchment area since 2016, despite further increases in pine secondary residual purchases by Georgia Biomass and Fram (to more than 1.2 million metric tons in 2019).

Ultimately, the data suggests that any excess supply of pine secondary residuals in the catchment area was absorbed by the bioenergy sector in the early and mid-2010s, and the additional demand/competition placed on this market led to increased residual prices. However, the plateauing of residual prices since 2015 along with the continued increase in secondary residual purchases by Georgia Biomass and Fram further suggest that an increasing percentage of secondary residual purchases by the bioenergy sector is sourced from outside the catchment area. Specifically, Fram confirmed this notion, noting that 35-40% of its secondary residual purchases come from outside the Georgia catchment area (from six different states in the US South).

A reduction in growing stock timber?

No. Total growing stock inventory in the catchment area increased 11% from 2011 through 2018, the latest available. Specifically, over this period, inventories of pine sawtimber and chip-n-saw increased 35% and 13%, respectively. However, pine pulpwood inventory decreased 11% from 2011-2018.

Note that the decrease in pine pulpwood inventory was not due to increased demand from bioenergy (or other sources) or increased harvesting above the sustainable yield capacity of the forest area – as annual growth of pine pulpwood has exceeded annual removals every year since 2011. Rather, this decrease can be linked to the 24% decline in pine sawtimber removals that occurred from 2005-2014 (due to the bursting of the US housing bubble and Great Recession that followed). In this region, timber is typically harvested via clearcut once it reaches maturity (i.e. sawtimber grade), after which the stand is reestablished, and the cycle repeated. However, with the reduced harvest levels during this period also came a reduction in newly reestablished timber stands – the source of pine pulpwood. So, with less replantings occurring during this period, inventories of pine pulpwood were not replenished to the same degree they had been previously, and therefore this catchment area saw a reduction in pine pulpwood inventory levels.

However, according to the US Forest Service, annual removals of pine sawtimber have increased 50% in the Georgia catchment area since 2014, which would suggest higher clearcut levels and increased stand reestablishment. TimberMart-South data also supports this assertion, as clearcut harvests have constituted approximately 60% of the total harvest area reported to TimberMart-South in this region since 2014, compared to 40% from 2005-2014. Ultimately, these increases in clearcut (and stand reestablishment) levels may not be reflected in increased pine pulpwood inventory levels in the short term – as it can take more than 10 years for a pine seedling to become merchantable and reach the minimum diameter requirements to be classified as pulpwood. However, adequate supply levels are expected to remain in the meantime. Furthermore, pine pulpwood inventory levels are expected to increase in the mid-to-long terms as a result of the increased harvest levels and stand reestablishment levels that have occurred in the catchment area since 2014.

A reduction in the sequestration rate of carbon?

No / Inconclusive. US Forest Service data shows the average annual growth rate of total growing stock timber has remained nearly unchanged (holding between 6.0% and 6.1%) in the catchment area since 2011, which would suggest that the sequestration rate of carbon has also changed very little in the catchment area the last 8-10 years. However, the 11% increase in total growing stock inventory since 2011 does indicate that total carbon storage levels have increased in the Georgia catchment area since Georgia Biomass commenced operations in this market.

An increase in harvesting above the sustainable yield capacity of the forest area?

No. Growth-to-removals (G:R) ratios, which compare annual timber growth to annual harvests, provides a measure of market demand relative to supply as well as a gauge of market sustainability. In 2018, the latest available, the G:R ratio for pine pulpwood, the predominant timber product utilized by the bioenergy sector, equaled 1.06 (a value greater than 1.0 indicates sustainable harvest levels). Note, however, that the pine pulpwood G:R ratio averaged 1.44 from 2012-2017. The significant drop in 2018 was due to a 31% increase in removals (due to Hurricane Michael) and is not reflective of the new norm. Specifically, pine pulpwood removals are projected to be more in line with pre-2018 levels in 2019 and 2020, and so too is the pine pulpwood G:R ratio.

Timber growing stock inventory

Neutral. According to USFS data, inventories of pine pulpwood decreased 11% in the catchment area from 2011-2018. However, that decrease was not due to increased demand from bioenergy. Typically, a reduction in inventory is linked to harvest levels above the sustainable yield capacity of the forest area, but in this case, annual growth of pine pulpwood exceeded annual removals every year during this period.

Ultimately, the decrease in pine pulpwood inventory from 2011-2018 can be linked to decreased pine sawtimber production beginning in the mid-2000s. Specifically, annual removals of pine sawtimber decreased 24% from 2005-2014, and the reduction in harvest levels during this period meant fewer new pine stands were reestablished, and that has led to the current reduction in pine pulpwood inventory. (Note that the decrease in pine sawtimber removals from 2005-2014 was mirrored by a 27% increase in pine sawtimber inventory over this same period). However, USFS data shows that annual removals of pine sawtimber have increased 50% in the Georgia catchment area since 2014, which suggests that pine pulpwood inventory levels will start to increase in the catchment area due to increased harvest levels and the subsequent increase in stand reestablishment levels.

Timber growth rates

Neutral. Timber growth rates have increased for both pine sawtimber and pine chip-n-saw but decreased slightly for pine pulpwood in the catchment area since 2011. Evidence suggests that this decrease in pine pulpwood growth rate is not due to increases in bioenergy demand, but rather linked to changes in diameter class distribution and indicative of a forest in a state of transition, where timber is moving up in product class (i.e. pine pulpwood is moving up in classification to pine chip-n-saw).

Forest area

Neutral. In the Georgia catchment area, total forest area (timberland) decreased more than 115,000 hectares (-2.8%) from 2011 through 2018. Note that this decrease coincided with a roughly 19,000-hectare increase in cropland and 93,000-hectare increase in urban land and land classified as having other uses.

Specifically, pine timberland, the primary source of roundwood utilized by the bioenergy industry, decreased over 34,000 hectares from 2011-2016. However, from 2016-2018, pine timberland stabilized and rather increased more than 17,000 hectares in the catchment area (or a net decrease of roughly 17,000 hectares from 2011-2018). Ultimately, there is little evidence that the decrease in pine timberland from 2011-2016 or increase since 2016 is linked to increased bioenergy demand. Rather, the overall decrease in pine timberland since 2011 appears to be more closely linked to the relative weakness of pine sawtimber markets in the Georgia catchment area and the lack of return from sawtimber.

Wood prices

Positive / Negative. Intuitively, an increase in demand should result in an increase in price, and this is what the data shows in the Georgia catchment area as it relates to increased biomass demand from Georgia Biomass and Fram and the prices of the various raw materials consumed by these mills. Specifically, the 1.4-million metric ton increase in softwood pulpwood demand attributed to Georgia Biomass and Fram coincided with a 20% increase in delivered pine pulpwood price and a 10-15% increase in pine chip prices from 2011-2015. Since 2015, biomass demand has held relatively steady, and, overall, so too have delivered pine pulpwood and pine chip prices. The apparent link between increased bioenergy demand and increased pine raw material prices is supported further by statistical analysis, as strong positive correlations were found between softwood biomass demand and both delivered pine pulpwood and pine chip prices. However, note that biomass demand alone is not responsible for these changes in prices, as softwood biomass demand accounts for only 10-15% of total softwood pulpwood demand in the catchment area. Rather, the prices of these raw materials are impacted to a larger degree by demand from other sources (i.e. pulp/paper), which accounts for 85-90% of total softwood pulpwood demand in the Georgia catchment area.

On the other hand, it’s also important to note that the increase in bioenergy-related wood demand has been a positive for forest landowners in the Georgia catchment area. Not only has bioenergy provided an additional outlet for pulpwood in this market, but the increase in pulpwood prices as a result of increased pulpwood demand has transferred through to landowners (improved compensation). Specifically, since 2015, pine pulpwood (PPW) stumpage price – the price paid to landowners – has averaged more than $17 per ton in the Georgia catchment area. This represents a 70% increase over the approximately $10 per ton averaged by PPW stumpage in the catchment area over the last five years prior to Georgia Biomass’ startup in 2Q 2011.

(Note: Pine pulpwood stumpage prices are notably higher in the Georgia catchment area due to a much tighter balance in supply and demand (in comparison to most other markets across the US South). For instance, in all other areas across the US South2, PPW stumpage prices have averaged less than $9 per ton since 2015, or roughly half that of prices in the Georgia catchment area).

Markets for solid wood products

Positive. In the Georgia catchment area, demand for softwood sawlogs used to produce lumber and other solid wood products increased an estimated 39% from 2011-2019, and by-products of the sawmilling process are sawmill residuals – materials utilized by Georgia Biomass and the Fram mills to produce wood pellets. With the increased production of softwood lumber, so too has come an increase in sawmill residuals, some of which have been purchased/consumed by Georgia Biomass and Fram. Not only have these pellet producers benefited from the greater availability of this by-product, but lumber producers have also benefited, as the Georgia Biomass and Fram mills have provided an additional outlet for these producers and their by-products.

Read the full report: Georgia Biomass Catchment Area Analysis.

This is part of a series of catchment area analyses around the forest biomass pellet plants supplying Drax Power Station with renewable fuel. Others in the series include: ChesapeakeEstonia, Latvia and Drax’s own, other three mills LaSalle BionergyMorehouse Bioenergy and Amite Bioenergy.
What is biomass?

Illustration of a working forest supplying biomass

What is biomass?

In ecological terms, biomass refers to any type of organic matter. When it comes to energy, biomass is any organic matter that can be used to generate energy, for example wood, forest residues or plant materials.

How is biomass used?  

Biomass used and combusted for energy can come in a number of different forms, ranging from compressed wood pellets – which are used in power stations that have upgraded from coal – to biogas and biofuels, a liquid fuel that can be used to replace fossil fuels in transport.

The term biomass also refers to any type of organic material used for energy in domestic settings, for example wood burned in wood stoves and wood pellets used in domestic biomass boilers.

Biomass is organic matter like wood, forest residues or plant material, that is used to generate energy.

Where does biomass come from?

Biomass can be produced from different sources including agricultural or forestry residues, dedicated energy crops or waste products such as uneaten food.

Drax Power Station uses compressed wood pellets sourced from sustainably managed working forests in the US, Canada, Europe and Brazil, and are largely made up of low-grade wood produced as a byproduct of the production and processing of higher value wood products, like lumber and furniture.

Biomass producers and users must meet a range of stringent measures for their biomass to be certified as sustainable and responsibly sourced.

Key biomass facts

Is biomass renewable?

 Biomass grown through sustainable means is classified as a renewable source of energy because of the process of its growth. As biomass comes from organic, living matter, it grows naturally, absorbing carbon dioxide (CO2) from the atmosphere in the process.

It means when biomass is combusted as a source of energy – for example for heat or electricity production – the CO2 released is offset by the amount of CO2 it absorbed from the atmosphere while it was growing.

Fast facts

  • In 2019 biomass accounted for 6% of Great Britain’s electricity generation, more than 1/6 of the total generation of all renewable sources
  • There is about 550 gigatonnes of biomass carbon on Earth in total. Humans make up around 1/10,000th of that mass.
  • Modern biomass was first developed as an alternative for oil after its price spiked as a result of the 1973 Yom Kippur War
  • The International Energy Agency (IEA) estimates bioenergy accounts for roughly 1/10th of the world’s total energy supply

Biomass is a renewable, sustainable form of energy used around the world.

How long has biomass been used as a source of energy?

Biomass has been used as a source of energy for as long as humans have been creating fire. Early humans using wood, plants or animal dung to make fire were all creating biomass energy.

Today biomass in the form of wood and wood products remains a widely used energy source for many countries around the world – both for domestic consumption and at grid scale through power stations, where it’s often used to replace fossil fuels with much higher lifecycle carbon emissions.

Drax Power Station has been using compressed wood pellets (a form of biomass) since 2003, when it began research and development work co-firing it with coal. It fully converted its first full generating unit to run only on compressed wood pellets in 2013, lowering the carbon footprint of the electricity it produced by more than 80% across the renewable fuel’s lifecycle. Today the power station runs mostly on sustainable biomass.

Go deeper

Read next: What is reforestation and afforestation?

LaSalle catchment area analysis

LaSalle Bioenergy Pellet Plant

The wood supply catchment area for Drax’s LaSalle BioEnergy biomass pellet plant in mid-Louisiana is dominated by larger scale private forest owners that actively manage and invest in their forest for saw-timber production. Eighty-three per cent (83%) of the forest is in private ownership and 60% of this area is in corporate ownership.

The Drax Biomass pellet mill uses just 3.2% of the roundwood in the market and therefore has limited impact or influence on the overall trends. By contrast, the pulp and paper industry consumes 74% of the total pulpwood demand as the most dominant market for low grade fibre.

Forest in LaSalle catchment area

Forest in LaSalle catchment area

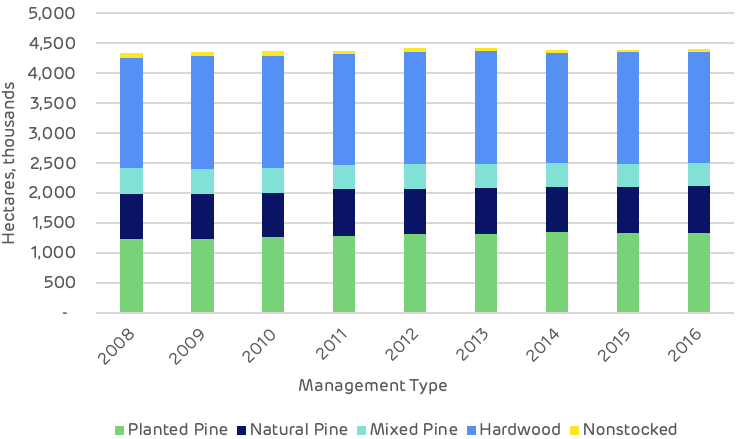
The catchment area has seen an increase in total timberland area of 71 thousand hectares (ha) since 2008, this is primarily due to planting of previously non-stocked land. Hardwood areas have remained stable but planted pine has increased, replacing some of the naturally regenerated mixed species areas. The data below shows that deforestation or conversion from pure hardwood to pine is not occurring.

Timberland area by management type

Timberland area by management type

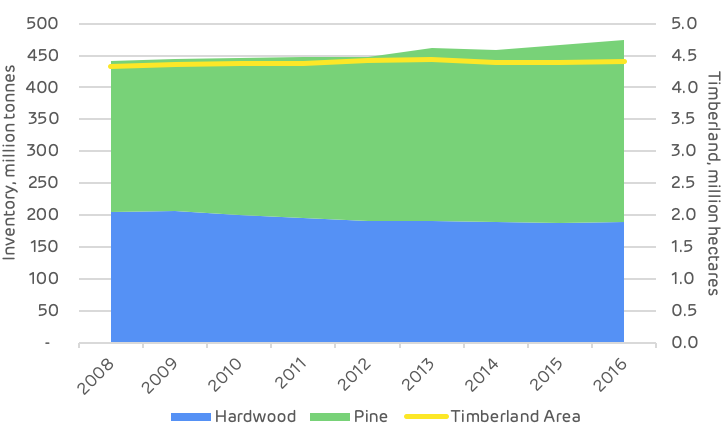
The overall quantity of stored carbon, or the inventory of the standing wood in the forest, has increased by 7% or 32.6 million metric tonnes since 2008. This total is made up of a 49 million tonne increase in the quantity of pine and a 16 million tonne decline in the quantity of hardwood. Since the area of pure hardwood forest has remained stable, this decline is likely to be due to the conversion of mixed stands to pure pine in order to increase saw-timber production and to provide a better return on investment for corporate owners.

Historic area and timberland inventory

Historic area and timberland inventory

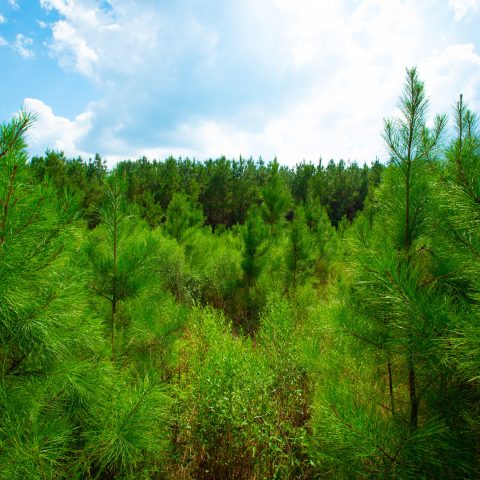
Forest in LaSalle catchment area

Forest in LaSalle catchment area

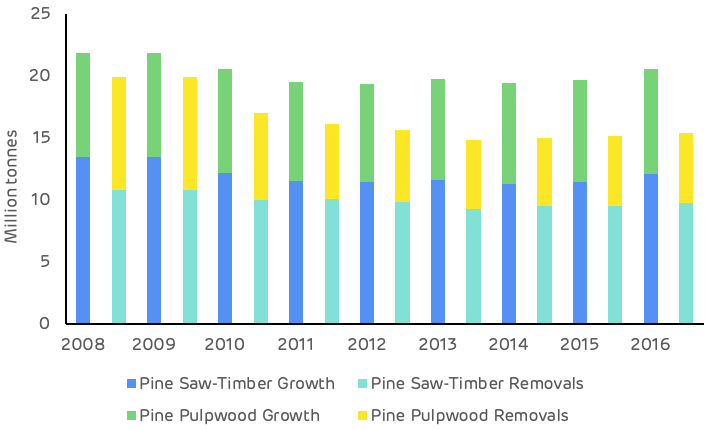
The growth-to-drain ratio and the surplus of unharvested pine growth has been increasing year-on-year from two million tonnes in 2008 to over five million tonnes in 2016.

This suggests that the LaSalle BioEnergy plant (which almost exclusively utilises pine feedstocks) has not had a negative impact on the growth-to-drain ratio and the surplus of available biomass.

The latest data (2016) indicates that the ratio for pine pulpwood is 1.54 and for pine saw-timber 1.24 and that this has been increasing each year for both categories.

Historic growth and removals by species

Historic growth and removals by species

Stumpage prices for all product categories declined between 2010 and 2011. This was followed by a peak around 2015-16 with the recovery in demand post-recession and prices then stabilised from 2016 to 2019. The data indicates that there has been no adverse impact to pine pulpwood prices as a result of biomass demand. In fact, pine pulpwood prices are now nearly 20% lower than in 2014 as shown on the chart below.

LaSalle BioEnergy market historic stumpage prices, USD$:tonne

LaSalle BioEnergy market historic stumpage prices, USD$:tonne

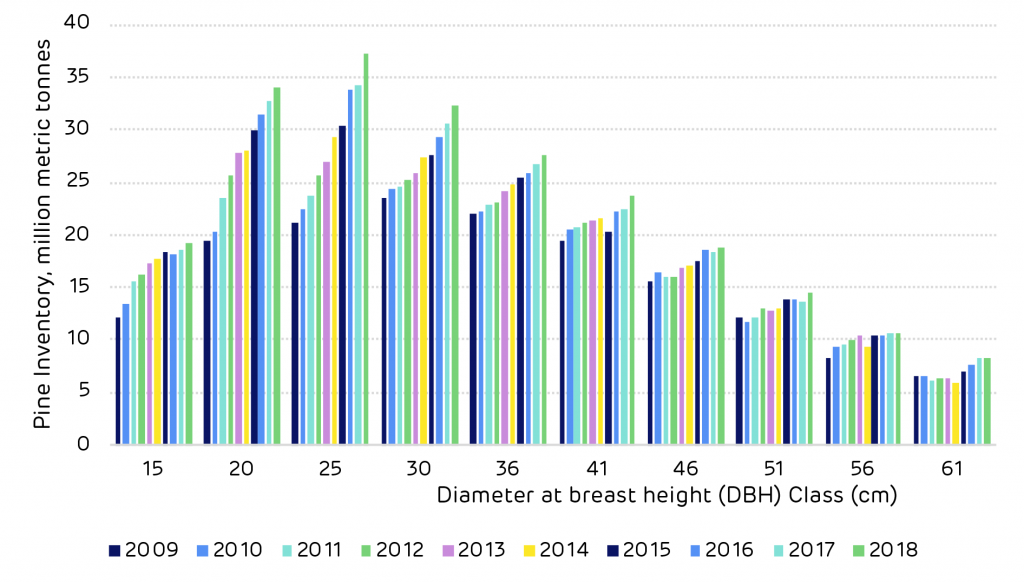
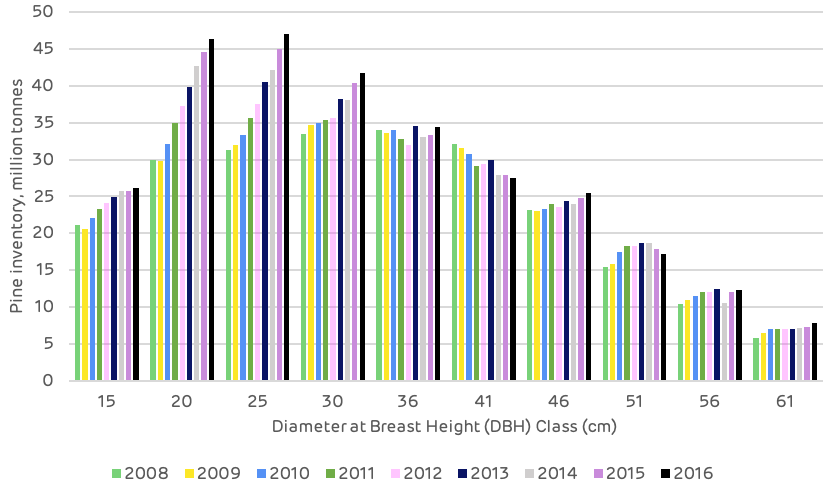
The character of the pine timberland is one of a maturing resource, increasing in the average size of each tree. The chart below chart shows a significant increase in the quantity of timber in the mid-range size classes, indicating a build-up of future resources for harvesting for both thinning and final felling for sawtimber production.

With balanced market demand, the supply of fibre in this catchment area should remain plentiful and sustainable in the medium term.

Historic pine inventory by DBH (diameter at breast height) class

Historic pine inventory by DBH (diameter at breast height) class

Forisk summary of the impact of LaSalle BioEnergy on key trends and metrics in this catchment area

Is there any evidence that bioenergy demand has caused …

Deforestation

No

Change in forest management practices

No

Diversion from other markets

Possibly. Bioenergy plants compete with pulp/paper and oriented strand board (OSB) mills for pulpwood and residual feedstocks. There is no evidence that these facilities reduced production as a result of bioenergy markets, however.

Increase in wood prices

No. There is no evidence that bioenergy demand increased stumpage prices in the market.

Reduction in growing stock of timber

No

Reduction in sequestration of carbon / growth rate

No

Increase in harvesting above the sustainable yield

No 

The impact of bioenergy on forest markets in the LaSalle catchment is …

Growing stock

Neutral

Growth rates

Neutral

Forest area

Neutral

Wood prices

Neutral

Markets for solid wood

Neutral to Positive. Access to viable residual markets benefits users of solid wood (i.e. lumber producers).

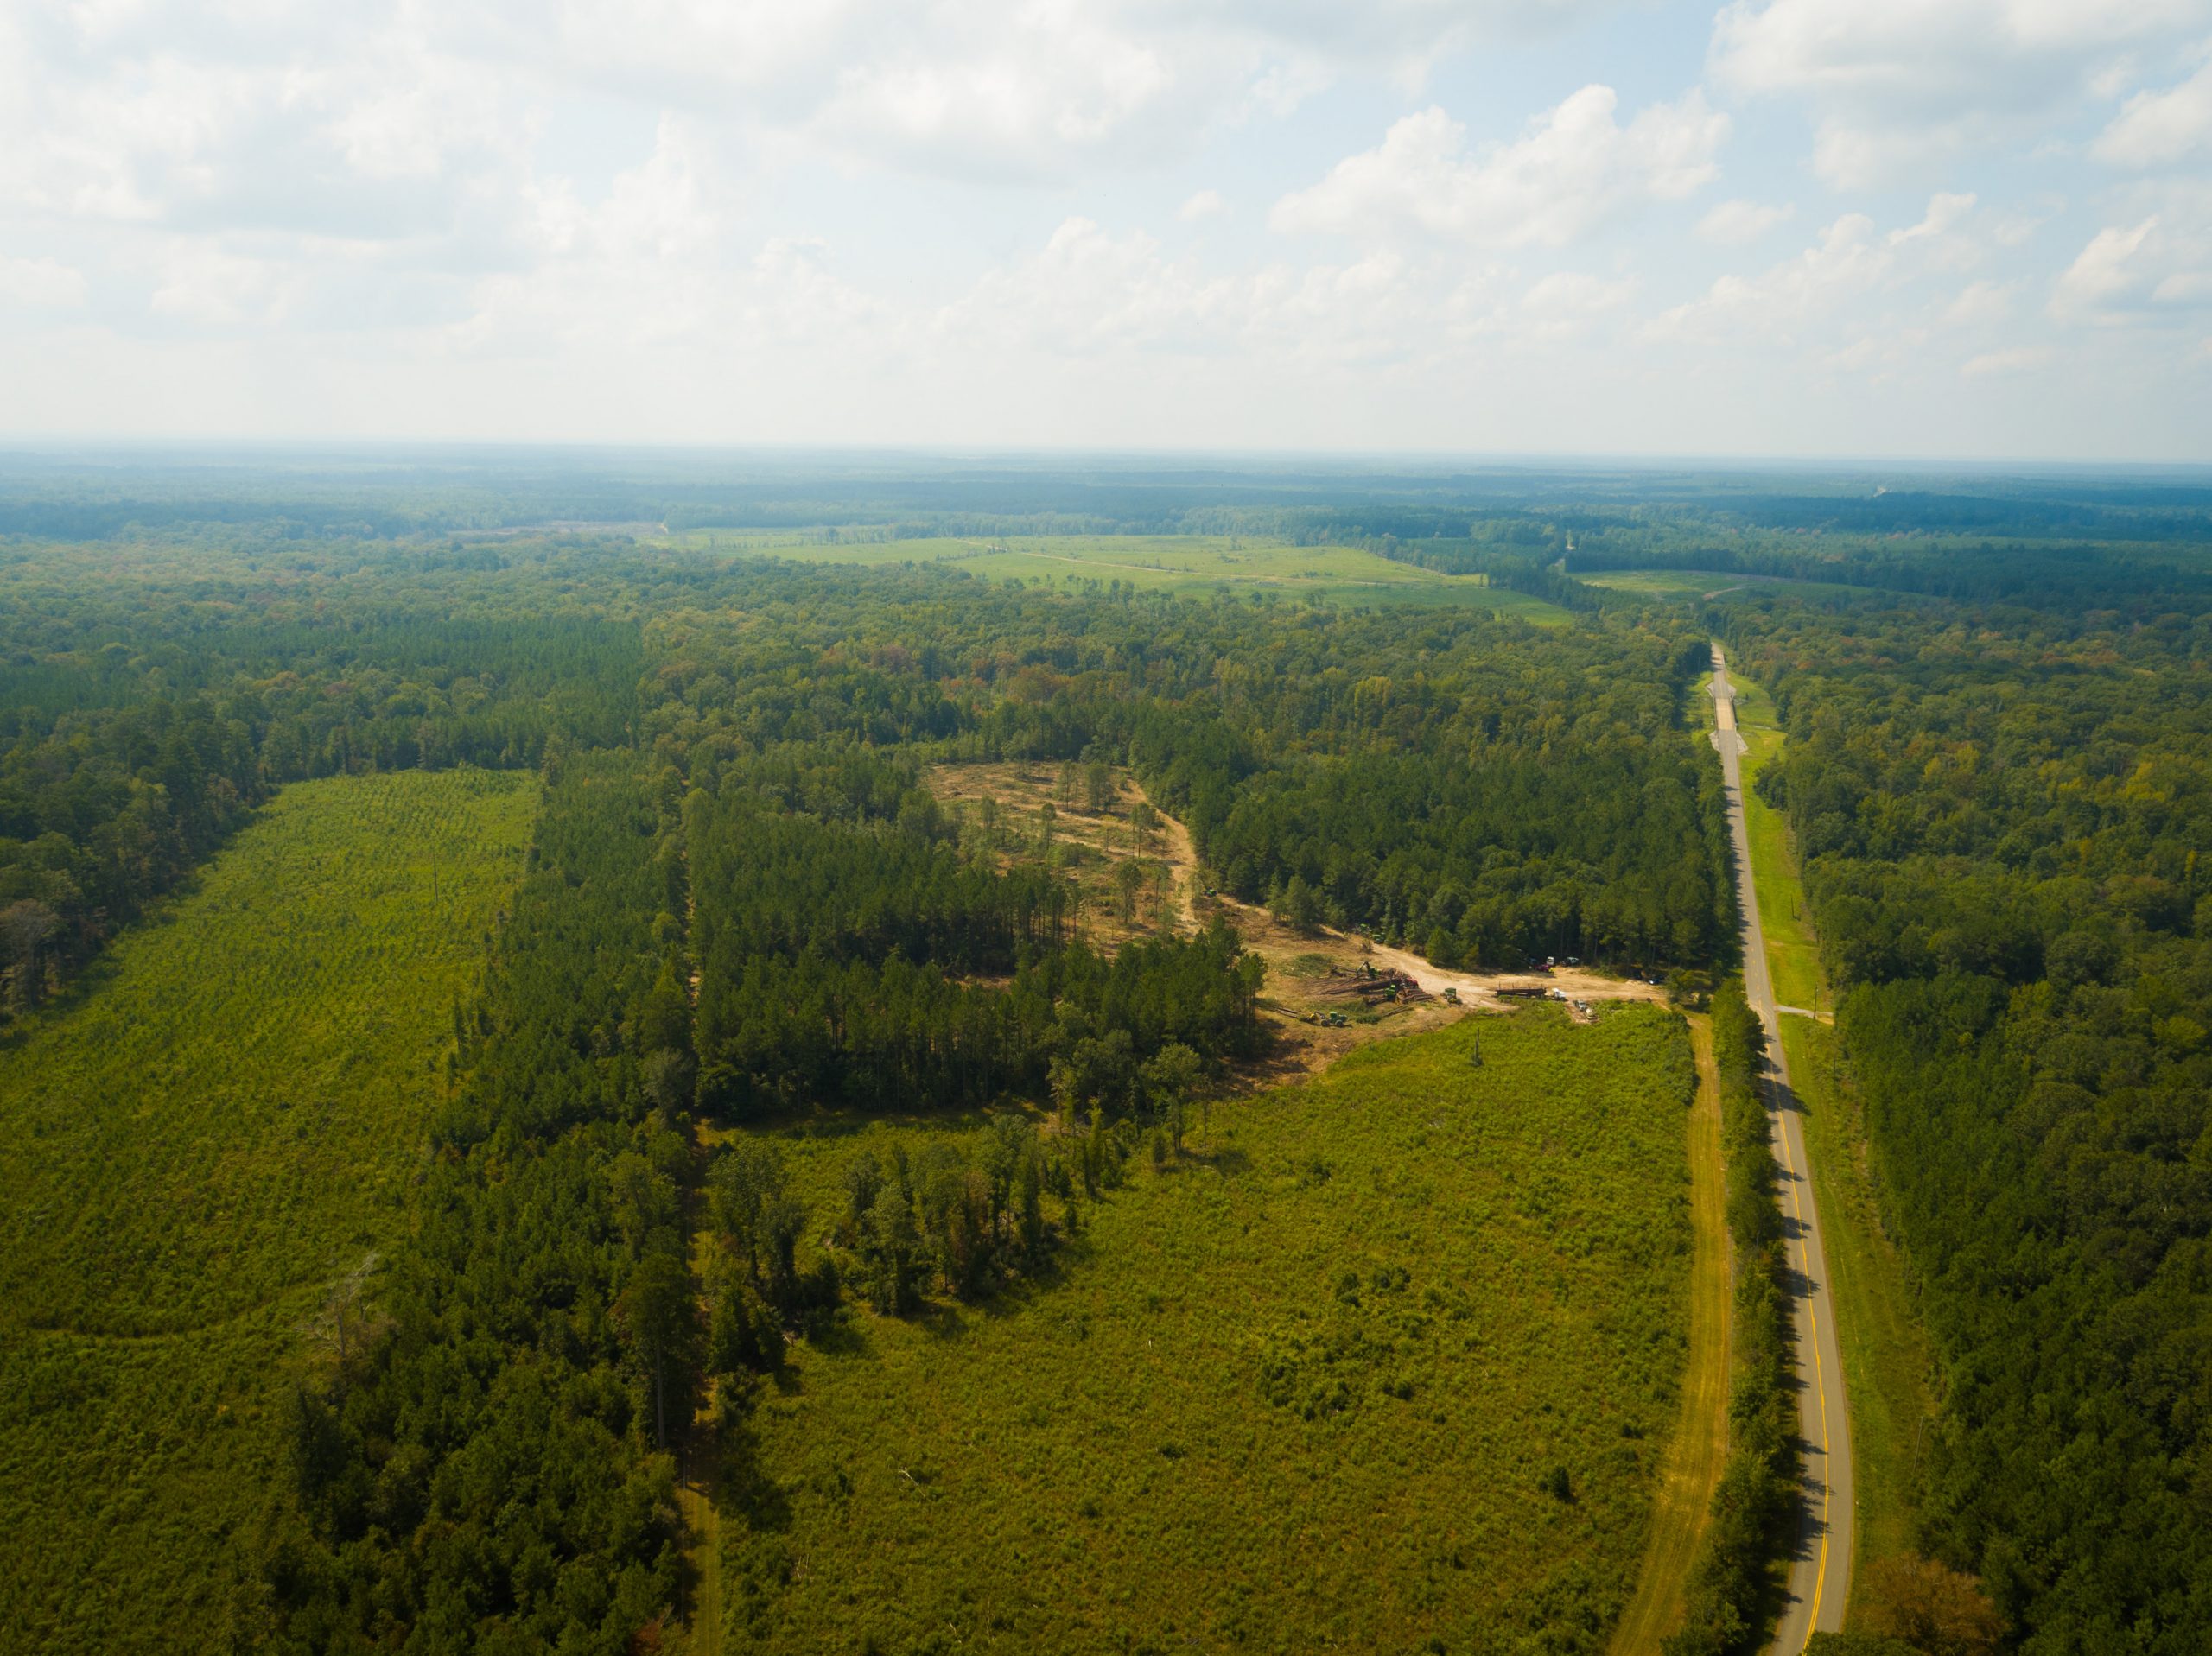
Forest in LaSalle catchment area

Forest in LaSalle catchment area

Read the full report: LaSalle, Louisiana Catchment Area Analysis. Read how a $15m rail link from LaSalle BioEnergy to the Port of Greater Baton Rouge helps Drax reduce supply chain emissions and biomass costs here. Take a 360 immersive experience and video tour of LaSalle BioEnergy.

This is part of a series of catchment area analyses around the forest biomass pellet plants supplying Drax Power Station with renewable fuel. Others in the series include: Georgia MillChesapeakeEstonia, Latvia and Drax’s own, other two mills Morehouse Bioenergy and Amite Bioenergy.
Changing forest structure in Virginia and North Carolina

Photos: Roanoke Rapids area near the North Carolina, Virginia border, courtesy of Enviva.

Forest owners have responded to the recovery in pine saw-timber markets, since the global financial crisis of 2008, by planting more forest and investing more in the management of their land. The same period has witnessed increased demand from the biomass sector which has replaced declining need for wood from pulp and paper markets.

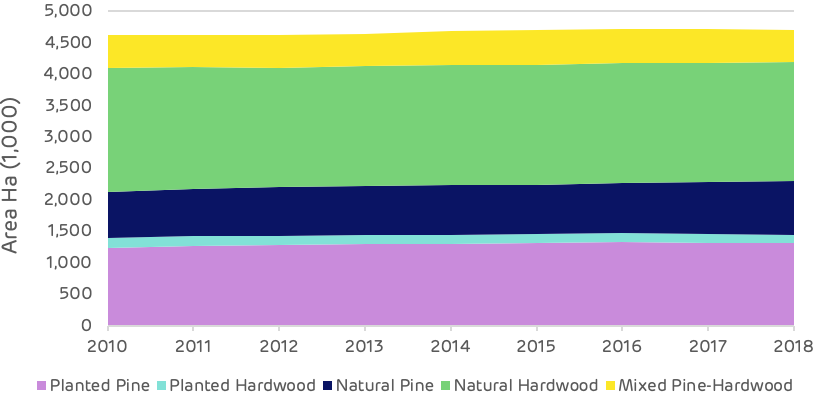
The area of timberland (actively managed productive forest) has increase by around 89,000 hectares (ha) since 2010. This change is due to three important factors: new planting on agricultural land; the planting of low-grade self-seeded areas with more productive improved pine; and the re-classification by the US Forest Service (USFS) of some areas of naturally regenerated pine from woodland to timberland.

The 2018 data shows that pine forest makes up 46% of the timberland area, of which 61% is planted and the remainder naturally regenerated. Hardwoods cover 43% of the timberland area, with 93% of this naturally regenerated. The remaining area is mixed stands.

Composition of timberland area

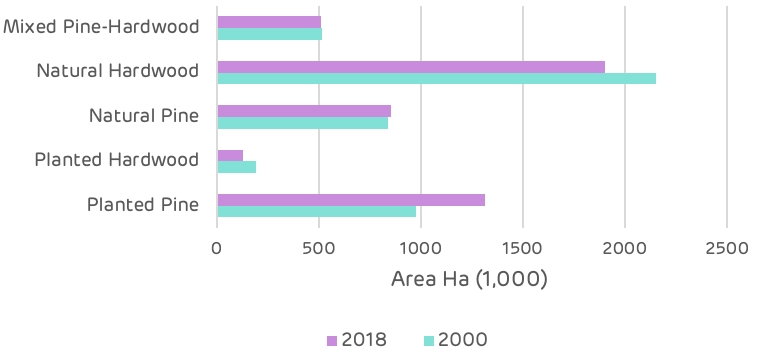
Since 2000 there have been some significant changes in the composition of the timberland area with a transition from hardwood to softwood. Pine has increased from 39% of the total area in 2000 to 46% in 2018 and hardwood has decreased from 50% to 43% over the same period.

All pine areas have increased since 2000 with naturally regenerated pine increasing by 13,000 ha and planted pine by 340,000 ha since 2000. Mixed stands have declined by 6,500 ha as some of these sites have been replanted with improved pine to increase growth and saw-timber production.

The biggest change has been in the hardwood areas where there has been a decline of around 314,000 ha, despite the total area of timberland increasing by 31,000 ha.

Change in forest type

This change has been driven by private forest owners (representing 91% of the total timberland area), seeking to gain a better return on investment from their forest land.

Hardwood markets have declined since the 2008 recession and demand for hardwood saw-timber has not recovered. Demand for pine saw-timber has rebounded and is now as strong as pre-crisis.

Pine also offers much faster growth rates and higher total volumes in a much shorter time frame (typically 25-35 years compared to 75-80 years for hardwoods).

The decision to change species is similar to a farmer changing their agricultural crops based on market demand and prices for each product. Where forests are managed for revenue generation then it is reasonable to optimise the land and crop for this objective. This can be a significant positive, from a carbon perspective more carbon is sequestered in a shorter time frame and more carbon is stored in long term wood products, if the quantity if saw-timber is increased.

Increased revenue generation also helps to maintain the forest area (rather than conversion to urban development, agriculture or other uses).

A potential negative is the change in habitat from a pure hardwood stand to a pure pine stand, each providing a different ecosystem and supporting a different range of flora and fauna. There is no conclusive evidence that one forest type is better or worse than the other; there is a great deal of variety of each type.

Some hardwood forests are rich in species and biodiversity, others can be unremarkable. The key is not to endanger or risk losing any species or sensitive habitat and to ensure that any conversion only occurs where there is no loss of biodiversity and no negative impact to the ecosystem.

It is not clear whether all of the lost hardwood stands have been directly converted to pine forests, some hardwood stands may have been lost to other land uses (urban and other land has increased by 400,000 ha). Some may have been directly converted to pine by forest owners encouraged by the increase in pine saw-timber demand and prices.

Whatever the primary driver of this change it is clearly not being driven by the biomass sector.

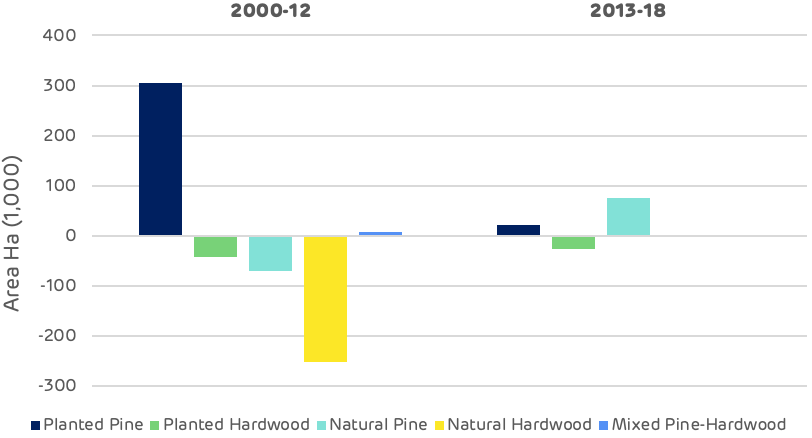
Change in forest type – timing

The chart above demonstrates that the biggest change, loss of hardwood and increase in planted pine, occurred between 2000 and 2012, prior to the operation of the pellet mills. Since 2012, there has been no significant loss of natural hardwood and only a small decline in planted hardwood.

Read the full report: Catchment Area Analysis of Forest Management and Market Trends: Enviva Pellets Ahoskie, Enviva Pellets Northampton, Enviva Pellets Southampton (UK metric version). Explore Enviva’s supply chain via Track & Trace. This is part of a series of catchment area analyses around the forest biomass pellet plants supplying Drax Power Station with renewable fuel. The series includes: Estonia, Morehouse Bioenergy, Amite Bioenergy, and the Drax forestry team’s review of the Chesapeake report on Enviva’s area of operations.

Chesapeake catchment area analysis

Photos: Roanoke Rapids area near the North Carolina, Virginia border, courtesy of Enviva.

Increased timberland, increased carbon stored in the forest, robust prices and new markets benefiting forest owners and forest workers, are among the findings of a report by Hood Consulting.

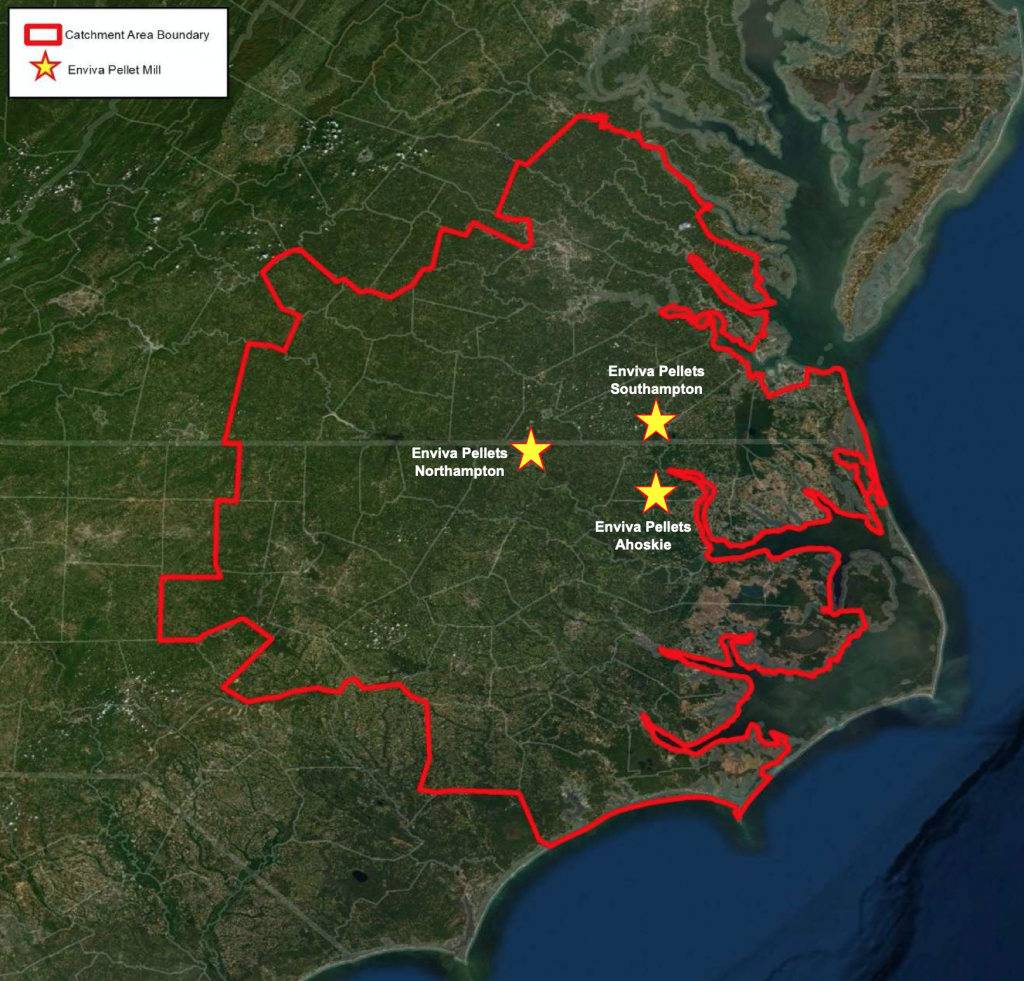
This fourth in a series of catchment area analyses for Drax looks at the area surrounding three pellet plants operated by Enviva: Ahoskie, Northampton and Southampton.

Enviva catchment area in Virginia and North Carolina

Forests and woodlands represent 68% of the total area at just over 5.4 million hectares (ha) with 87% of this area classified as timberland. The area of timberland (actively managed productive forest) has increased by around 89,000 ha since 2010 and there have been some significant changes in forest type.

The overall area of forest has increased and there is no evidence of deforestation occurring.

Land use by area

Since 2000, the total volume of standing timber in the catchment area has increased by 170 million cubic metres (m3). Sixty five percent of this increase has occurred since 2012, indicating a growing/maturing forest resource and an expanding forest area. Most of the increase in volume has been in the saw-timber categories for both pine and hardwood, although the hardwood pulpwood size class has also increased by nearly 10 million m3 since 2012 following a small decline between 2000 and 2012.

Timber inventory by product category

The increased demand from the three Enviva pellet mills, beginning operation in 2012 in the Chesapeake region, appears to have had no negative impact of the accumulation of forest carbon in the growing stock of the region. Since this time, all categories of timber product have increased.

Timber inventory by product category – pre and post-Enviva

This increase in inventory is also reflected in the comparison of average annual growth to removals. The surplus of un-cut growth has increased substantially since 2010 from 4.7 million m3 per year  to 15.9 million m3 p.a. Over this period annual growth has increased by 35.5% whereas removals have decreased by 8.6%.

Annual growth vs. removals and surplus volume

Demand for timber products has fluctuated since 2000. The global financial crisis in 2008-09 impacted all product categories, but particularly pine and hardwood saw-timber where there was a combined drop of over five million tonnes in 2010 compared to 2000. This was a loss of over 20% of total annual demand in the catchment area. Pine saw-timber has now recovered to pre-crisis levels, but hardwood demand has remained low. Hardwood pulpwood demand also declined around this time, with the closure and decline of existing pulp mills in the catchment area. Demand had fallen by one million tonnes p.a. by 2011 prior to the Enviva pellet mills opening. From 2012 the new biomass demand enabled the hardwood pulpwood market to recover to pre-crisis levels with demand in 2018 at almost exactly the same level as in 2000.

Annual demand by product category

This fluctuation in demand is reflected in the average annual stumpage price data shown on the chart below, this is the value that the forest owner gets for each product. The trends are generally as expected, with the exception of the hardwood saw-timber price, which has increased substantially despite a decrease in demand. This is due to supply chain issues, reduced capacity of loggers and access to land.

Average annual stumpage prices

Detailed below is an edited version of the consultant’s review and analysis of key issues in the catchment area.

The full version can be found in the main report.

Is there any evidence that bioenergy demand has caused the following?

Deforestation

No. US Forest Service (USFS) data shows the opposite. The total area of timberland in the Enviva Chesapeake catchment area has increased an estimated 82,818 hectares (+1.8%) since Enviva Pellets Ahoskie commenced full production in 2012.

A change in management practices (rotation lengths, thinnings, conversion from hardwood to pine)?

No / Inconclusive. Changes in management practices have occurred in the catchment area since 2012, but there is little evidence to suggest that bioenergy demand has caused these changes. Conversion of hardwood and mixed pine-hardwood timberland to planted pine timberland has occurred in the catchment area.

Diversion from other markets

No / Inconclusive. Since 2012, pulpwood demand not attributed to bioenergy has decreased 19%; however, this decrease is largely attributed to decreased demand from the pulp/paper sector. Also, demand for softwood and hardwood sawlogs have increased an estimated 14% and 7%, respectively, since 2012.

An unexpected increase in wood prices

No / Inconclusive. The increase in hardwood biomass demand coincided with price increases of 10-24% for delivered hardwood pulpwood. These price increases were likely linked to a combination of both supply chain issues (shortage of local loggers following pulp/paper mill closures in the region) and elevated prices offered by Enviva to ensure guaranteed wood supply for the first several years of operation, as prices for delivered hardwood pulpwood and hardwood chips proceeded to decline 16% and 9%, respectively, from 2014 to2017 once the market stabilised.

Since 2014, prices for pine products have held flat even though softwood raw material purchases (demand) by Enviva have more than doubled. In this catchment area, changes in pine pulpwood and pine chip prices are largely driven by demand attributed to the pulp/paper sector.

A reduction in growing stock timber

No. Total growing stock inventory in the catchment area increased 19% from 2012 through 2018. Over this period, inventories increased as follows for each of the five major timber products: +33% for pine sawtimber, +23% for pine chip-n-saw, +14% for pine pulpwood, +12% for hardwood sawtimber, and +14% for hardwood pulpwood.

The increase in timber inventory can be linked to a combination of increased forest area (additional hectares = additional inventory) and annual harvest levels below the sustainable yield capacity of the catchment area forest (i.e. annual growth has continued to exceed annual removals, resulting in increased inventory levels).

A reduction in the sequestration rate of carbon

No. US Forest Service data shows the average annual growth rate of growing stock timber has increased slightly since 2012. Increased timber growth rates/carbon sequestration rates can be linked to a combination of changes in species composition and silvicultural practices.

Softwood (pine) grows at a much quicker rate compared to hardwood species, and in the Enviva Chesapeake catchment area, pine timberland area increased from 43.6% of total timberland area in 2011 to 46.0% in 2018. Also, improvements in silviculture have continued to enhance growth and overall productivity. Together, these factors help explain how average per hectare volume growth increased from 5.9 m3 in 2011 to 7.7 m3 in 2018.

An increase in harvesting above the sustainable yield capacity of the forest area

No. In 2018, the latest available, growth-to-removals ratio for pine and hardwood pulpwood, the timber products utilised by bioenergy, equalled 2.49 and 2.76, respectively (a value greater than 1.0 indicates sustainable harvest levels). Even with the increased harvesting required to satisfy bioenergy demand, harvest levels remain well below the sustainable yield capacity of the catchment forest area.

What has been the impact of bioenergy demand on?

Timber growing stock inventory

Neutral. Total wood demand increased an estimated 14% from 2012-2018, and much of that increase can be attributed to increased demand from bioenergy. In this catchment area, inventories are so substantial that increases in demand from bioenergy, as well as from other sources, have not been great enough to offset annual timber growth. Total growing stock inventory has continued to increase – an average of 2.9% per year since Enviva first entered this market in 2012.

Timber growth rates

Neutral. Timber growth rates have increased for pine sawtimber, pine chip-n-saw, pine pulpwood, and hardwood pulpwood since 2012; hardwood sawtimber growth rates have declined slightly. Evidence suggests these overall increases in growth rates are linked to changes in age class distribution (i.e. a younger forest), not due to changes in bioenergy demand

Forest area

Positive / Neutral. Total forest (timberland) area in the catchment area increased nearly 83,000 hectares (+1.8%) from 2012 through 2018, the latest available. Our analysis of biomass demand and forest area found a strong positive correlation between these two variables but also a moderately strong correlation between softwood sawlog demand and forest area.

Wood prices

Neutral / Negative. The additional wood demand placed on this market by Enviva from 2012-2014 coincided with a 19% increase in delivered pine pulpwood price and a 24% increase in delivered hardwood pulpwood price. Pine and hardwood chip prices also increased 10-11% over this period. Analysis found evidence that increases in hardwood pulpwood and hardwood chip prices can be linked to increases in total hardwood pulpwood demand. However, given that hardwood bioenergy demand has accounted for over 75% of total hardwood pulpwood demand in the catchment area since 2014, it is reasonable to conclude that hardwood pulpwood demand attributed to bioenergy has had some level of impact on delivered hardwood pulpwood and hardwood chip prices.

Markets for solid wood products

Positive. In the Enviva Chesapeake catchment area, demand for softwood and hardwood sawlogs used to produce lumber and other solid wood products increased 15% and 9%, respectively, from 2012-2018. A by-product of the sawmilling process are sawmill residuals – a material utilied by Enviva’s three mills to produce wood pellets. With the increased production of both softwood and hardwood lumber, so too has come an increase in sawmill residuals, some of which has been purchased/consumed by Enviva.

Not only has Enviva benefited from the greater availability of this by-product, but lumber producers have also benefited, as Enviva’s three mills have provided an additional outlet for these producers and their by-products.

Forest landowners

Positive. Increased demand attributed to bioenergy has been a positive for forest landowners in the Chesapeake catchment area. Not only has bioenergy provided an additional outlet for pulpwood (particularly hardwood pulpwood), but the increase in pulpwood prices as a result of an overall increase in both softwood and hardwood pulpwood demand has transferred through to landowners (improved compensation).

Specifically, since 2013 (the first year all three Enviva pellet mills were operating), hardwood pulpwood stumpage price – the price paid to landowners – has averaged roughly $5.60 per ton in the Chesapeake catchment area. This represents a 47% increase over the approximately $3.80 per ton averaged by hardwood pulpwood stumpage in the catchment area over the 10 years prior (2003-2012). Similarly, pine pulpwood stumpage price has averaged $12.95 per ton in the catchment area since 2013, up 67% from the 2003-2012 average of $7.75 per ton.

Read the full report: Catchment Area Analysis of Forest Management and Market Trends: Enviva Pellets Ahoskie, Enviva Pellets Northampton, Enviva Pellets Southampton (UK metric version). Read the Drax forestry team’s blog ‘Changing forest structure in Virginia and North Carolina. Explore Enviva’s supply chain via Track & Trace. This is part of a series of catchment area analyses around the forest biomass pellet plants supplying Drax Power Station with renewable fuel. Others in the series include: Georgia Mill, Estonia, Latvia, Morehouse Bioenergy and Amite Bioenergy.
Morehouse catchment area analysis

Working forest in southern Arkansas within the Morehouse catchment area

The forest area around the Drax Morehouse BioEnergy plant has a long history of active management for timber production. 96% of the forest owners are private and around half of these are corporate investors seeking a financial return from forest management. The pulp and paper (p&p) sector dominates the market for low grade roundwood with over 75% of the total demand. The wood pellet markets use only 6% of the roundwood, of which 4% is used by Morehouse.

Given the small scale of demand in the pellet sector, the extent of influence is limited. However, the new pellet markets have had a positive impact, replacing some of the declining demand in the p&p sector and providing a market for thinnings for some forest owners and a new off-take for sawmill residues.

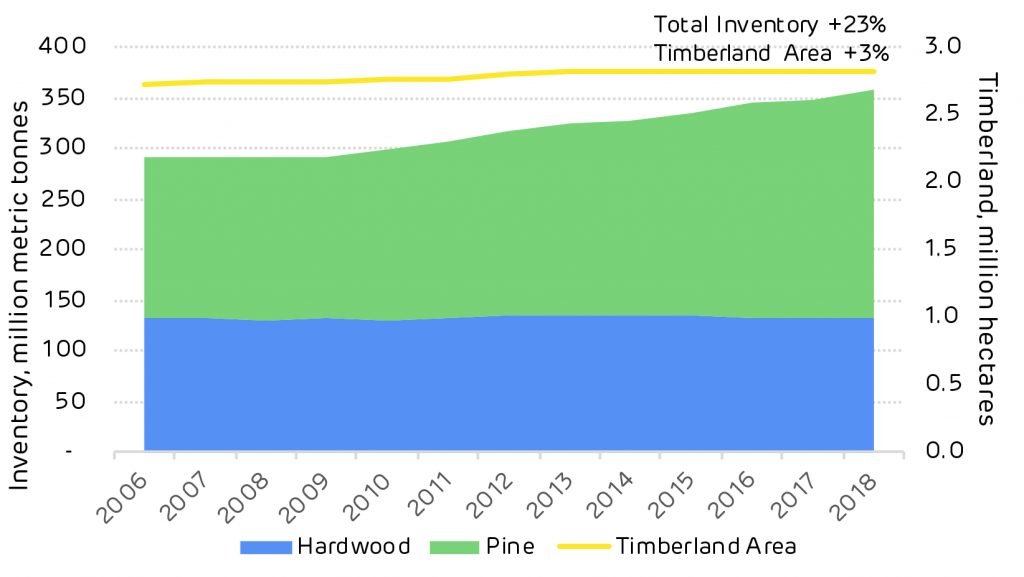
Pine forest is dominant in this area with an increasing inventory (growing stock) despite a stable forest area. Active management of pine forests has increased the amount of timber stored in the standing trees by 68 million tonnes from 2006 to 2018.  Over the same period the hardwood inventory remained static.

Chart showing historic inventory and timberland area in Morehouse catchment

Historic inventory and timberland area in Morehouse catchment; click to view/download.

US Forest Service FIA data shows that the pine resource in this catchment area has been maturing, the volume of timber has been increasing in each size class year on year. This means that the volume available for harvesting is increasing and that more markets will be required to utilise this surplus volume and ensure that the long-term future of the forest area can be maintained.

Chart showing historic pine inventory by DBH Class

Historic pine inventory by DBH Class in Morehouse catchment; click to view/download.

This is reflected in the growth drain ratio – the comparison of annual growth versus harvesting. A ratio of one shows a forest area in balance, less than one shows that harvesting is greater than growth. This can be the case when the forest area is predominantly mature and at the age when clear cutting is necessary.

A growth drain ratio of more than one shows that growth exceeds harvesting, this is typically the case in younger forests that are not yet ready for harvesting and are in the peak growing phase, but it can also occur when insufficient market demand exists and owners are forced to retain stands for longer in the absence of a viable market.
Drax Morehouse plant

Drax’s Morehouse BioEnergy compressed wood pellet plant in northern Louisiana

This can have a negative impact on the future growth of the forest; limiting the financial return to forest owners and reducing the cumulative sequestration of carbon by enforcing sub-optimal rotation lengths.

The current growth drain ratio of pine around Morehouse is 1.67 with an average annual surplus of around 7 million metric tonnes. This surplus of growth is partly due to a decline in saw-timber demand due to the global financial crisis but also due to the maturing age class of the forest resource and the increasing quantity of timber available for harvesting.

Historic growth and removals of pine in Morehouse catchment (million metric tonnes)

YearGrowthRemovalsNet GrowthGrowth-to-Drain
200914.112960762411.1860124622.92694830041.26166145535
201014.580331100610.91819493463.662136166021.33541589869
201115.129903273610.72162297824.408280295451.41115792865
201215.357258404710.30755904395.049699360811.48990254039
201315.63898206189.701617808065.93736425371.61199733603
201415.91041518229.376564771556.533850410651.69682773701
201515.94235364499.669133266476.273220378431.64878828387
201616.43527840789.579357241816.855921165961.71569740985
201716.838075354610.1594737396.678601615681.65737672908
201817.770968348910.65938820047.111580148561.66716588371

The chart below shows the decline in pine saw-timber demand in the catchment area following the financial crisis in 2008. It also shows the recent increase in pulpwood demand driven by the new pellet mill markets that have supplemented the declining p&p mills.

Sawmills are a vital component of the forest industry around Morehouse, with most private owners seeking to maximise revenue through saw-timber production from pine forests.

As detailed in the table below, there are 70 markets for higher value timber products around this catchment area. These mills also need an off-taker for their residues and the pellet mills can provide a valuable market for this material, increasing the viability of the saw-timber market.

Operating grade-using facilities near Morehouse timber market

TypeNumber of MillsCapacityCapacity UnitsHardwood Roundwood At Mill From MarketSoftwood Roundwood At Mill From Market
Consumption, million green metric tonnes
Lumber6810538.8235294M m³1.737194320550.88604623042613.06745552335.69986977638
Plywood/Veneer2904M m³000.9617438725360.506109617373
Total701.737194320550.88604623042614.02919939586.20597939376

Pulp and paper mills dominate the low grade roundwood market for both hardwood and softwood. The pellet mill market is small with just 3 mills and therefore does not influence forest management decisions or macro trends in the catchment area. However, demand for wood pellet feedstock exceeds 1.5 million tonnes p.a. and this can provide a valuable market for thinnings and sawmill residues. A healthy forest landscape requires a combination of diverse markets co-existing to utilise the full range of forest products.

Operating pulpwood-using facilities near Morehouse timber market

TypeNumber of MillsCapacityCapacity UnitsHardwood Roundwood At Mill From MarketSoftwood Roundwood At Mill From Market
Consumption, million green metric tons
Pulp/Paper117634.86896M metric tons3.489826926741.192570970097.557287050371.66598821268
OSB/Panel62412.55M m³002.567325398621.19890681942
Chips178395.08999M metric tons2.938909722111.46484421365.287607151192.18745126814
Pellets31573.965975M metric tons002.078219858451.01128896402
Total346.428736648862.6574151836917.49043945866.06363526426

In its analysis, Forisk Consulting considered the impact that the new pellet mills including Morehouse BioEnergy have had on the significant trends in the local forest industry. The tables below summarise the Forisk view on the key issues. In its opinion, the Morehouse plant has had no negative impact.

Bioenergy impacts on markets and forest supplies in the Morehouse market

ActivityIs there evidence that bioenergy demand has caused the following?Explanation
DeforestationNo
Change in forest management practiceNo
Diversion from other marketsPossiblyBioenergy plants compete with pulp/paper and OSB mills for pulpwood and residual feedstocks. There is no evidence that these facilities reduced production as a result of bioenergy markets, however.
Increase in wood priceNoThere is no evidence that bioenergy demand increased stumpage prices in the market.
Reduction in growing stocking timberNo
Reduction in sequestration of carbon / growth rateNo
Increasing harvesting above the sustainable yieldNo

Bioenergy impacts on forests markets in the Morehouse market

Forest metric Bioenergy impact
Growing Stock Neutral
Growth Rates Neutral
Forest Area Neutral
Wood Prices Neutral
Markets for Solid Wood Neutral to Positive*
*Access to viable residual markets benefits users of solid wood (i.e. lumber producers).

Read the full report: Morehouse, Louisiana Catchment Area Analysis. An interview with the co-author, Amanda Hamsley Lang, COO and partner at Forisk Consulting, can be read here. Explore every delivery of wood to Morehouse BioEnergy using our ForestScope data transparency tool.

This is part of a series of catchment area analyses around the forest biomass pellet plants supplying Drax Power Station with renewable fuel. Others in the series include: ,

Others in the series include: Georgia MillEstonia, Latvia, Chesapeake and Drax’s own, other three mills LaSalle BionergyMorehouse Bioenergy and Amite Bioenergy.