


Energising Britain
Chapter 1:
Foreword, preface, exec summary & intro

Will Gardiner, CEO, Drax Group. Click to view/download in high res.
Foreword
Our world is changing fast.
New technologies are transforming the way we live and work. They are changing businesses and communities and creating huge opportunities to improve our quality of life, and Britain’s ability to compete in a global economy.
This shift is being enabled by a revolution taking place across our energy system – ultimately to a zero carbon, low cost system where technology and data will enable businesses and homeowners to create energy as well as use it, and give them more control over the energy they use.
These changes are creating significant benefits. But as in every transition there is a risk that those most able to take advantage of new technologies will enjoy their benefits first while others get left behind.
A failure to ensure the transition is enjoyed across Britain will also undermine much needed progress to decarbonise our economy and tackle climate change.
Drax, is at the heart of the energy transition. We see these changes taking place every day – across our businesses, and among the customers and communities we serve. What’s less clear is how Britain is faring through this change.
Now, for the first time, this report gives us some answers. Researchers at Imperial College London and E4tech have looked right across our economy. Using 20 different metrics they have assessed progress in critical sectors including power, transport and industry. Crucially they’ve also broken down their findings to a regional level.
The results make stark reading. While real progress has been made in some sectors to decarbonise, others lag behind.
While most nations and regions have taken steps to create the future energy system we need, the picture is not uniform. Most worrying is clear evidence that once again a divide is opening between those parts of the country where people are better placed to take advantage of new technologies – and those who are not.
The conclusion is clear: Failure to address these energy divides will leave some communities falling behind. It will restrict our businesses’ ability to compete in a fierce global economy. And our efforts to tackle climate change will be hindered.
To respond energy companies, businesses, communities and governments must work together. Drax is committed to play our part.
I’m proud of the contribution we have already made. We have transformed the UK’s largest coal-fired power station to become the biggest decarbonisation project in Europe and the country’s biggest renewable power generator. Today, we maintain significant generation capacity and aim to bolster our ability to provide flexible, low-carbon generation further − supporting the increase in solar and wind power across Britain’s energy system. We’re trialling innovative Bioenergy Carbon Capture Use and Storage technology, which is the first of its kind in Europe and has the potential to deliver negative emissions. And through our retail businesses we are helping thousands of business switch to use 100% renewable energy, and use it more efficiently.
But, this report shows us there is much more to do.
We will continue to invest in and develop the new technologies which will finish the job of taking Drax off coal, ensure we become zero carbon and play a bigger part in decarbonising the wider economy.
And, we will continue to help our customers reduce their own carbon emissions, save money and create new revenues from energy production which will boost their ability to compete in their own markets.
Our role is clear. Drax is enabling a zero carbon, lower cost future for all.
This report reinforces the challenges ahead, but also the opportunities to meet them. I commit Drax to playing our part to do so.

Authors:
Dr Iain Staffell, Dr Malte Jansen: Imperial College London
Adam Chase, Chester Lewis, Eloise Cotton: E4tech
Please refer to this report as:
I. Staffell, M. Jansen, A. Chase, C. Lewis and E. Cotton, 2018.
Energising Britain: Progress, impacts and outlook for transforming Britain’s energy system.
Drax Group: Selby.
Please see the PDF version for footnotes, references and appendices not contained within this web version.
Preface
This report was commissioned by Drax Group and delivered independently by academics from Imperial College London (facilitated by the College’s consultancy company, Imperial Consultants), and consultants from E4tech.
Drax Group commissioned the authors to conduct new research into how transformations in Britain’s energy system are likely to impact the country’s economic, societal and environmental outcomes.
The aim of this research is to provide insight into the changes that are occurring and those that are needed to ensure that energy system transformation unlocks opportunities for businesses, government and households in a just and equitable way.
This report is the independent opinion of the authors. It focuses on Great Britain rather than the United Kingdom as lack of data prevented Northern Ireland from being included.
Drax Group
Drax Group plc plays a vital role in helping change the way energy is generated, supplied and used for a better future. Its 2,300-strong staff operate across three principal areas of activity – electricity generation, electricity sales to business customers and compressed wood pellet production.
Imperial Consultants
Imperial Consultants provide access to over 4,000 research-active expert academics and Imperial College London’s state of the art facilities to deliver innovative solutions to meet the business needs of industry, government and the third sector.
E4tech
E4tech is an international strategic consultancy focused on sustainable energy. E4tech helps clarify and simplify complex and uncertain situations, to achieve solutions that are technologically, economically and environmentally sound
Executive Summary
Why this report matters
Major pressures are shifting the UK’s patterns of employment, leisure, travel and industry, with consequences for our energy needs. At the same time, the UK has made strong commitments to reduce greenhouse gas emissions related to energy. Many towns and cities struggle with chronic air pollution from cars, vans and lorries. Businesses and households face rising energy bills, putting a squeeze on both economic competitiveness and quality of life.
Electrification is essential, touching all elements of Britain’s changing economy and energy system. Renewable electricity has radically transformed the power sector, and electric vehicles are poised to revolutionise transport. Electricity could lower the cost and pollution from home heating and the daily commute, as well as the way in which large buildings and factories operate. Alongside electricity, other ingredients of the future energy system will include a growing role for data, minimising energy use when power is in short supply and maximising use when and where it is plentiful, flexibly managing demand and supply, making intelligent use of low carbon fuels and heat, and potentially capturing greenhouse gases. Together these changes are known as the ‘energy revolution’. There is strong global evidence of the imperative for this significant and – increasingly – urgent change.
Work towards the energy revolution is underway in UK, but so far much of the action has been behind the scenes. The sweeping changes to how we generate electricity have not changed what happens when you turn on the lights at home, but the next steps will impact on everyday life for many. The emergence of electric vehicles, intelligent home energy management and zero-carbon buildings are all necessary to stay competitive and honour our climate change and related policy targets. These will have profound implications on the cost of energy and how people receive energy services, so it is imperative to outline these changes for stakeholders of all types.
The UK’s energy transition is well described by national and international expert bodies, but mainly looking at individual components of the system in terms of technologies, costs and benefits. These studies treat countries and continents as a whole, potentially missing the important socio-economic and environmental differences that exist within countries.
This assessment is the first to examine Britain’s energy transition at the regional level, showing where each aspect of the energy system currently stands and where it must go to avoid being left behind.
This assessment is the first to examine Britain’s energy transition at the regional level, showing where each aspect of the energy system currently stands and where it must go to avoid being left behind. It looks more broadly than raw emissions reductions to consider the many infrastructural enablers for revolutionising the energy system.
Crucially, it explores what these changes will mean for individual households, businesses and society as a whole, and exposes the important regional differences that are developing within Britain. Without awareness of these regional disparities and their potential impacts, Britain risks creating a two-tier energy system, where some get ahead with the fuels and technologies of the future, while others are left behind with the higher costs, environmental and health problems that come from burning legacy fossil fuels – leaving millions of families and businesses less equipped to enjoy cheaper bills and better outcomes.
Britain risks creating a two-tier energy system, where some get ahead with the fuels and technologies of the future, while others are left behind with the higher costs, environmental and health problems that come from burning legacy fossil fuels – leaving millions of families and businesses less equipped to enjoy cheaper bills and better outcomes.
Britain’s energy transition progress
This report analyses Britain’s complex and highly interdependent energy system by considering power generation and then energy use in transport, buildings and industry.
Within these four sectors, 20 measures have been devised to represent Britain’s progress towards having an energy system that’s fit for the future, and can serve households and businesses with clean, secure and low-cost energy. Aggregate progress is summarised with a ‘barometer’ below for three of the four sectors.
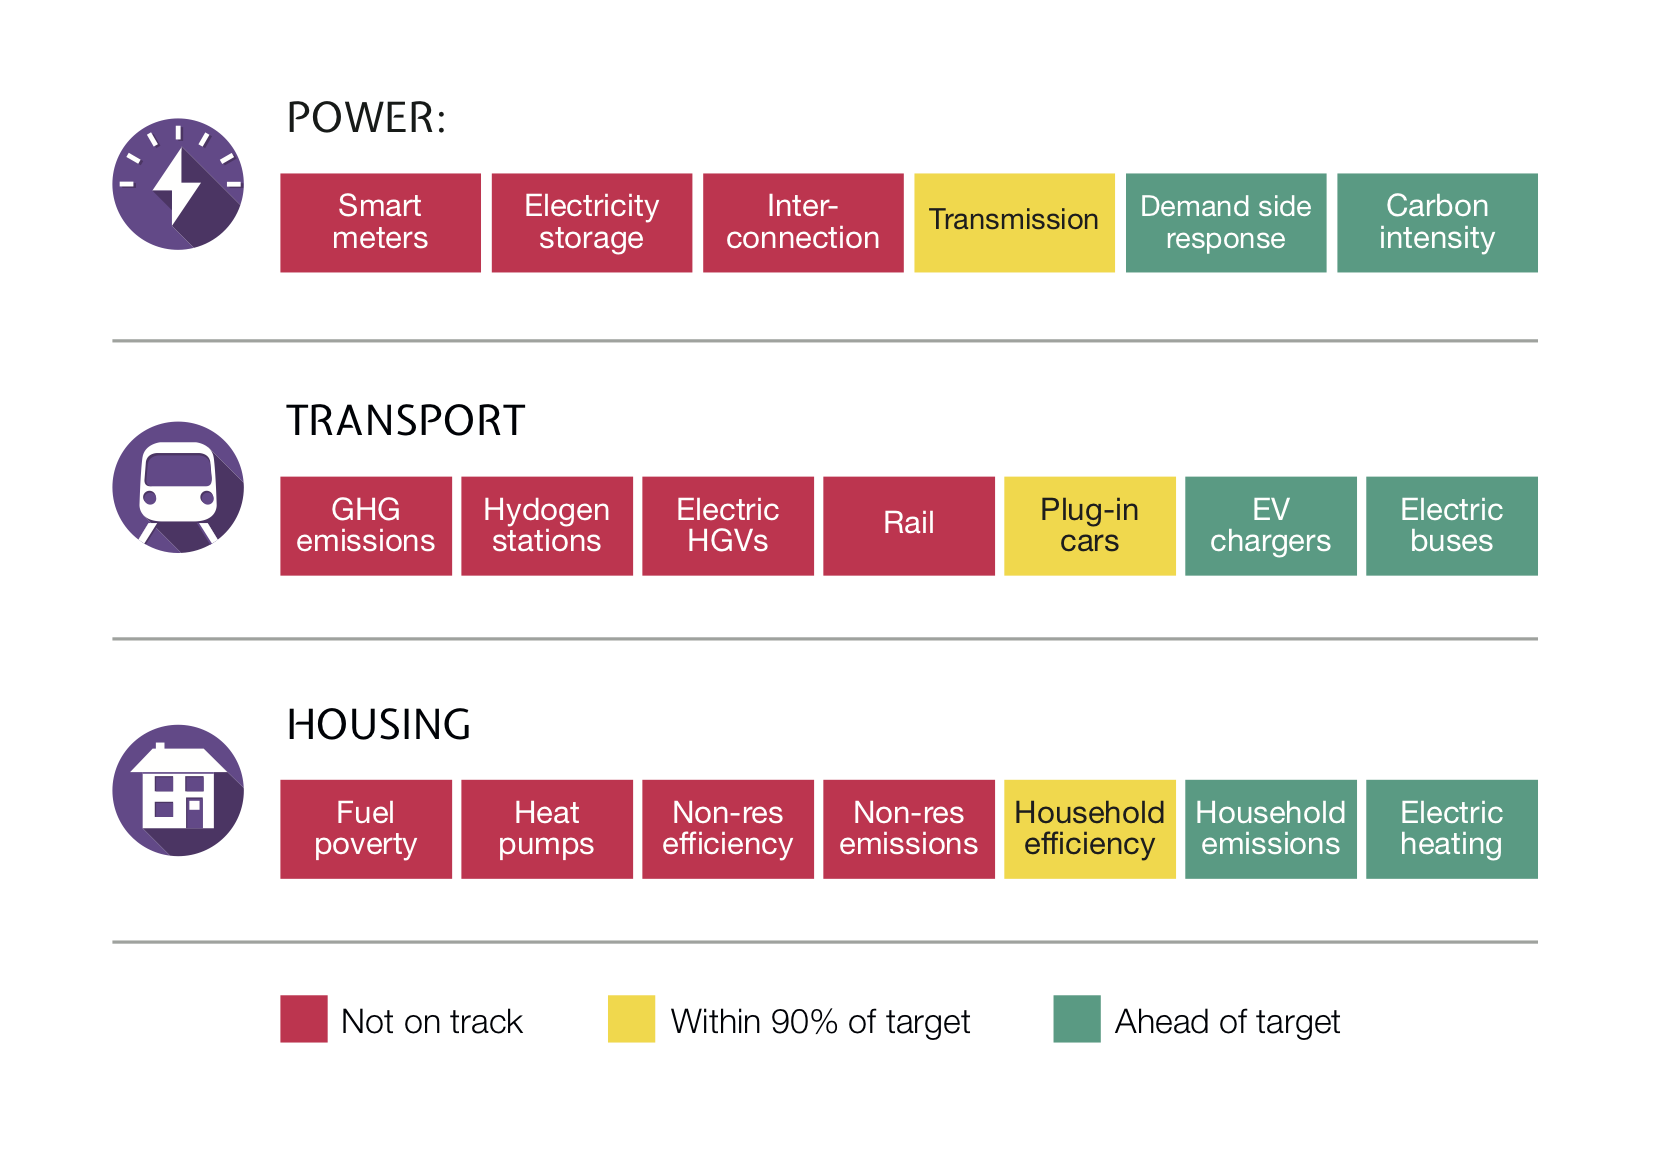
Britain’s greenhouse gas (GHG) emissions have fallen since 1990, but the decline is not evenly distributed across energy sectors. The outstanding success has been in the power sector, chiefly through closing coal-fired generation and the rise of renewables, also benefiting air quality. Further progress is expected, raising the importance of a smart and flexible power system that features demand side response, storage, interconnections and smart meters. Most of these areas are behind target, requiring immediate efforts to bring them in step with growing renewables.
The rapid clean-up of the power sector has fed through into electricity-consuming areas such as industry, where economic growth has decoupled from GHG emissions. Britain’s industry is currently on track to reach climate targets. Absolute electricity use in industry has stayed constant while fossil fuel combustion has declined, as processes have been electrified and efficiency increases have been made. Further electrification will be harder, so GHG reductions may need to come through technologies such as hydrogen and carbon capture use and storage (CCUS).
All of this is made harder still by the need for most industries to remain internationally competitive whilst avoiding the ‘offshoring’ of emissions and jobs to other countries.
In contrast with the power sector, the limited pace of transformation in transport and domestic heating means that there is much more to do. Of particular concern is air quality in Britain’s cities and the slow progress being made on diesel pollution, but CO2 emissions from transport are also on the rise, especially from goods vehicles. The stage is set for a radical shift in transportation thanks to recharging infrastructure growth and EV sales picking up; over a quarter of new vehicle sales are expected to be ‘plug-ins’ by 2030 and forecasts are frequently being revised upwards. Electric buses are finding a place in cities where pollution is a pressing problem, but electric goods vehicles are some way behind. Hydrogen vehicles and infrastructure remain in their infancy in UK, though these provide a zero emission option for goods vehicles, where batteries appear less suitable. Furthermore, hydrogen may offer a means to electrify railway lines where the cost of overhead power lines is prohibitive.
The efficiency of Britain’s building stock is a critical issue, with 13% of homes suffering from fuel poverty, and non-domestic buildings generally worse than households. UK buildings remain largely heated by fossil fuels, so only a few parts of the UK are well-placed to benefit from the decarbonisation of power through electric heating. The outlook for heating is unclear, with heat pumps, electric heating and hydrogen each having their proponents, but no overall direction. Regardless of the pathway choice (which is needed urgently) building efficiency will be a core feature. Thankfully, appliances and lighting in buildings have seen improved efficiency and thus reducing pressure on energy bills and indirect GHG emissions from the power sector.
Regional disparities
Progress in transforming Britain’s energy system is uneven and this report reveals marked differences between the regions.
Generally, more affluent regions have made significantly greater progress. The north of England is falling well short, with only
London and Scotland coming close to being on track to meet their overall targets. This first step towards exposing the differences between the regions paints an instructive picture of Britain’s unequal progress, and it should be remembered that differences within individual regions will be similarly important.
Renewable power generation is distributed according to natural resources, so England has much less low-carbon power per person than Scotland and Wales. However,
Scotland and Wales also have some of the lowest transmission capacities to neighbouring regions, holding back further development of renewables. In contrast with the general picture for most metrics, Wales and the North East have the highest penetration of smart meters in Britain, London the lowest.
In a fast-changing transport picture, the West Midlands and the East currently have the highest uptake of passenger electric vehicles, London has the most electric buses, while the South East, northern regions of England and Scotland have the highest share of ultra-low emission HGVs. On an absolute basis, however, the south of England is leading in the deployment of plug-in electric vehicles, which is correlated to higher household incomes in these regions.
Energy efficiency in buildings is neglected across Britain, and much lower than is justifiable. However, it is generally better in the south of England and Scotland and worse in the Midlands, northern England and Wales. The North East has done the most to fix low-efficiency houses, but still has high fuel poverty rates due to income levels and remaining poor quality buildings.
Implications for individuals, businesses and society
Cost reductions in key technologies such as renewable generators and batteries show that the costs of transforming the energy system could be modest. Ultimately, moving to modern clean energy could result in the lowest bills, although any increased capital costs to consumers and businesses should be considered in the context of affordability.
Homes and companies in London and the South East spend less on energy relative to income. Those in Wales and the North East spend the most, so any changes to energy costs will make the greatest difference to the welfare and profits of homes and businesses in these areas. In transport, the total cost of owning electric vehicles is on track to reach parity with conventional vehicles. However, the higher upfront purchase price of EVs poses a greater affordability barrier in less affluent regions. Scotland and
Wales have lowest EV affordability, the West Midlands and London the highest. If marked differences in uptake arise from this, Britain’s cities could see rising inequality due to the health effects of air pollution.
In industry, further electrification may be difficult without impacting on energy costs, unless measures are taken to level the playing field. The changing power mix is shifting employment patterns, with job losses in fossil fuels offset by gains in new industries, often in poorer remote areas. Electrification and automation often go hand in hand, and the South East, Midlands and north of England face the highest risk of job losses from automation.
Overall conclusions
In this first assessment of Britain’s energy transition, there is much to be positive about, but the observation that “the future is already here – it’s just not very evenly distributed” applies.
The rapid decarbonisation of electricity is a feather in the UK’s cap, providing a means to transform electricity-intensive sectors. Buildings and to some extent industry are already benefiting, whilst transport is potentially well-positioned.
There are tough challenges ahead though, since areas such as heavy industry, freight transport and some parts of heating do not immediately lend themselves to electrification, so other options need to be considered.
The uneven distribution of change also applies regionally and socially. A looming concern is the effect of disparities in the energy transition, with some at risk of being left behind economically due to unaffordable changes.
As in other walks of life London stands apart, whilst less affluent regions in the north and elsewhere are falling behind on many measures.
As in other walks of life London stands apart, whilst less affluent regions in the north and elsewhere are falling behind on many measures. If the sole aim of the transition were to decarbonise energy, it might be rational to focus on wealthier metropolitan areas like London ahead of the rest of the country. However, if this begins to affect our way of life through the cost of energy, quality of services and air pollution then such a strategy risks creating a twotrack energy system that worsens regional inequality. To be effective, the UK’s energy transformation needs be a force for good across society and across the UK, not just where it is most convenient.
To be effective, the UK’s energy transformation needs be a force for good across society and across the UK, not just where it is most convenient.

Introduction
1.1 Context and motivation
The energy transition is being driven top down by climate and environmental policy and bottom-up by evolving consumer preferences and technological innovation. Britain has made excellent progress in transforming its power sector, at a world-leading pace, which has allowed decarbonisation that is largely invisible to consumers – no change in lifestyle, added daily considerations and little impact on bills.
There is a growing recognition that change must now sweep through other sectors; we must transform the way energy is provided in homes, businesses, transport and industry. There is a huge opportunity for newly-cleaned electricity to transform these sectors.
The key gaps are:
- Understanding how the country is progressing more broadly towards a transformed energy system. Carbon emissions are well understood, but are the wider changes to electrification and its enabling infrastructure also making headway
- Understanding the differences within Britain – national studies mask regional differences – are we at risk of creating winners and losers in the energy transition?
This change could have profound social and economic implications for the country.
If some sectors or regions forge ahead and others are left behind, this could create a two-speed economy and lead to substantial differences in the cost of energy.
Some may be forced to use legacy infrastructure and support it together with a dwindling consumer base, whereas others may take advantage of affordable lowcarbon solutions independent from these costs.
1.2 Scope and methods
1.2.1 About this study
This study sets out to explore the current status of the power system and how it needs to change to deal with electrification demands and the need for low-carbon power. The current status, targets and regional disparities in the energy transition in end-use sectors are mapped. Finally, the implications that can be drawn from these results for technologies and socio-economic factors are evaluated, focussing on affordability, competitiveness and jobs.
This work was commissioned by Drax to assess the state of energy system transformation across all sectors. It is delivered independently by academics at Imperial College London and sustainable energy consultants E4tech. This report is the start of an ongoing discussion titled Energising Britain, where future outlook reports will address aspects of the energy transition.
1.2.2 Technological and geographical scope
The Energising Britain work examines Britain’s energy system in the context of the 2008 Climate Change Act and the COP21 Paris Climate Agreement. To achieve this, not only power but also the transport, buildings and industrial energy sectors need to be decarbonised.
Given the ongoing decarbonisation of the electricity system and the continuously falling costs of renewables, this work investigates how all energy sectors can be decarbonised through electrification. This entails the use of lowcarbon generation technologies, hydrogen and carbon capture use and storage (CCUS) where suitable.
To understand the regional differences in how Britain’s energy system is being transformed, this report considers the 11 unitary regions of Great Britain (Scotland, Wales, and 9 in England). Northern Ireland could not be included due to the availability of data, and because of the different electricity markets operating on the islands of Ireland and Great Britain. Northern Ireland accounts for approximately 3% of the population and energy consumption of the UK.
1.2.3 Underlying methodology
The main principle for our assessment is to derive metrics that identify the state of transition of the energy system.
These metrics are presented as a ‘barometer’ which sets out three points:
- the end-point of the transformation for the target year in the scenario (e.g. total number of EV charging points in 2030),
- the current state of transformation (e.g. number of charging points operational), and
- an indication of where we would
have to be to meet the target
(e.g. number of charging points).
Justifiable targets for each metric are derived which show the state of transformation and where we should be if we are to fulfil our legal obligations. The end-point targets allow us to locate our position in the energy transition in line with carbon budgets and climate targets.
National and regional level data have been gathered for each metric in order to explore regional disparities and their implications for people. This translates energy systems findings into social and economic implications. The analysis is based on public data, primarily government sources, providing transparency, accuracy and independence. Especially in the case of target definitions for individual metrics, the study relies on energy system scenarios, published by National Grid, HM government including BEIS and the Committee on Climate Change (CCC).
1.3 Background
1.3.1 The regions of Britain
Figure 1.1 presents some underlying indicators for the 11 unitary regions of Britain (and Northern Ireland) for context.

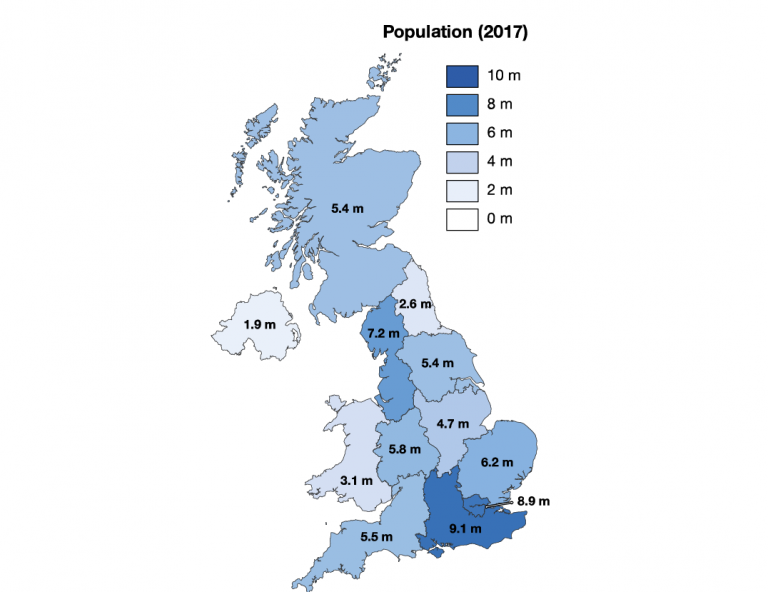

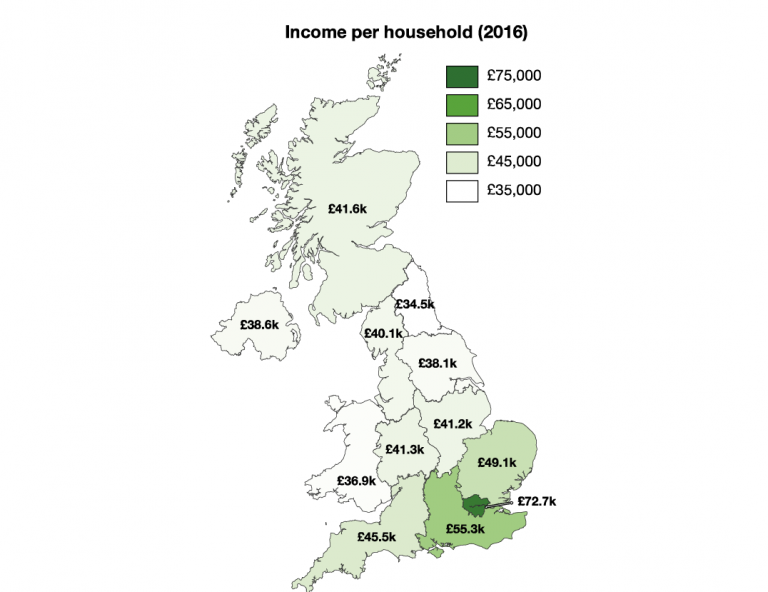
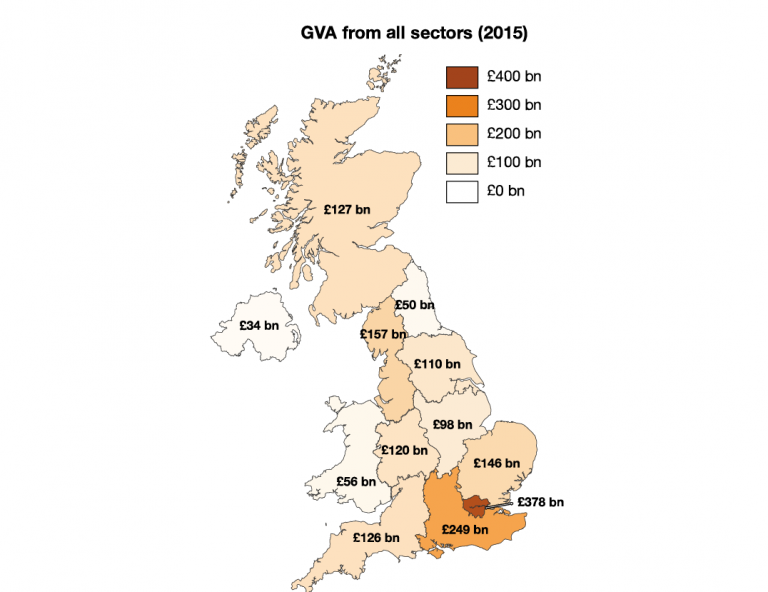
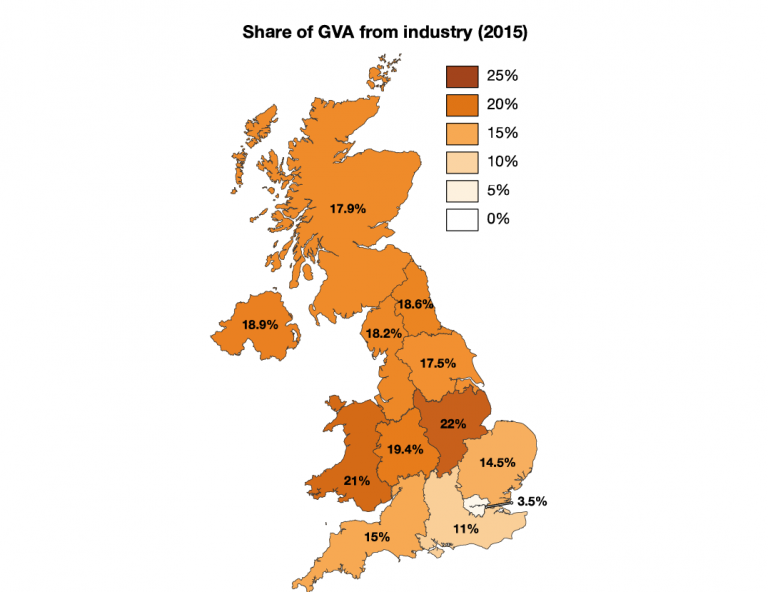
Figure 1.1: Key socio-economic indicators for the UK’s 12 unitary regions.
There are already many differences in the regions’ starting points: London stands out as a purely urban region with high incomes and population density; the Midlands and Wales are the most industrialised; wealth is divided between north and south.
As this study investigates the socio-economic impact of the energy system transition, it must be noted that the unitary regions have different starting points.
Some regions may have an advantage, for example in terms of income or commercial and industrial economic activity and are therefore better positioned to make certain changes. The overarching question is whether the energy transition changes this picture for better or for worse.
1.3.2 What is electrification?
The general discussion on electrification of the energy sector is often focussed on the electrification of road and rail transport. This ignores the fact that many other areas of the economy and society in Britain are being electrified. Therefore, this study provides a more holistic approach at the decarbonisation of all energy sector (power, building, transport and industry) and answers the question on what the electrification of Britain’s economy will look like and the technologies involved.
On the supply side, i.e. the power system, low-carbon technologies to mitigate greenhouse gas (GHG) emissions are in focus as well as technologies that allow for the integration of these low carbon sources (e.g. energy storage). The study identifies a list of technologies which are considered relevant when electrifying the energy system. As these technologies mature, the picture will change and this list will have to be adjusted. The technologies that are currently relevant in the power sector are wind and solar, nuclear, batteries and storage, gas-fired generators with carbon capture use and storage (CCUS), grid expansion and construction of interconnectors, smart meters and demand side response (DSR).
On the building side, besides increasing energy efficiency, we are looking at electrifying heating with heat pumps and electric heaters. The transport sector of the energy system includes the state and target for key transport technologies, such as electric vehicles (cars, buses and HGVs), charging points, hydrogen refuelling station and electrification of rail.
Lastly, the current status of industry and implications from trends in the industrial sector are discussed. It is noteworthy that this sector has the least data coverage. As the energy system transition continues, measuring the progress in industry will be required to track the overall progress towards climate targets and avoid unintended socio-economic implications of a transitioning energy system. The heterogeneity of industrial processes requires an approach which presents key metrics, such as energy intensity as a function of Gross Value Added (GVA), GHG emissions or energy use. The social-economic implications of the energy system transition to further electrification and/or automation are presented.
1.3.3 The sectors in context
This study investigates the power, transport, buildings and industrial sectors and the extent of their transformation. All sectors need to decarbonise to ensure the overall national target is met, meaning that many sectors will need to undergo further transformations.
Sectors, such as agriculture, remain outside the scope of this study, but do, however, contribute to net GHG emissions. Electricity supply is being treated as its own sector, meaning the related GHG emissions from electricity production are attributed to the sector. GHG emissions only include direct emissions for the end-use sectors, unless otherwise specified, therefore excluding the indirect emissions associated with electricity use.
The power sector has seen large reductions in GHG emissions (Section 2.1), causing the energy supply sector to heavily decrease its share of total GHG emissions over the last 5 years (Figure 1.2). In 2017 over two thirds of electricity supply was consumed by buildings, just under a third in industry and the remaining small percentage in transport (Figure 1.3).
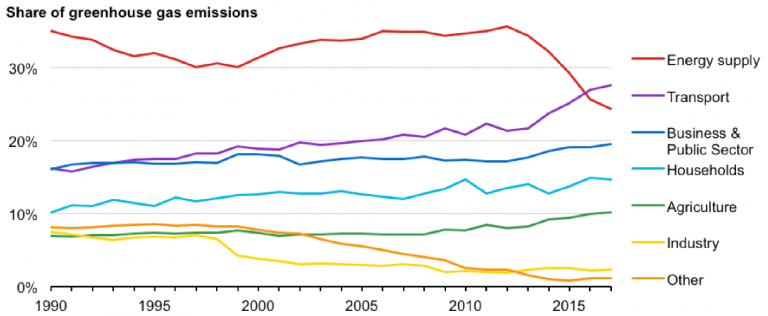
Figure 1.2: Greenhouse Gas Emissions by sector, 1990–2017 – direct emissions accounted from source
The transport sector’s relative share of total GHG emissions has been increasing since 1990 (Section 3.1) and for the first time in 2016 the share of transport emissions surpassed the share of emissions originating from the energy supply sector. In absolute terms, however, total GB transport emissions have decreased compared to 1990 and 2008. This is likely linked to the global recession, increased fuel efficiency, and increased use of renewable energy in transport. Only 2% of the energy used in transport comes from electricity, and this has remained fairly constant since at least 2008 (Figure 1.4). The sector is still heavily reliant on fossil fuels, though there have been recent increases in the use of biofuels and electricity, especially in road transport.
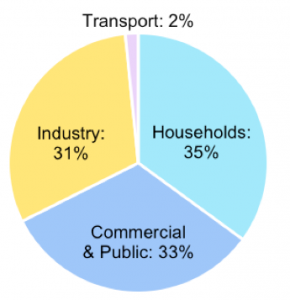
Figure 1.3: The share of electricity in total energy consumption by end-use sectors in 2017.
Emissions from buildings are a combination of the Household and Business & Public Sectors in Figure 1.2. In 2017, GHG emissions from buildings accounted for 19% of total GHG emissions (Section 4.1). The share of direct emissions from all subsectors of buildings have remained relatively constant since 1990, with the residential sub-sector showing a small increase. In absolute terms, all of these subsectors, thus the buildings sector as a whole, have significantly reduced their direct emissions during this period. Electricity use in buildings has remained relatively constant since 2008, suggesting that direct emission decreases are linked to other factors rather than increased electrification rates (e.g. energy efficiency).
Emissions from the industrial sector are composed of emissions related to industrial processes, as well as some business and power sector emissions. In 2017, the industrial sector made up 23% of total GHG emissions. The emissions from industry are discussed in more detail in Section 5.2. Further, electricity use in industry has consistently remained around a third of total energy usage (Figure 1.4).
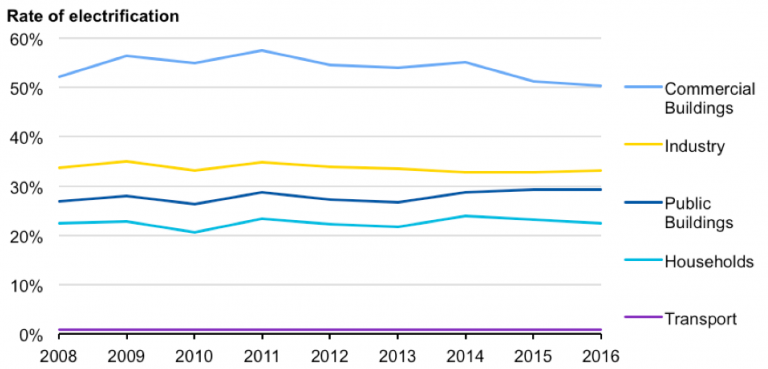
Figure 1.4: The use of electricity in the sector as a percentage of total energy consumption
As mentioned above, electricity usage in the sectors investigated for this report has remained fairly constant since 2008. Increasing electricity use can reduce the direct emissions of an end-use sector, especially if the electricity is replacing a fossil fuel.
However, depending on the carbon intensity of the power sector, total (direct and indirect) greenhouse gas emissions could increase.
Chapter 2:
The power system
The UK’s carbon budgets require major decarbonisation of energy supply. By 2050, virtually all electricity must come from clean sources. Large scale use of intermittent renewables will require extensive flexibility options for balancing.
Many options exist: interconnection, storage, demand side response and flexible generation; so consumers should not see any difference in terms of supply quality.
The current pathway relies heavily on wind and solar power, driven by the large cost reductions they have experienced. If these intermittent renewables continue to dominate future electricity supply, the location of power generation will change and the economic activity that comes with it – favouring rural and coastal areas.
The roll-out of smart meters is taking place at very different speeds across Britain. Wales is leading whereas London is lagging. The structure of the housing sector is a strong influence: lower home ownership places some regions at a disadvantage.
Demand response from commercial and industrial sites is already active, but the large domestic resource (e.g. smart appliances such as fridges and washing machines) cannot be tapped without rollout of smart meters.
Energy bills may be higher than today regardless of power sector transformation, due to rising fossil fuel system service costs. However, large cost reductions in key technologies such as renewables, batteries and hydrogen suggest that regions which can take advantage of these (through electric vehicles and heat pumps) could see the cheapest energy.
Renewables have led to job creation, especially in poorer regions. Scottish renewables have created a strong new industrial sector.
Job losses in the legacy fossil-fuel sectors are offset by growth in renewable industries. The dispersed nature of renewables means that the jobs created in construction, operation and maintenance are in more remote areas, giving a welcome employment boost.
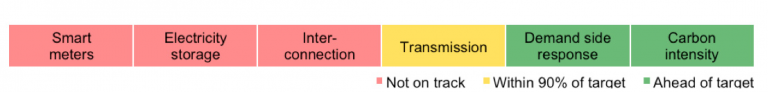
Figure 2.1: Progress towards transforming Britain’s power system, highlighting the areas that are under- and overperforming relative to near-term targets for decarbonisation. Each area is reviewed later in this section
2.1 Current status and future targets for the power sector
The following section will give a detailed analysis on the current status of the power sector, and how it is progressing against its targets. Overall the sector is on track to achieve three out of the six targets examined for this research (with three being well on track) (Figure 2.1). Further, it is falling behind on three other targets. The effects of progress towards each target are not directly comparable, in that achieving some targets will have greater effects on the energy transformation than others. Therefore, this barometer (Figure 2.1) gives an indicative understanding on how the sector is progressing.
The island location of GB creates a unique challenge for the power system when compared to its continental European counterparts. This shows in the increased balancing needs to maintain system stability. The need for flexibility is disproportionally larger when compared to highly interconnected systems.
The GB power system has proven that electricity generation can change rapidly in a short time span.
The GB power system has demonstrated that carbon reduction by overhauling the generation mix is possible in a very short time. The introduction of a carbon floor price and clean air legislation has reduced the use of coal power plants by five-sixths in the last 5 years. At the same time, significant amounts of wind, solar and bioenergy have entered the power system and gas generation has seen a renaissance. Nuclear power has maintained its share of the mix in the past decade. However, based on current projections, it is likely that replacements will not outweigh closures in the coming decade. Figure 2.2 shows the generation share and total generation of all (major) generation types for the last 9 years. The analysis is conducted at GB-level as Northern Ireland is part of the power system of Ireland.
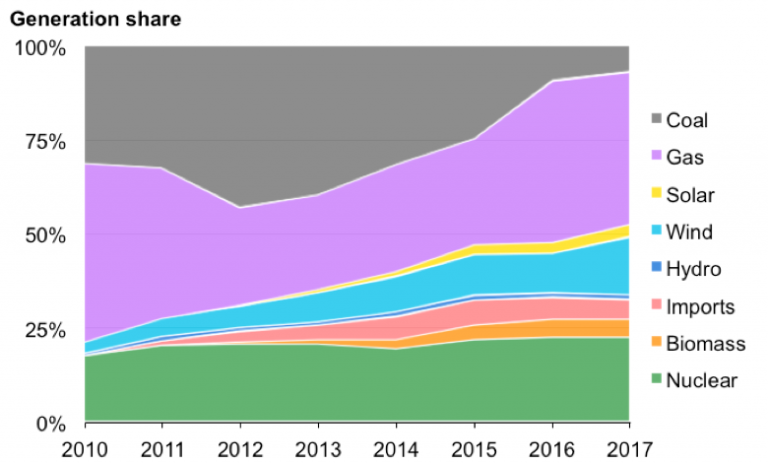
Figure 2.2: Development of the generation mix and total power generation between 2009 and 2017.
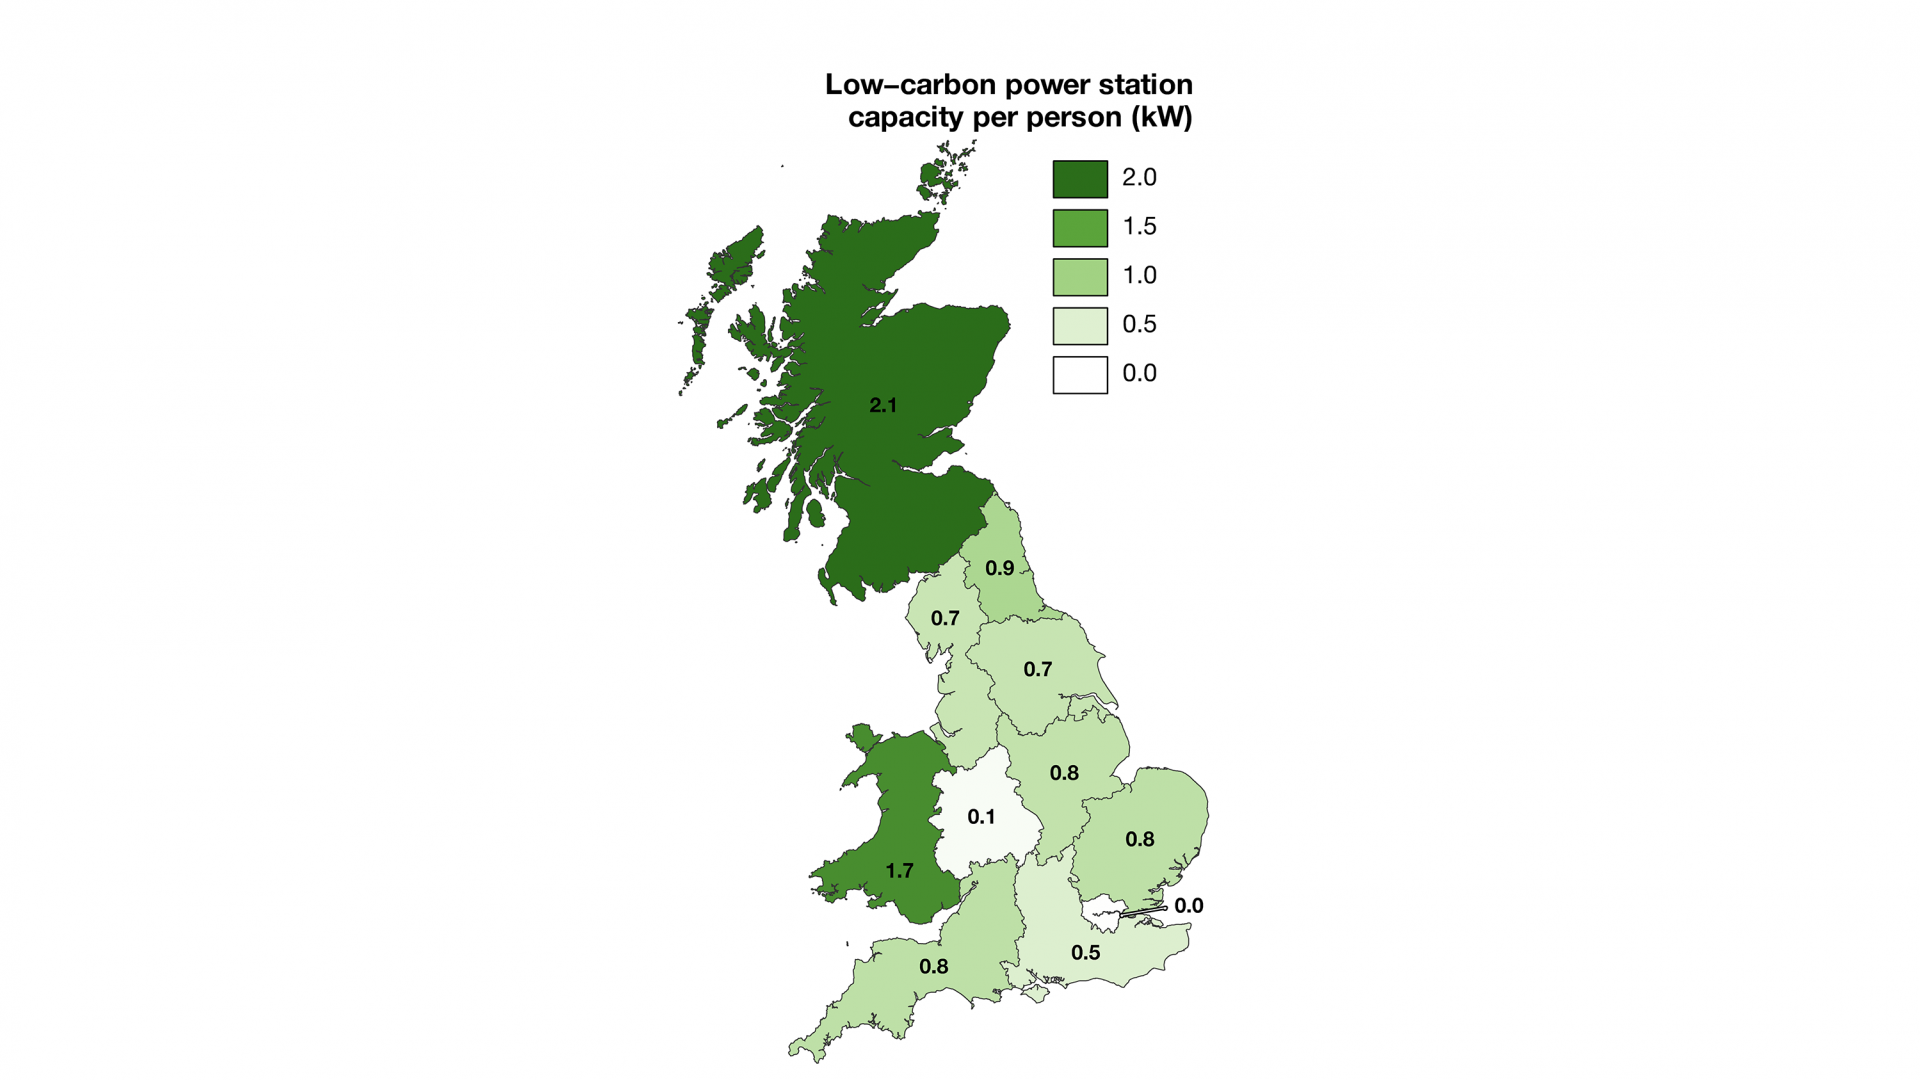
These changes have led to a redistribution of generators around Britain. The closure of coal power plants nearer to the load centres in England and Scotland on the one side has been offset by the construction of renewables in Scotland, the South West of England and Wales. The total installed capacity of renewables is highest is Scotland and Wales, with a relatively homogenous distribution of renewable capacity through England.
The West Midlands, the North East and London stand out as having little generation capacity, due to population density and resource availability. A similar picture is visible when looking at the installed capacity of renewables per capita where Scotland and Wales are leading and equal in value. Both have about twice the capacity installed as the rest of Britain, which raises a challenge for the grid to cope with the redirected flow of electricity and may require investments.
Figure 2.3 shows distribution of power stations by generator type. The last remaining coal stations are located in Yorkshire, the Midlands, the North West and Wales. These stations are due to be closed no later than 2025, apart from Drax power station in Yorkshire, where four of its six units have been converted to use biomass instead of coal. The energy system transition will alter the location of power stations and a redistribution of economic activity and employment in the country. This raises the question how to best facilitate the energy system transition, not only in terms of energy system issues but also economic development and employment. Retaining large parts of the workforce through conversion or the investment in renewables may help to ease the transition.
Additional discussion on the topic can be found in 2.2.
Transforming the energy system affects the locations of generators and so redistributes economic and employment across the regions.
Previous closures of coal stations in the West Midlands have left the region almost entirely reliant on electricity imports from other regions, due to the lack of local renewable generation capacity. Conversely, Scotland invested heavily in onshore wind before its thermal fleet were retired. This makes Scotland a substantial exporter of electricity. Wales hosts large hydro power stations (legacy renewables), masking the relatively slow progress of its energy transition.
The installed base of renewable energy sources (RES) shows a concentration of biomass generation in Yorkshire and the North East. Solar power is predominant in the South West, South East and East Anglia. Onshore wind is mostly deployed in Scotland whereas offshore wind on the other hand is more evenly allocated around the coast of Britain and closer to the load centres, mainly connected to England. Generally speaking, wind and solar follow the resource availability within a tight framework of planning permission. Due to the topography, hydropower and pumped-hydro storage can only be found in Wales and Scotland and not in the rest of the country.
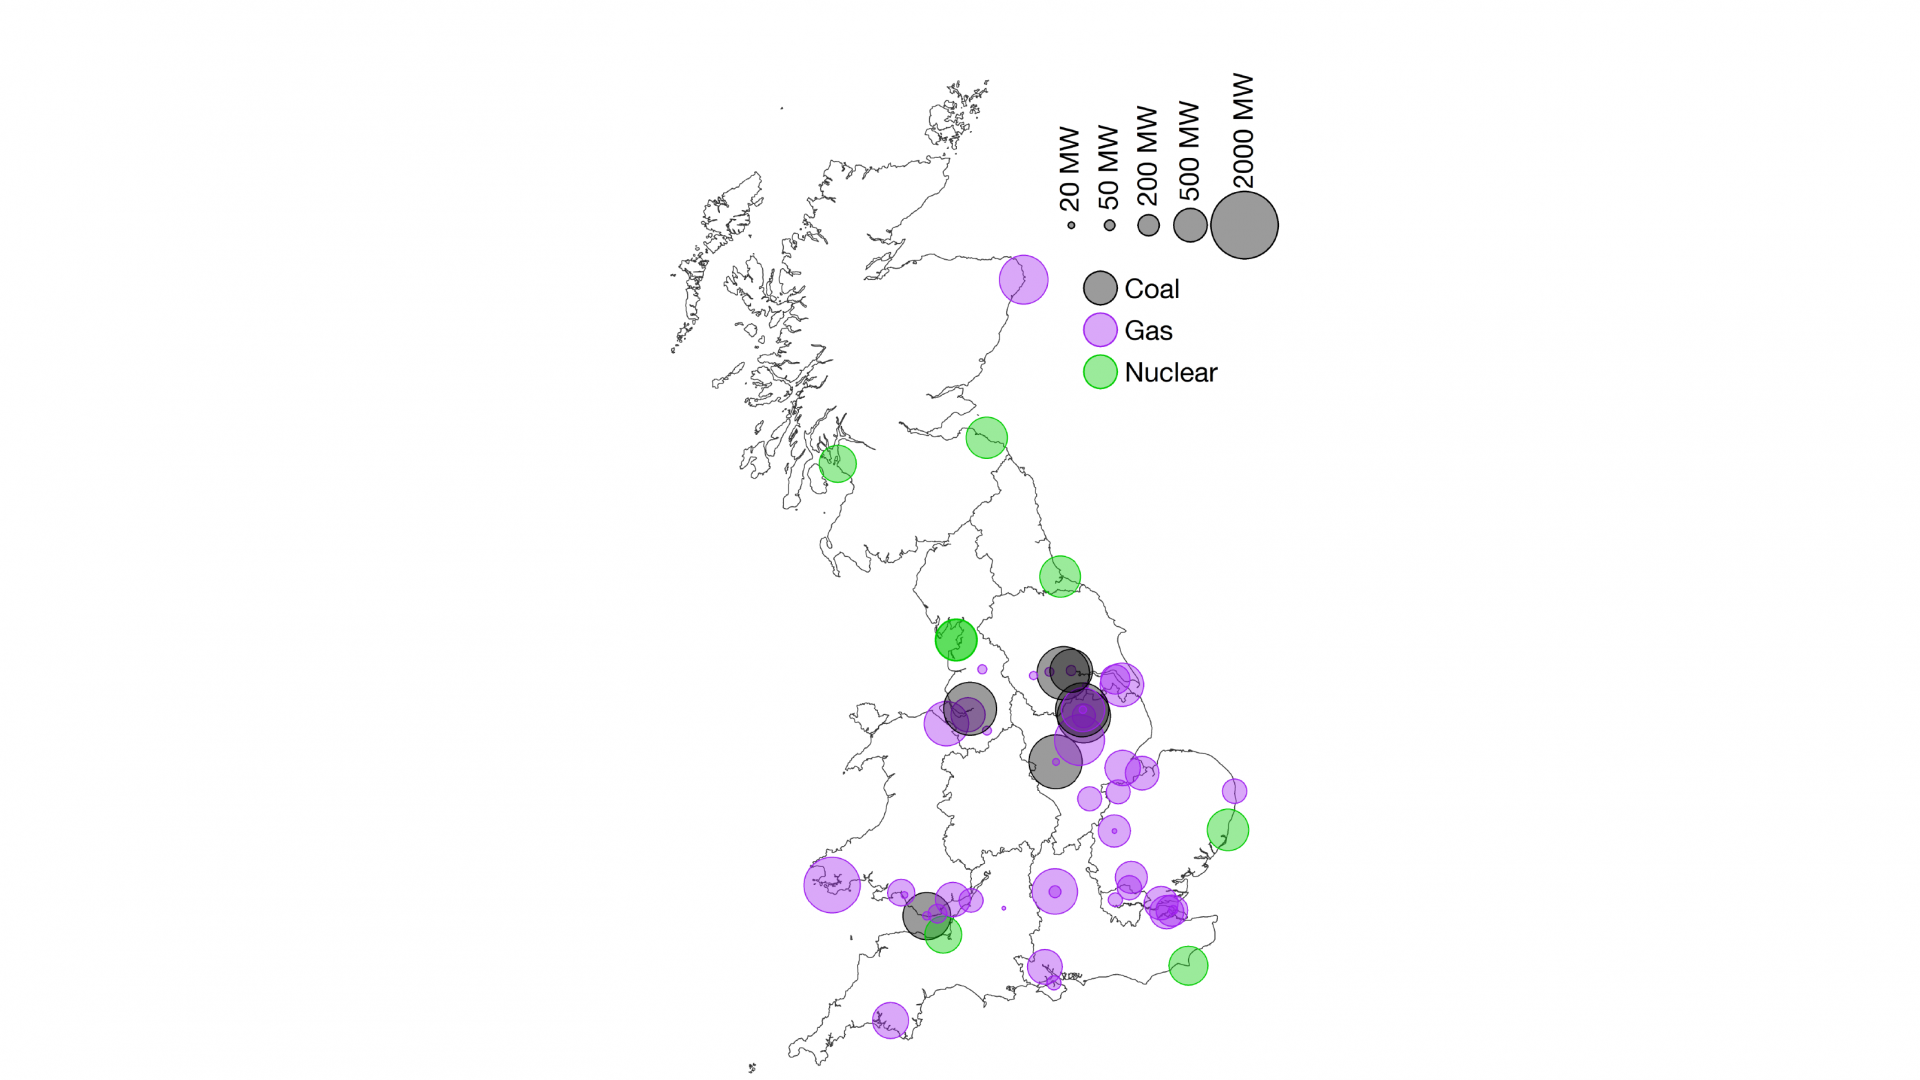 Britain's conventional power stations
 Britain's renewable power stations
Figure 2.3: Location of power generation in Great Britain. Energy to waste plants are grouped with biomass.
Non-renewable thermal generation (coal, gas and nuclear) is more concentrated than renewable generation. Gas stations are more widely distributed throughout the country and located closer to the load centres. Coal is now restricted to central
England and Wales. Nuclear power stations are all located on the coasts due to the volume of cooling water intake and security considerations.
Interestingly, the West Midlands and Greater London no longer have any large scale thermal generation. The transition from coal to gas fired power stations sees a shift away from typically slow-ramping base load power plants to more flexible (combined cycle) gas turbines, fewer operating hours for the residual generators and variable output over time.
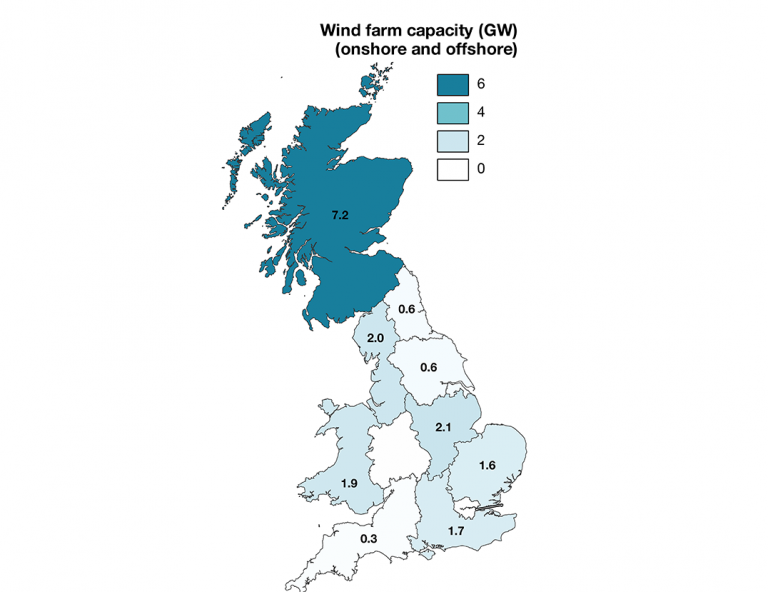
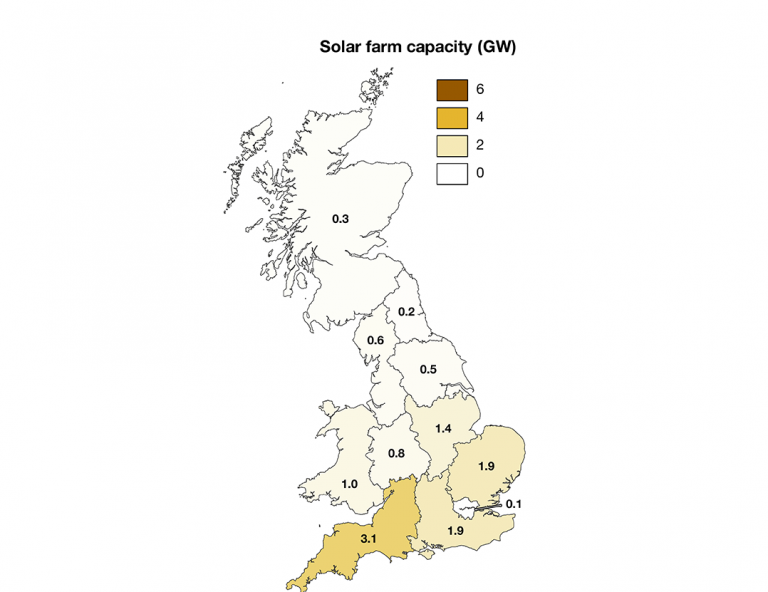
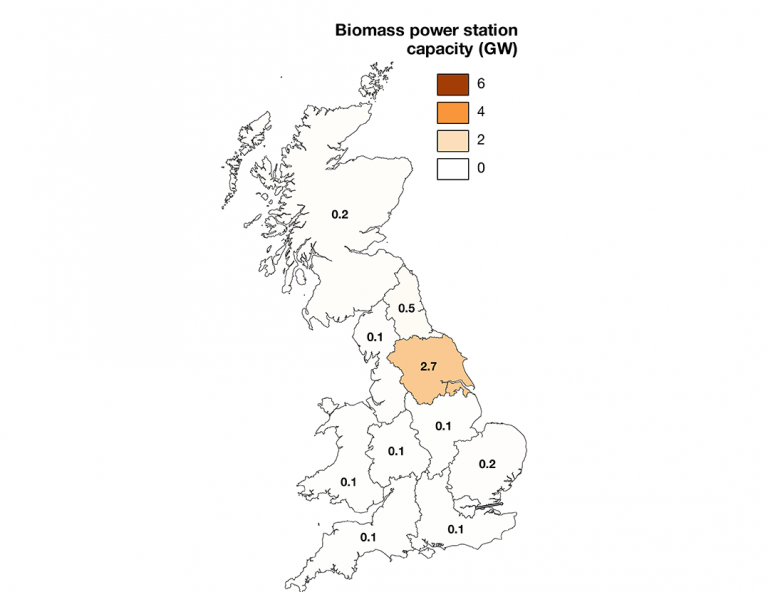
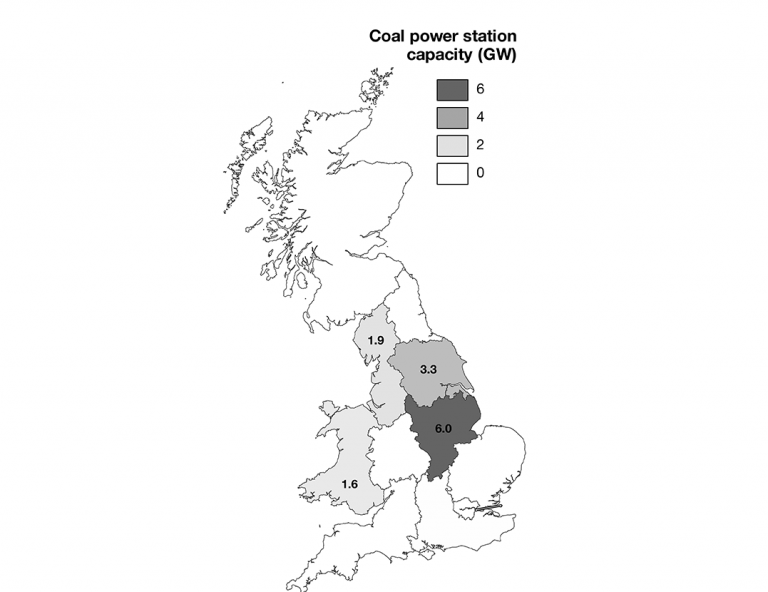
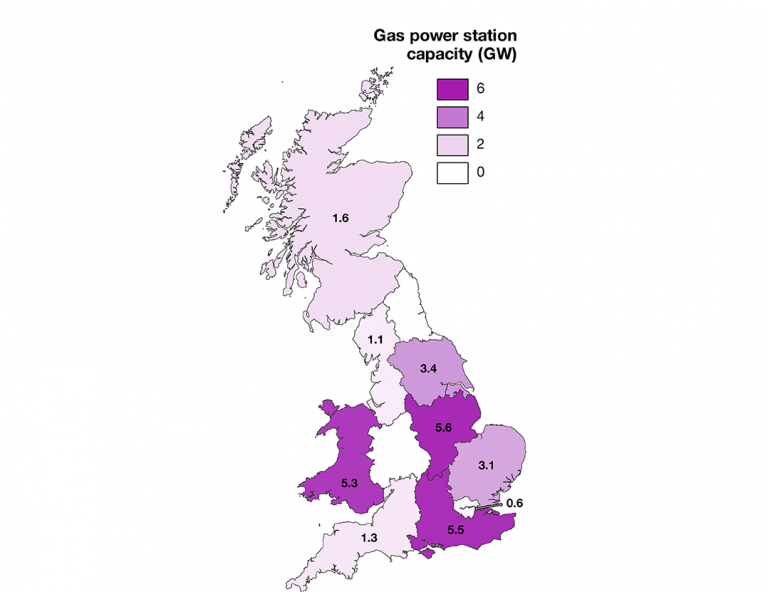
Figure 2.4: Regional distribution of power stations in Great Britain, showing renewable (three maps on the left) and conventional (three, right). Hydro plants are not shown, these are all concentrated in Wales and Scotland
2.1.1 Carbon intensity
The reduction of coal has led to a strongly decreasing carbon intensity of the produced electricity between 2009 and 2018. This is due to the lower carbon content of natural gas when compared to hard coal.
The carbon intensity of grid electricity has more than halved within five years after the introduction of the carbon floor price and emissions Directives. Further decarbonisation however will prove more challenging.
The carbon intensity of grid electricity peaked in 2012 at 508 g/kWh and has since more than halved to 237 g/kWh. This change came at a remarkable speed after the introduction of a carbon-floor price of 18 £/tCO2 transformed the economics of coal power stations and enabled their rapid phase-out.
Further increases in the CO2 price are likely to be necessary to build momentum on further decarbonisation of power generation.5 Despite this, the shift towards low carbon technologies is likely to be more challenging and not as rapid as the phaseout of coal. Further decarbonisation will require building new generators rather than simply redeploying existing ones.6 A recent uptake of the European carbon price (EU-ETS) to over €20 (£18) per tCO2 should provide a stable environment outside the country-specific carbon floor price policy instruments.
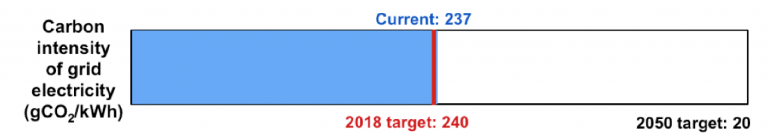
Figure 2.5: Barometer for grid electricity carbon intensity
Additional policy support is required to keep the rate of decarbonisation at the same pace. For example, the application of carbon capture, utilisation and storage (CCUS) technology to capture CO2 emissions from gas-fired and biomass power plantsb is still in its infancy. The need for decarbonisation using CCUS has seen a renewed support commitment in the Clean Growth Strategy7 by the Government as well as from private entities, albeit timings are tight to deliver at scale in 2030s for large CO2 reductions.
Despite the rapid success of decarbonisation, additional effort is necessary as further decarbonisation will be more challenging4,c. The rapid progress in the last five years makes up for the previous decade of zero progress on decarbonising electricity. Britain is therefore just about on track – but emissions must continue to fall at 7.5% per year.
There are many technologies for achieving this, wind, solar, biomass, new nuclear build, and power stations equipped with carbon capture use and storage (CCUS). To keep further decarbonisation affordable it is necessary to assess the suitability of all low carbon generators, based on their levelised cost of energy as well as the system integration cost, including those technologies that do not receive policy support at the moment.
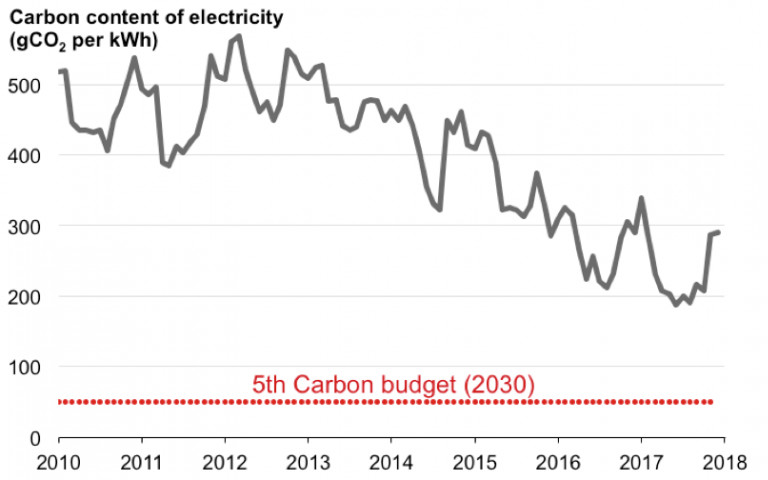
Figure 2.6: Development of carbon intensity of the electricity grid in Great Britain.

Past, present and future development of interconnectors.
2.1.2 Interconnection
Britain is an island system with limited connections to neighbouring countries, and so traditionally struggles with security of supply issues relative to continental Europe.
Virtually all of Britain’s balancing capabilities must be sourced from within the system. This has negative impacts on balancing costs, as large capital-intensive plants have to remain in standby mode.
The availability of interconnectors allows sharing of some of the balancing tasks with neighbouring energy systems. Technically speaking this means that power plants outside the British system can provide energy to the GB system and vice versa to account for outages or the intermittency of renewables. Conversely they can increase strain on the system during stress events which affect the two connected markets.
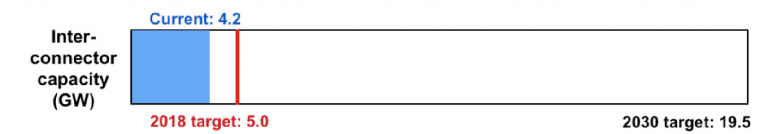
Figure 2.7: Barometer for interconnector capacity
The relatively low interconnection capacity to Britain is due to the high cost of building under-sea cables and the fact interconnectors cannot be viewed as firm capacity or provide the same system services as synchronous power stations.
The drive for better asset utilisation and renewables integration has led to the construction of interconnectors. Further expansion is under construction or in final planning stages, all of which are due to be operational by 2022. The increase from currently 4.2 GW (2018) to 17.8 GW (2022)
is more than quadrupling the capacity in a short time period. One note of caution is necessary for the projects in planning, as the UK may leave the European Single Energy Market which could change the economics of interconnector projects, potentially leading to the cancellation of the projects.
Interconnector capacity is set to more than quadruple in the near future.
If realised, these interconnectors provide a large but unreliable increase in system flexibility and allow RES balancing with continental Europe and Scandinavia. Further expansion beyond 2030 is envisaged, however these are competing interconnector projects and are not all likely be realised.
Having a wide-ranging portfolio of interconnectors to different countries may benefit the energy system, as they can be used to balance renewable energy sources across large distances and may reduce costs for consumers through the benefits of trade. An unbalanced portfolio exposes both energy systems to each other’s specific risks and does not allow for economic optimisation.
The barometer indicates that interconnection capacity is falling behind the target for 2030. However, considering the planned upgrades in the next 5 years, the development of interconnectors is within the target corridor despite the barometer’s indication. A regional barometer is not presented
as interconnection is a country-to-country issue.
2.1.3 Storage
In total 3.7 GW of storage is active in the GB power system, of which 2.9 GW is pumped hydro, 0.8 GW is batteries (primarily lithium-ion), 0.4 GW is mechanical (flywheels) and the rest is thermal storage (liquid air and hot water storage).
The stock of storage is dominated by pumped-hydro storage and new batteries added in the last year.
Batteries and other modern storage technologies are still dependent on specific market rules for economic viability. With the recent increase in RES penetration and the goal to reduce thermal ‘must-run’ capacity for the delivery of ancillary services, National Grid has encouraged demand-side response (DSR) and storage to participate in the ancillary services markets but still finds itself overwhelmingly dependent on thermal generation.
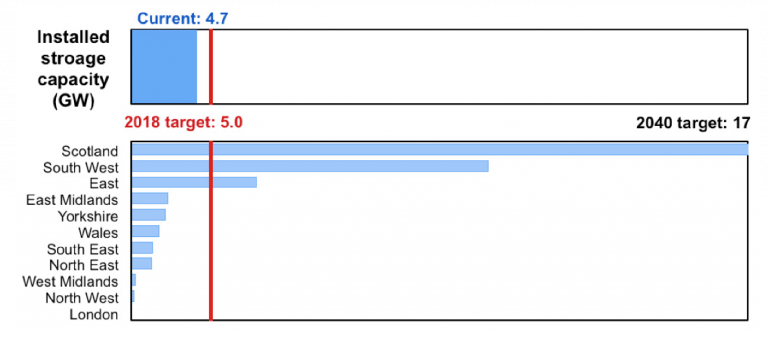
Figure 2.8: Barometer for storage deployment.
The GB power system has less storage than most neighbouring countries due to geographical constraints. Until the mid-2010s the only economical storage technology was pumped hydro which requires mountains, and thus is concentrated in Wales and Scotland. These still make up the largest share of storage capacity. The recent and rapid cost reduction in other storage technologies means that new systems are becoming more widely deployed, with small scale, rapid dispatch lithium-ion batteries contributing the largest share of the new market entrants.
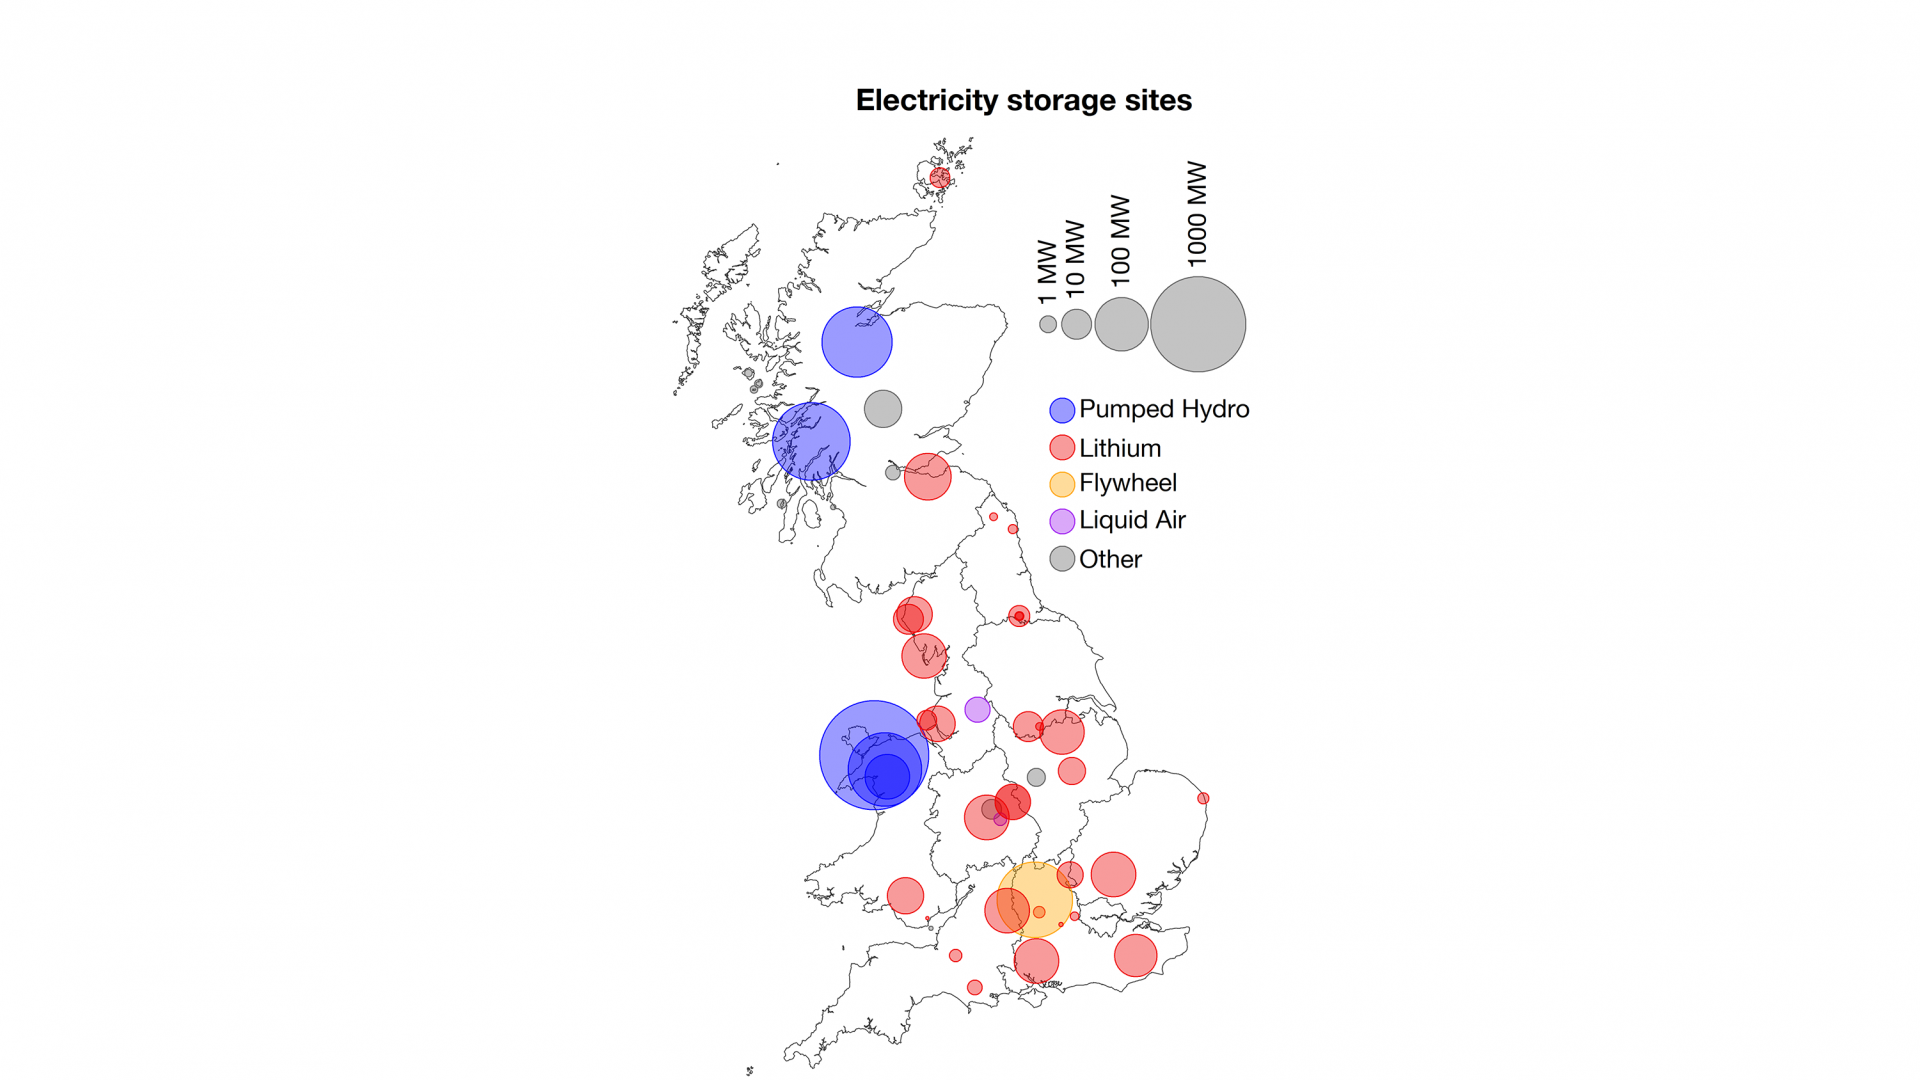
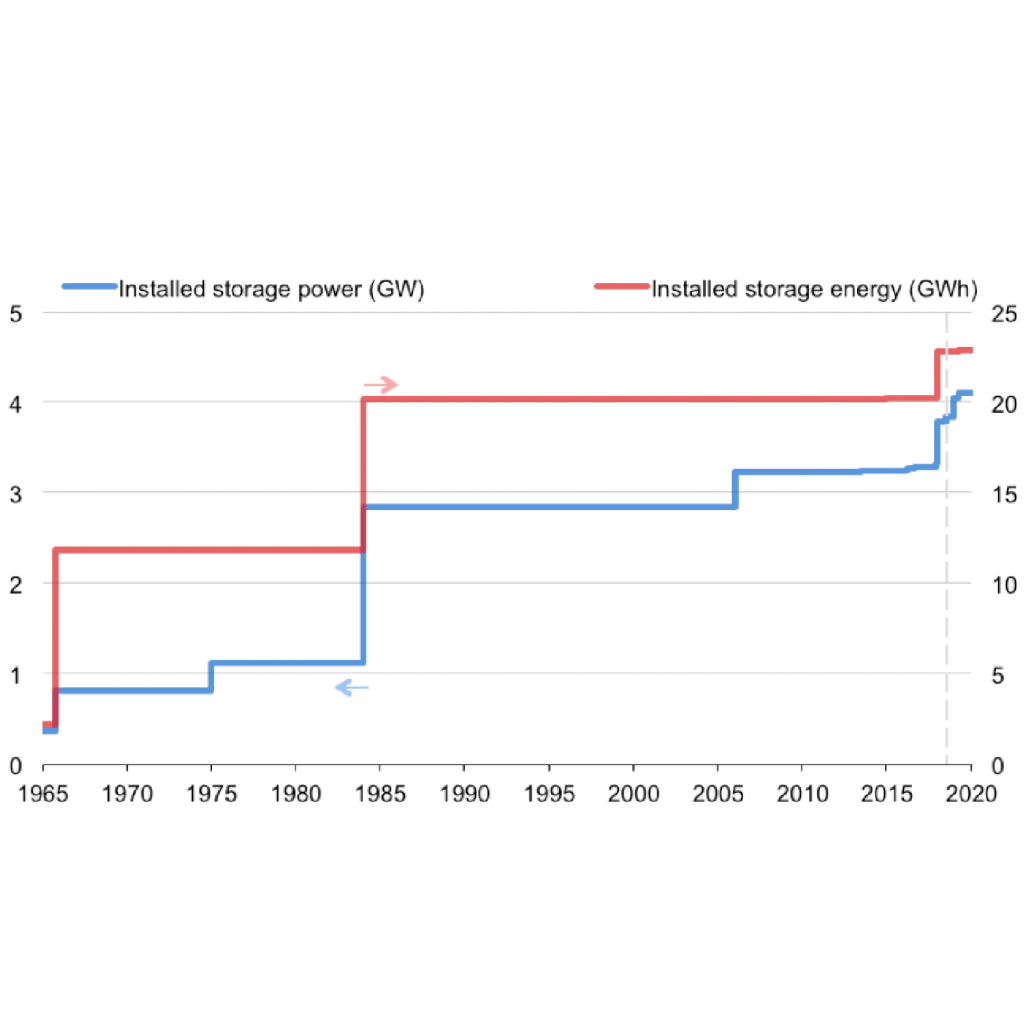
Figure 2.9: Installed storage capacity in the GB power system.
Storage has so far been applied in ancillary services markets, which are high value, but low volume markets. In particular, battery storage can be used, making it economically viable in these markets but only when generous derating factors are applied. This helps to accelerate the cost decline of grid-scale storage until eventually it can serve high-volume but lower-yield markets economically. The GB capacity market, has in some cases helped to foster the uptake of storage. However, the dependency on specific market rules creates uncertainties for long-time investments.
The barometer indicates that storage deployment is close to being on track. However, one needs to consider the reliance of storage on markets with specific rules. If these were to change, the deployment of storage might take a downturn. Additionally, a supportive environment must be maintained into the future as batteries are short-lived relative to pumped hydro (e.g. 10-20 rather than 60 plus year lifetimes) and so must be repowered at end of life.
2.1.4 Network and transmission capacity expansion
Grid expansion is necessary to transport electricity between the locations of generation and consumption. Generator locations are changing due to the shift from fossil to low-carbon generators, but this also changes the generation pattern away from a more constant use of transmission lines towards more intermittent utilisation.
Relocation of generators and the shift towards renewables requires a doubling of grid transmission capacity.
There are significant risks to the expansion of the electrical network. It may face the risk of opposition from local residents and tackling such challenges is a major societal task if we are to proceed with a low-carbon transition in the power sector.
Assessing the transport capacity at the borders of the unitary regions allows potential shortfalls in transmission capacity to be localised. Scotland is currently facing the greatest shortfall and portraying it as one unitary region might not accurately cover the full grid expansion needs. Assuming that grid congestion does not occur within the region is essentially oversimplifying the issues in some cases, as Scotland does not have limitless internal transmission capacity. Grid congestion already occurs in Scotland, especially as wind power plants are typically located in the more rural areas, some of which were already troubled by weak grid connections.
The barometer shows good progress if we assume the already well-developed grid as the current state. If this is used as a starting point the actual progress of expansion is very little. Transmission capacity at the borders of the unitary regions will have to double up until 2050. The transmission capacity within the regions is not assessed by the data sources.
Regionally the grid connection reinforcement needs differ largely. The East of England faces a five-fold increase in grid capacity which is needed for the transport of electricity from offshore wind farms to the load centres in the region. The grid in the North East will need to triple its grid transmission capacity by 2040 to cope with the increasing amount of Scottish wind power as well as the possible connection of offshore wind farms in the near future. Yorkshire will have to double its capacity for the same reasons.
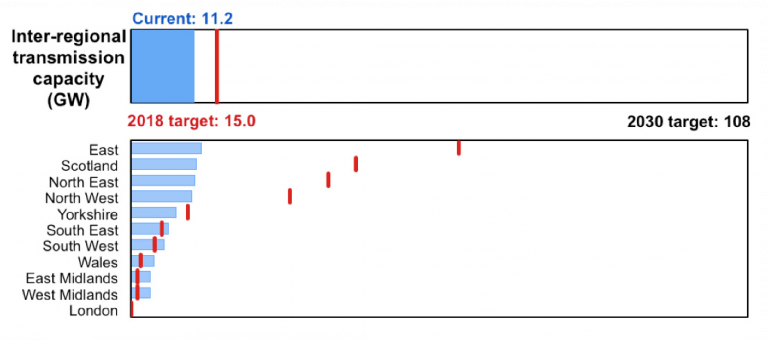
Figure 2.10: Barometer for transmission capacity.
The East Midlands has the second highest transmission capacity and therefore does not require the rapid growth of other regions further north. Large parts of today’s grid congestion in Great Britain happens in Scotland, with grid reinforcement requirements. Additionally, potential future nuclear power plants could increase the grid congestion already happening in Scotland. The siting of wind turbines at the best wind resource locations does not coincide with pre-existing location of the grid which lead to frequent grid congestion due to under-sizing of the grid.
There are significant risks to the expansion of the electrical network. For example, it may face the risk of opposition from local residents and tackling such challenges is a major societal task if we are to proceed with a low-carbon transition in the power sector.
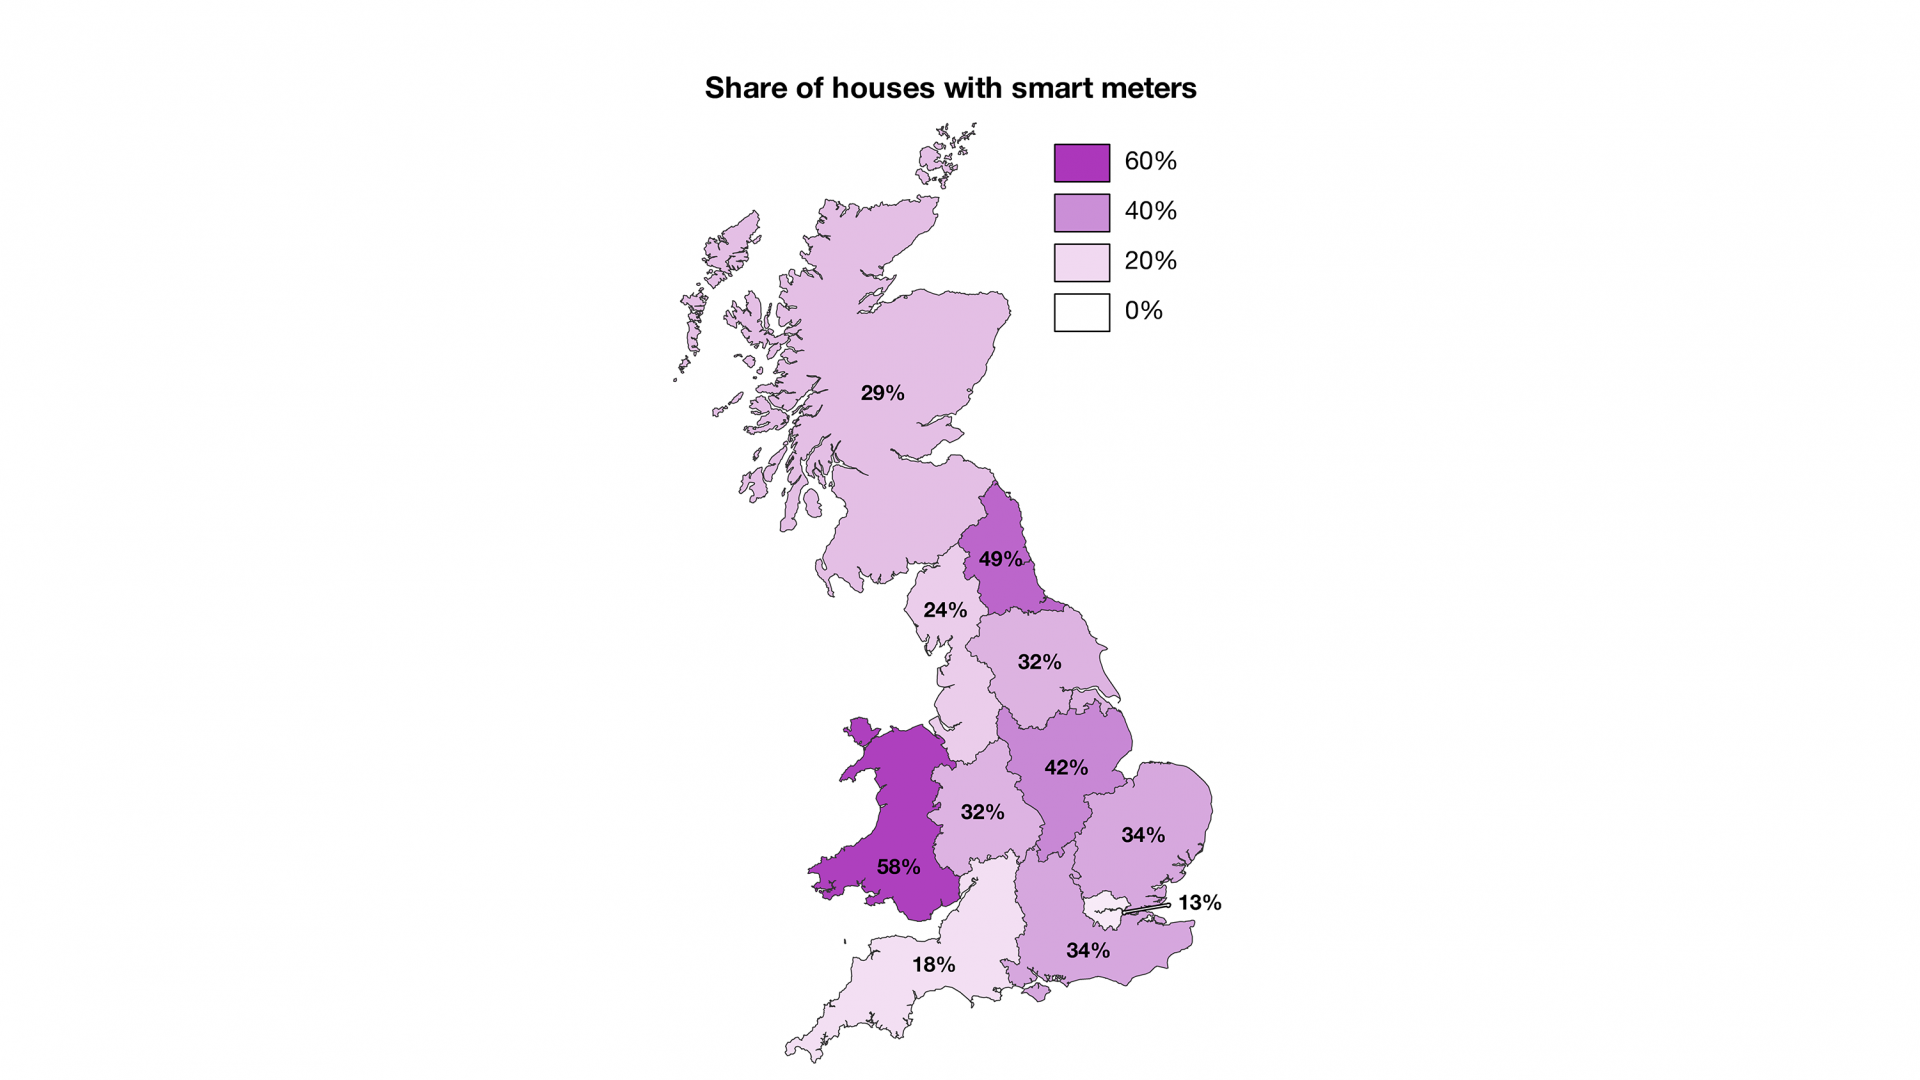
2.1.5 Smart meter roll-out
The availability of smart metering is seen as one of the key enablers of a smarter and more balanced grid through the uptake of small-scale demand side response (DSR). A country-wide roll-out of smart meters is envisaged by 2020. This target is conditional, in that every property needs to be offered a smart meter by 2020 but the owners are under no legal requirements to accept.
The smart-meter rollout faces several challenges and significant regional variation.
Varying success can be observed in the rollout, with Wales leading and London lagging.
Possible reasons for this may be socioeconomic effects (e.g. tenancy structure) and technical challenges (e.g. access to meter).
The target for a complete roll-out by 2020 will not be met without rapid acceleration. Only a third of households currently have a smart meter. The current pace would not see roll-out finishing until towards 2040. This would prevent the uptake of time of usage tariffs with higher temporal resolution (e.g 30 minute settlement periods) and domestic DSR services in the near future. This could have knock-on effects such as increased costs for the consumers.
Various challenges are faced by the roll-out. Some are related to use of different types of smart meters, with some of them “smarter” than others, boasting additional functionality between the three types of smart meter – AMR, SMETS1 and SMETS2. The Automated Meter Reading (AMR) is a legacy infrastructure for larger electricity customers. SMETS1 is the first generation smart meter with reduced functionality (e.g. not working after supplier change without intervention) SMETS2 is the latest generation, with connection to the smart meter gateway. Currently, there are only a few use-cases for smart meters and a lack of offerings from the electricity suppliers. The initial vision that smart meters will enable DSR services to the grid has yet to fully materialise at the domestic consumer level.
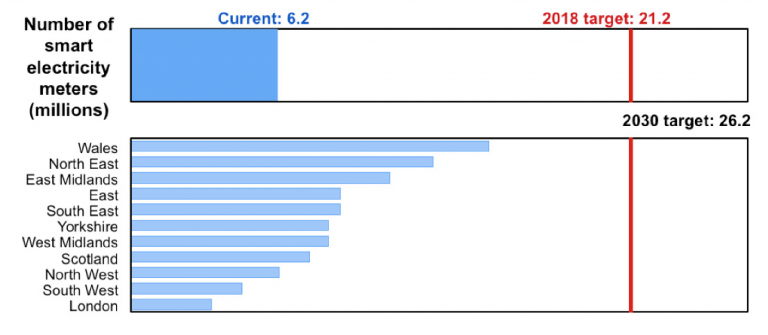
Figure 2.11: Barometer for smart meter roll-out.
Non-domestic smart meters account for about 1% of the total numbers. However, the installed capacity behind those meters is much higher and likely to be more readily available to provide DSR services.
2.1.6 Demand side response
Demand side response (DSR) could enable buildings to intelligently reduce their demand at peak times, mitigating the need for additional power generation capacity. DSR services at the domestic level are mostly limited to legacy Economy 7 (and 10). The electric loads of a typical household in Britain with gas supply for heating usually do not warrant the aggregation in DSR schemes; the loads are just too small to be economically viable.
The smart meter roll-out has yet to produce demand side response capacity from households. Industrial and corporate consumers are actively providing these services already though.
Some energy suppliers now offer ‘smart tariffs’ for households with electric vehicles and heat pumps. These first market entrants, however, do not make full use of the smart meter infrastructure. DSR activity that couples these together may at first be limited to smart charging, rather than responding in real time.
Further cost reductions in ICT infrastructure and integration of car-based and personal device communication plus aggregation means that we are likely to see domestic DSR developing. The ongoing digitalisation could see the use of artificial intelligence (AI) to predict users’ behaviour and adjust the energy consumption without a noticeable interruption for the consumer. The use of smart meters may reduce the costs for the consumers when DSR services are provided. However, this will be further down the transition pathway as currently economic benefits are negligible.

FIGURE 2.12: BAROMETER FOR DEMAND SIDE RESPONSE
On the industry and commercial side, DSR aggregators are active in the market.
The high cost of communication infrastructure still makes them reliant on the high value and low volume opportunities, such as frequency response markets. Currently about 2300 MW of DSR is reported to be participating in various markets. This constitutes an over-achievement with regards to the targets laid out by National Grid. However, there is uncertainty whether the reported capacity is correct; the same physical units can be accredited in different ancillary services markets and may be double-counted. If this is the case, it would prove that actors are optimising their participation in the market and reacting to price signal as intended.
Ultimately, the DSR potential with industrial and corporate consumers is high, but it takes a compelling business case to exploit it. As DSR must compete with other flexibility options, saturation may be reached at lower single-digit GW levels due to diminishing returns in the market and increasing effort of connecting consumers at decreasing unit sizes. For price-sensitive industrial and commercial DSR providers, this saturation will happen where the cost of connection and potential gains offset the risk of e.g. lost production in the factory. Increasing awareness of the benefits of DSR, decreasing connection costs and higher intermittency will change this equilibrium and add additional capacity to the system.
2.2 Implications of a transitioning power sector
Overall employment in the conventional energy sector has been steady at around 175,000 since the mid-1990s, after a large decline as the phase-out of coal mining cost more than 300,000 jobs. Around 80,000 jobs are directly associated with nonrenewable electricity generation in recent years.
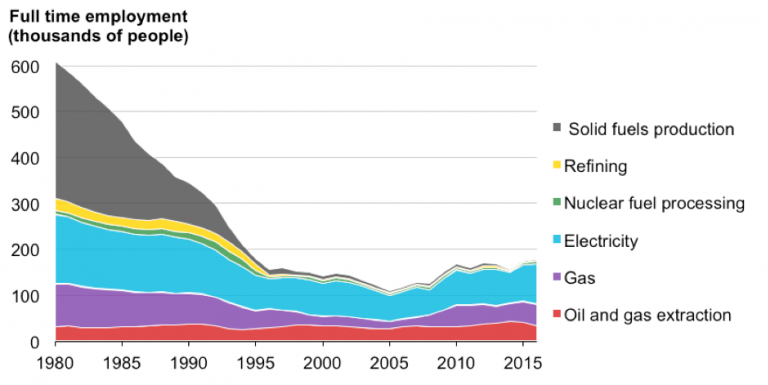
Figure 2.13: Employment in the non-renewables energy industry.
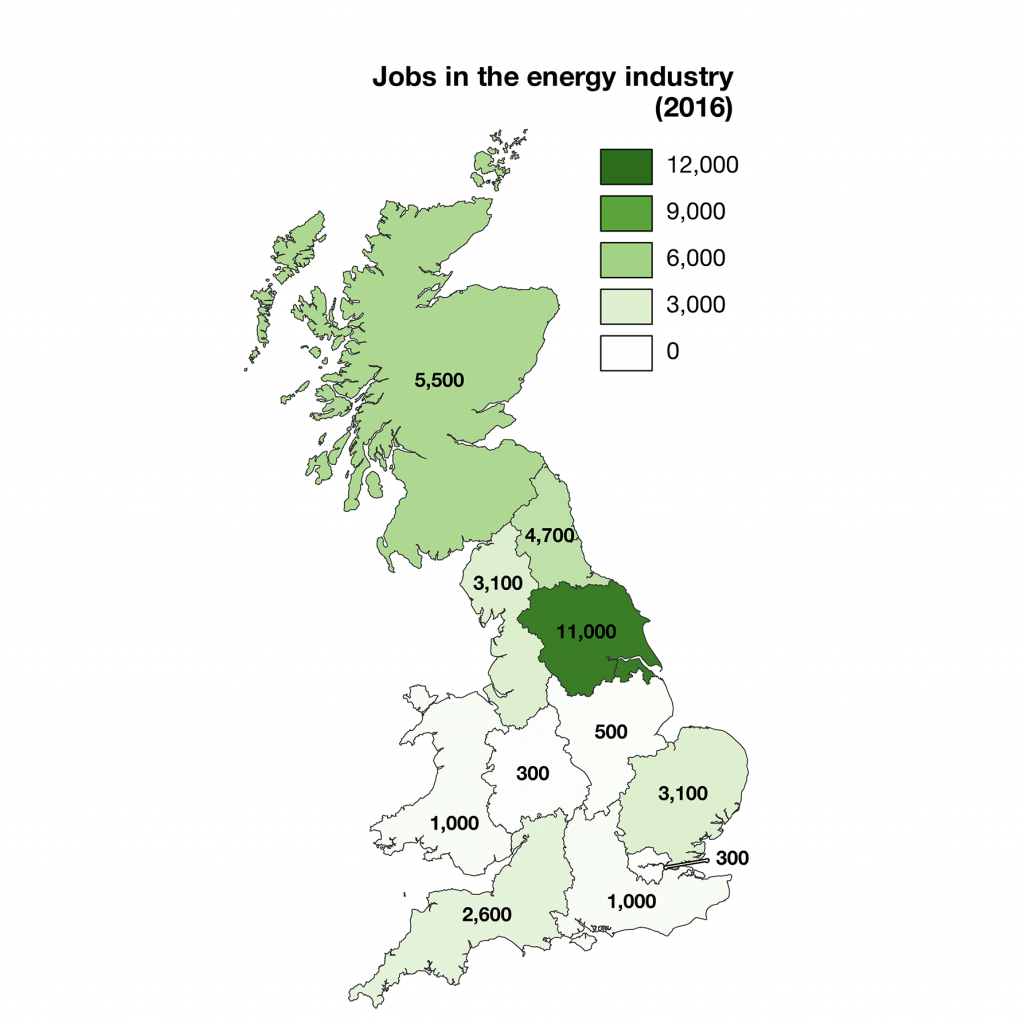
Figure 2.14: Employees in renewable electricity generation per region. Data split within England based on DECC data.
Investment in renewable energy sources creates more jobs per MWh produced than the thermal generation industry (including nuclear). An annual share of 75% of the electricity in Britain was generated by the non-renewable generators in 2017, maintaining around 80,000 jobs. The share of electricity from renewables (wind, solar, bioenergy, hydropower was about 25% in 2017. This economic activity supports about additional 34,000 jobs. The expansion of renewables therefore has a small net positive employment effect. The effect is substantially larger when hydropower is removed. Additionally, the employment growth is typically located in more rural areas, following the changes in location of electricity generation.
Figure 2.14 shows how the employment in the renewables sector is distributed across Great Britain. The employment numbers for all of England are split using investment announcements by companies. Wales and Scotland employment numbers are taken from the ONS survey directly. Most notably, Yorkshire is hosting a large number of jobs, which can be explained with the presence of Drax power station as well as with being a major hub for offshore wind power. For example, the Siemens-Gamesa blade manufacturing for large offshore wind turbines is located in Hull.
Chapter 3:
Energy in transport
The overall barometer for transport shows a mixed view. Targets for the electrification of private car and public bus transport are on-track, along with the infrastructure required for charging these vehicles. However, it will require a large ramp up in deployment of these technologies in the near future to stay on-track.
The story for the sector’s transition looks worse for hydrogen deployment, heavy duty transport and rail emissions. Deployment numbers and GHG emission reductions in these areas are behind where they need to be. Technologies that could benefit these applications are not on-track to have the infrastructure in place.
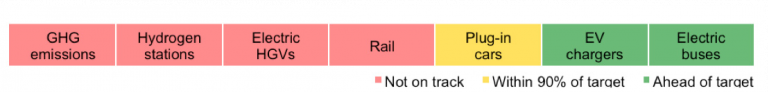
Figure 3.1: Progress towards transforming Britain’s transport system, highlighting the areas that are under- and over-performing relative to near-term targets for decarbonisation. Each area is reviewed later in this section.
Transport is behind in reaching its GHG emissions target meaning large transformations (e.g. electrification) are required to achieve the 2030 climate targets.
Electric vehicle (EV) sales are ramping up, but the current 0.4% fleet penetration will need to become 27% by 2030.
At an aggregated, national level EV charger deployment appears to be on target to deliver enough charging points for the projected EV uptake. However, there is regional and intraregional clustering of these charging points, which will result in shortages and access problems in some areas. The electricity network implications of charging infrastructure also require significant investment.
Total cost of ownership (TCO) calculations show that in London battery EVs are less expensive than diesel or petrol vehicles. The regional variation in
TCOs is linked to the average distance travelled by private vehicle per year per region and, to a lesser extent, regional variation in fuel and electricity prices.
EV owners in Wales, Scotland and the North East face the greatest additional financial burden, relative to average income, when switching to battery electric and plug-in hybrid vehicles.
Rail emissions are currently not on track to achieve decarbonisation targets, and progress will likely fall further behind as electrification projects are being abandoned.
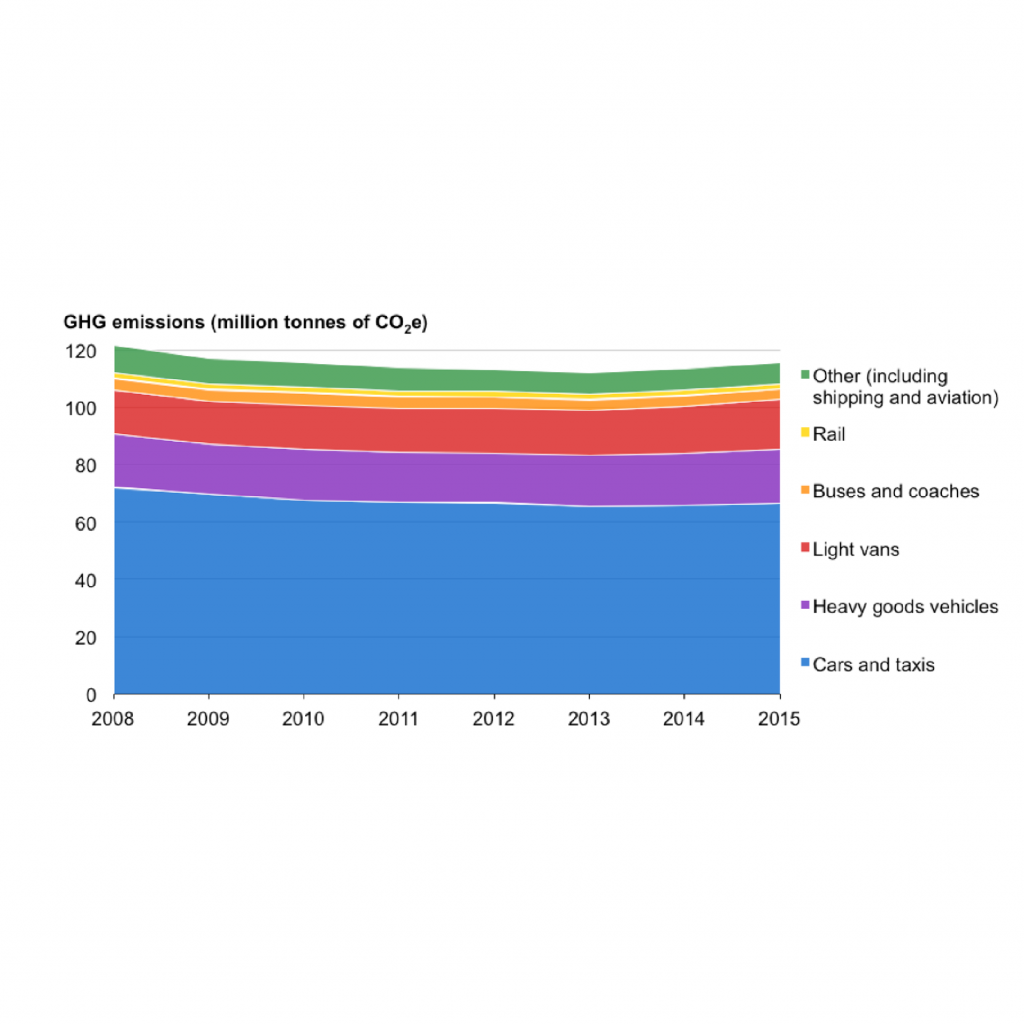
Figure 3.2: Total GHG emissions by transport mode in Britain from 2008-2015.
3.1 Current status and future targets in transport
The energy transition in the transport sector has been relatively slow and limited. In 2004, renewable energy (biofuels and electricity) made up less than 1% of all transport energy. By 2016, this figure stood at 3.5%. The transport sector generated 115 MtCO2e in 2015, accounting for 24% of total emissions (Figure 3.2). Of this, surface transport makes up 95% of these emissions. This coupled with current technological innovation suggests that surface transport has the greatest scope for an energy transformation within the transport sector. The remainder of this section will provide a detailed analysis of the current state of the surface transport sector, and how it is progressing against energy transition targets. The focus will be on road transport, as opposed to rail, as this accounts for around 90% of GHG emissions and passenger kilometres.
The future sees a transition in transport where GHG emissions are halved, EVs account for 27% of the personal vehicle fleet, electric charging and hydrogen refuelling infrastructure support the changing vehicle fleet, and rail emissions decrease by a quarter, all by 2030. Air quality concerns and national climate targets are the main drivers of this transition, resulting in a variety of low-carbon options, such as electrification and hydrogen.
Other options include biofuels and synthetic fuels, which will likely play a role in the transition, especially in the short-term, but remain outside the scope of this study. The transition up to 2030 will be mostly focussed on private-vehicles, with governments and industry already ramping up to achieve future targets. Electrification of buses, heavy good vehicles and rail will be low until 2030 but are expected to achieve large scale deployment nearer 2050.
Barometer for GHG emission reductions.
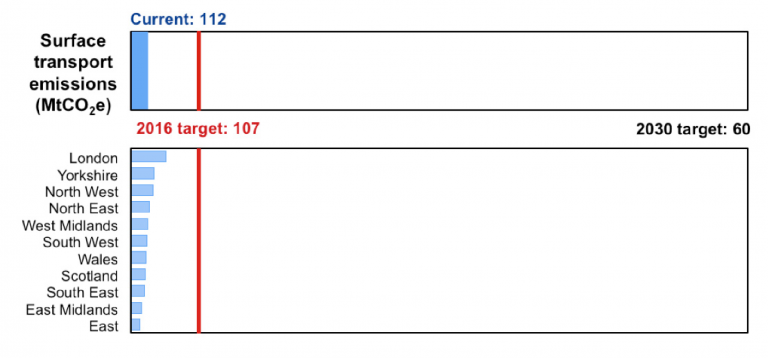
By 2030, surface transport emissions should not exceed 60 MtCO2e. As emissions currently stand at 111.8 MtCO2e, there is still a considerable amount of work required by this sector.
The surface transport system is not reducing emissions fast enough to remain on track to meet its 2030 target.
Progress against the 2030 decarbonisation targets is unequal between regions, with London and the North West decarbonising the quickest and the East and East Midlands falling the furthest behind. This indicates that the energy transition in transport is not occurring at the same rate across the country.
Compared to 2008, transport emissions have decreased by 3.7%, likely a result of the global recession and improved vehicle efficiency, as opposed to an energy transformation or fuel switching. During this same time, renewable energy in transport increased by less than 1% (2.8% in 2008 to 3.5% in 2016). Further, between 2010 and 2016, surface transport emissions increased by 1.1%. With 2016 emissions at 111.8 MtCO2e, significant decreases will be required to achieve emissions below 60 MtCO2e by 2030.
Figures 3.3 (left) and 3.4 (right).
All regions in GB have decreased their surface transport emissions relative to 2008 (Figure 3.4). However, compared to 2010, the story changes, with only four regions decreasing or maintaining their emissions (Figure 3.3). This shows the relative importance the recession has played on reducing surface transport emissions in GB since 2008. London, compared to both 2008 and 2010, shows the greatest decrease in emissions likely related to efficiency gains in public transport, increases in active travel and decreases in road kilometres driven.
Using decarbonisation as a proxy, the regions of GB are undergoing energy transitions at unequal rates. London has decarbonised at the fastest rate, and along with the North West has exceeded the required emissions reductions to be on track to achieve the 2030 emissions target. In contrast, the East and the East Midlands are the furthest behind. These regional inequalities could further be amplified if regions continue progressing at these speeds, suggesting that some regions will be significantly further behind in the transport energy transition.
3.1.2 Plug-in vehicles in the car fleet
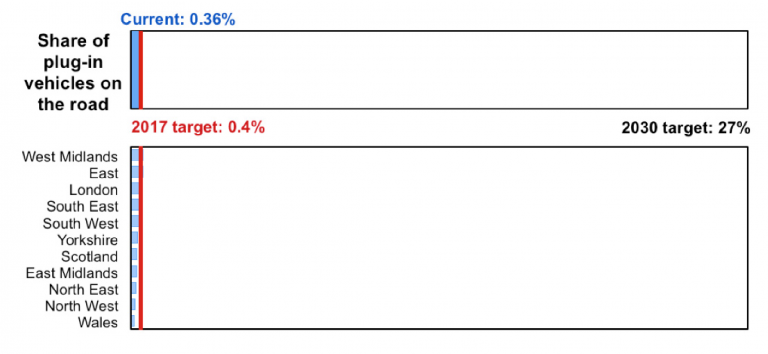
Plug-in vehicles are still in their infancy, representing only 1 in 50 new car sales, and 1 in 250 vehicles on the road. However, Britain is on-track to achieve plug-in vehicle targets, which require a 27% share of the private vehicle fleet by 2030.
Barometer for plug-in vehicle penetration
Electric vehicle sales have dramatically increased since 2011 in all GB regions.
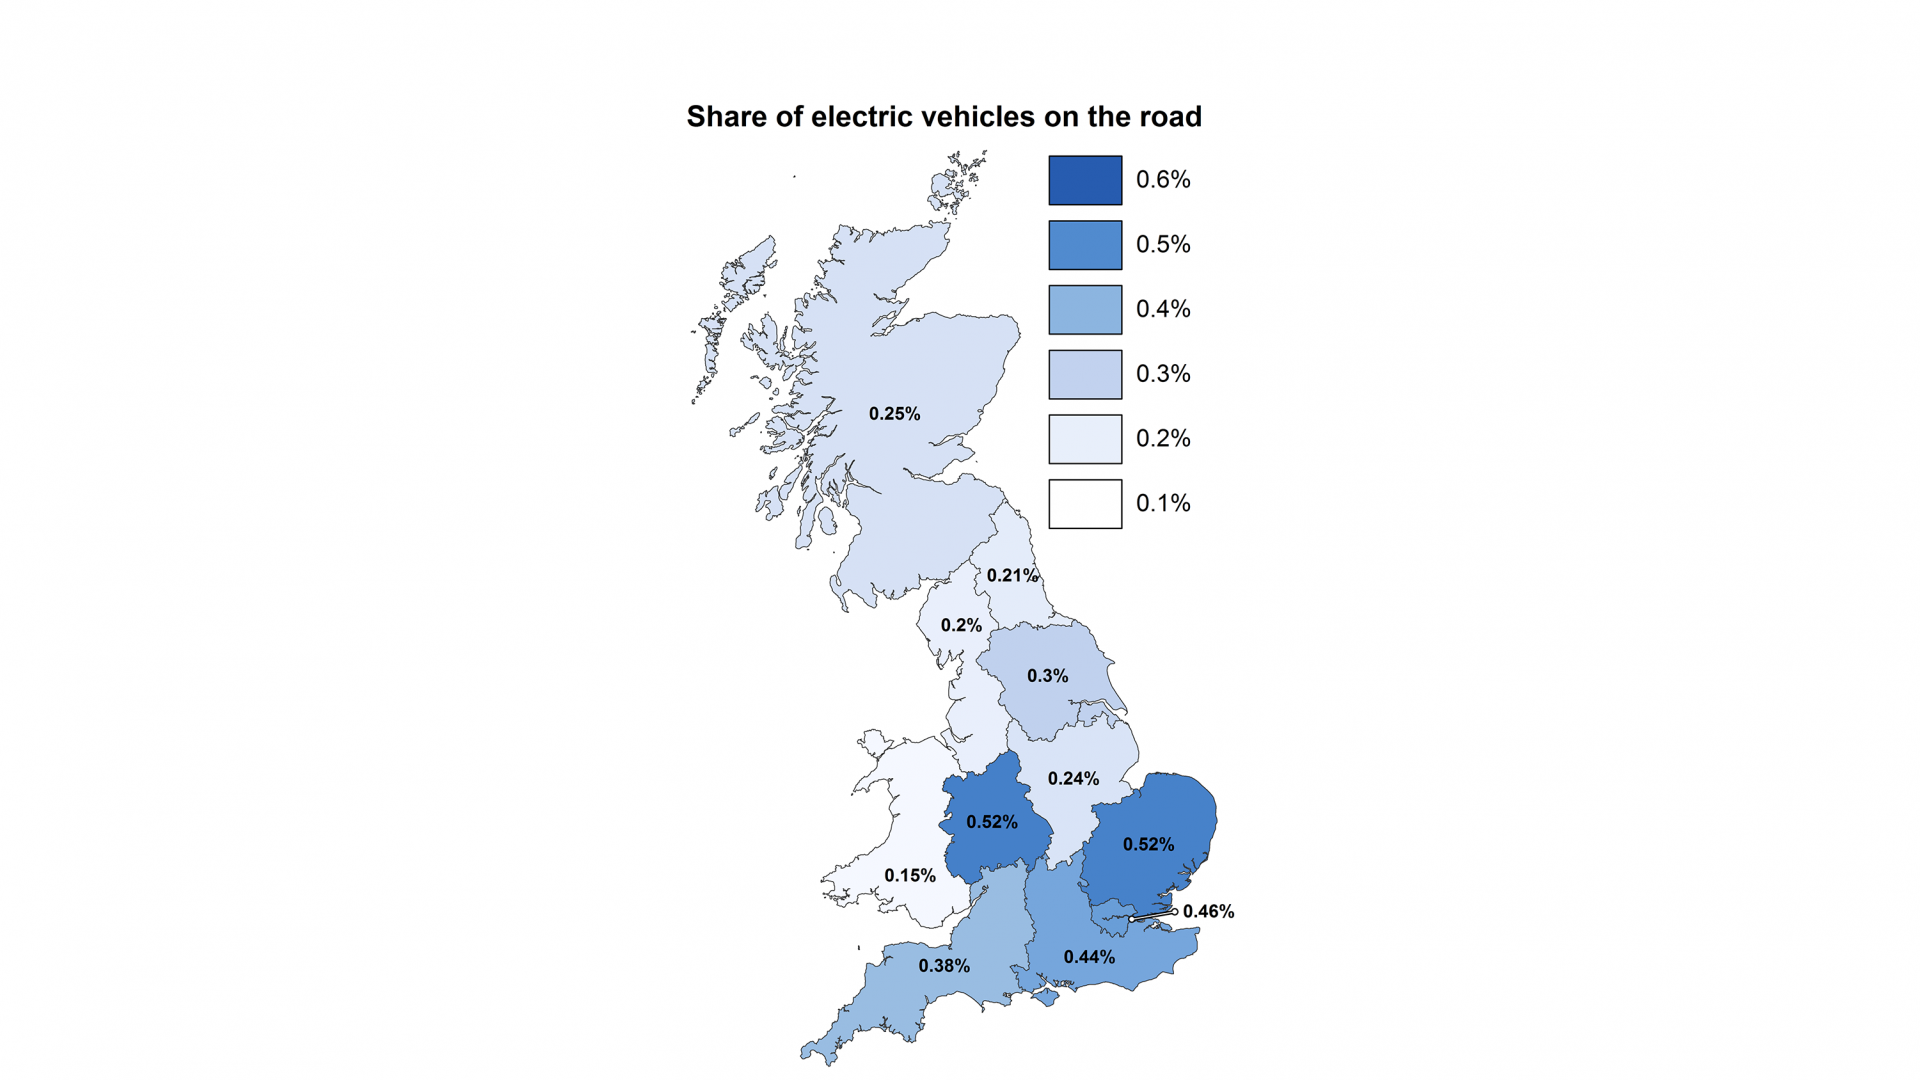
Plug-in vehicles are most abundant on the roads of the southern half of Britain. They are more than three-times more prevalent in the West Midlands as in Wales. This suggests other barriers are present in the northern regions that is impeding the growth of plug-in vehicles.
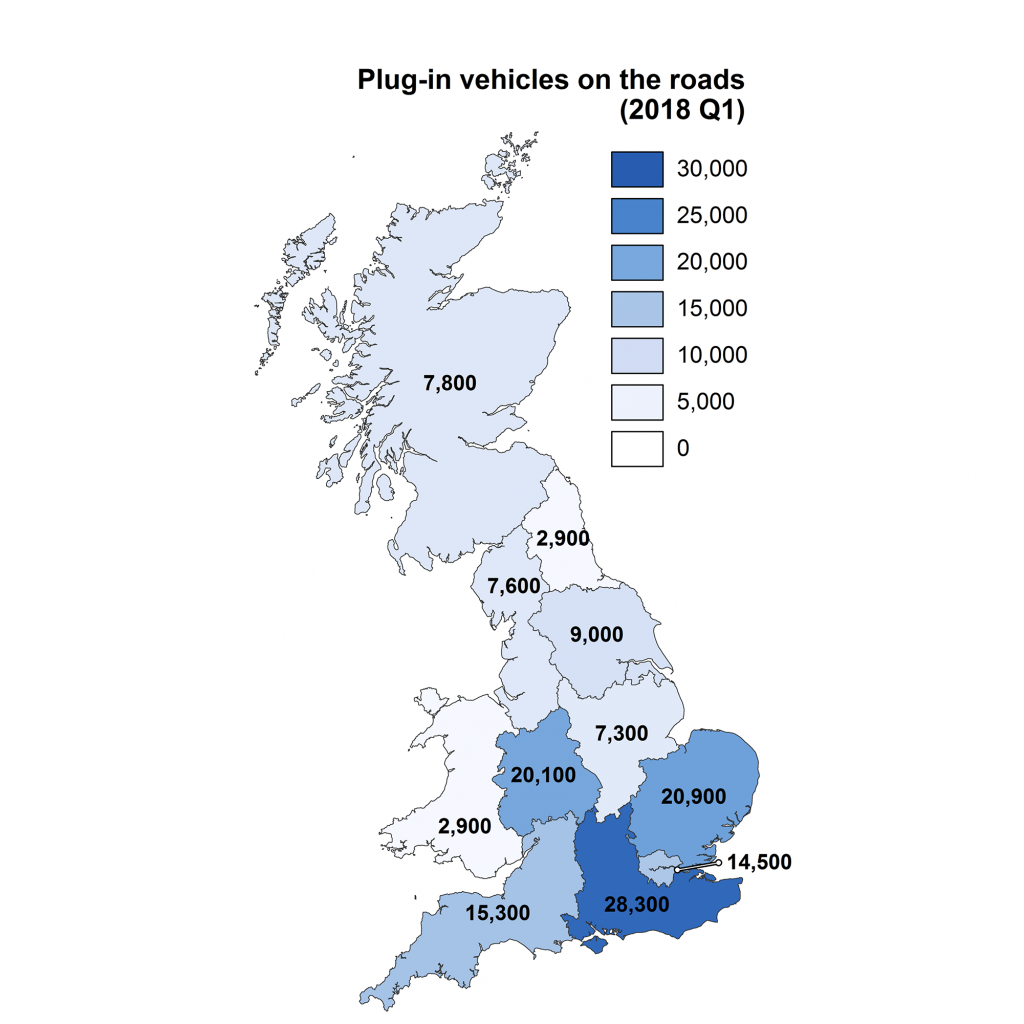
Plug-in vehicle growth has had a 60-fold increased since 20117, resulting in their increased share of newly sold vehicles, from 0% in 2008 up to 2% by 2018 (Figure 3.6). This growth is likely a direct result of EVs becoming cheaper, and a greater range of vehicles available on the market. All regions of GB have significantly increased the number of plug-in vehicles on the road since 2011 – with the Yorkshire and the Humber having 200 times more vehicles in 2018 (Figure 3.6).
Plug-in vehicles are most abundant in the southern regions of GB. This suggests regional factors – e.g. income, availability of chargers, driving patterns – are affecting the expansion of plug-in vehicles.
Despite recent growth, plug-in vehicle penetration is less than 1 in 200 vehicles currently on the road. This suggests that growth will need to continue along this seemingly exponential trend to ensure that the plug-in vehicles account for 27% of all personal vehicles by 2030.
Regionally, the West Midlands, the East, South East and London are leading, with plug-in vehicle penetration above the 2017 target of 0.4%. However, many regions, such as Wales and the North West, are at risk of being left behind in the plug-in vehicle transition, achieving less than 0.2% of plug-in vehicle penetration. This regional disparity could potentially be masked in the future, if the national target is achieved through the efforts of only a few key regions.

Figure 3.6: (chart) Proportion of new car sales that are electric; (map) Number of registered plug-in vehicles by region.
3.1.3 EV charging points
There are currently over 17,000 chargers in Great Britain, of which 3,600 are rapid. By 2030, there should be over 28,000 chargers.
EV charger deployment is well ahead of schedule to meet the 2030 target, but the deployment is highly clustered in cities.
While all regions have deployed more chargers than required to achieve the indicative 2018 target, over 50% are located in London, Scotland and the South East. Scotland and London have already deployed more chargers than required by the 2030 target.
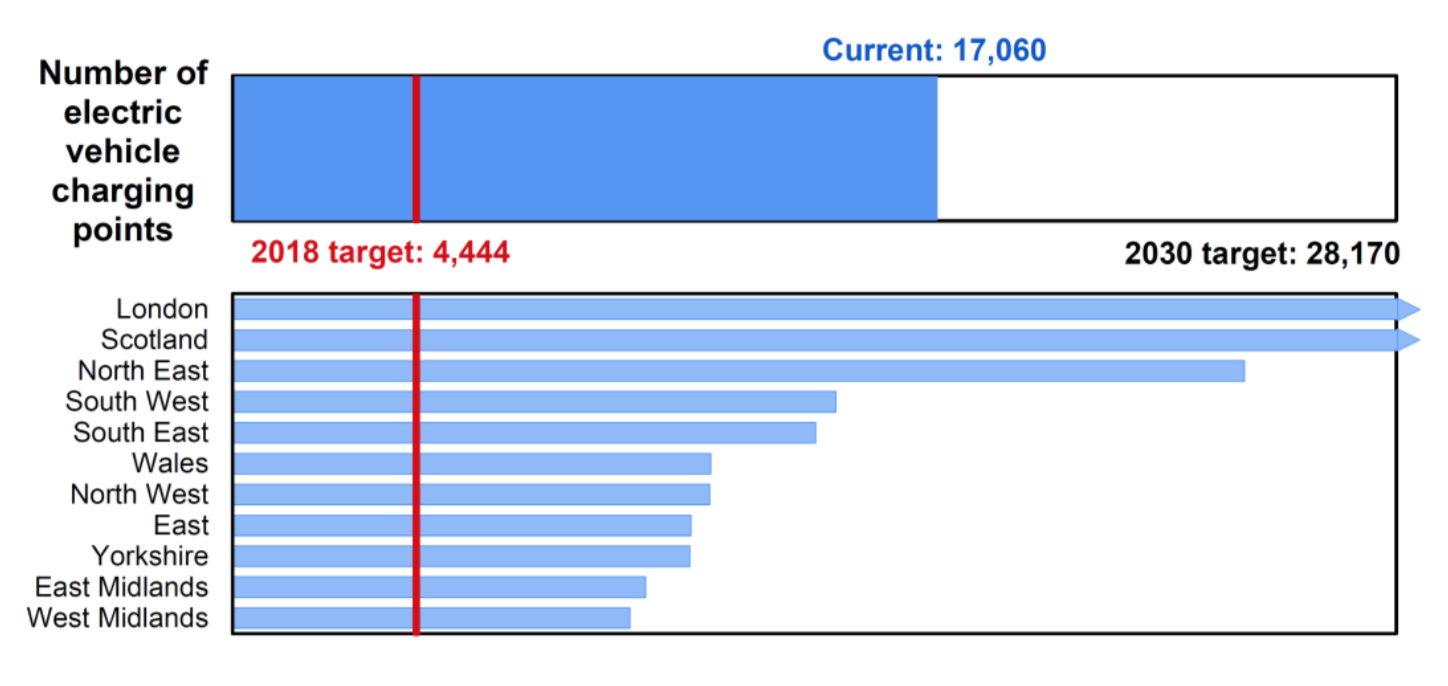
Electric charger deployment is on track to achieve its 2030 target ahead of time, having already achieved the interim target for 2020 (6,250 chargers). There are currently more rapid chargers in the GB than the target suggests there should be by 2030 to support a growing EV industry (1,170 in 2030 versus 3,600 in August 2018). Further, in August 2018, 2/3 of the parking-based chargers required by 2030 were already installed in Britain. However, these EV chargers are not evenly distributed amongst the British regions, with over 50% located in London, Scotland and the South East.
This is not particularly surprising for London and the South East, as they currently have a large share of the electric vehicles currently on the road. Scotland, on the other hand, is one of the lower ranking regions in terms of number of EVs on the road. The high number of electric chargers could suggest a strong projected growth in battery electric vehicles in the region. This could in part be related to the environmental commitments set by the devolved power.
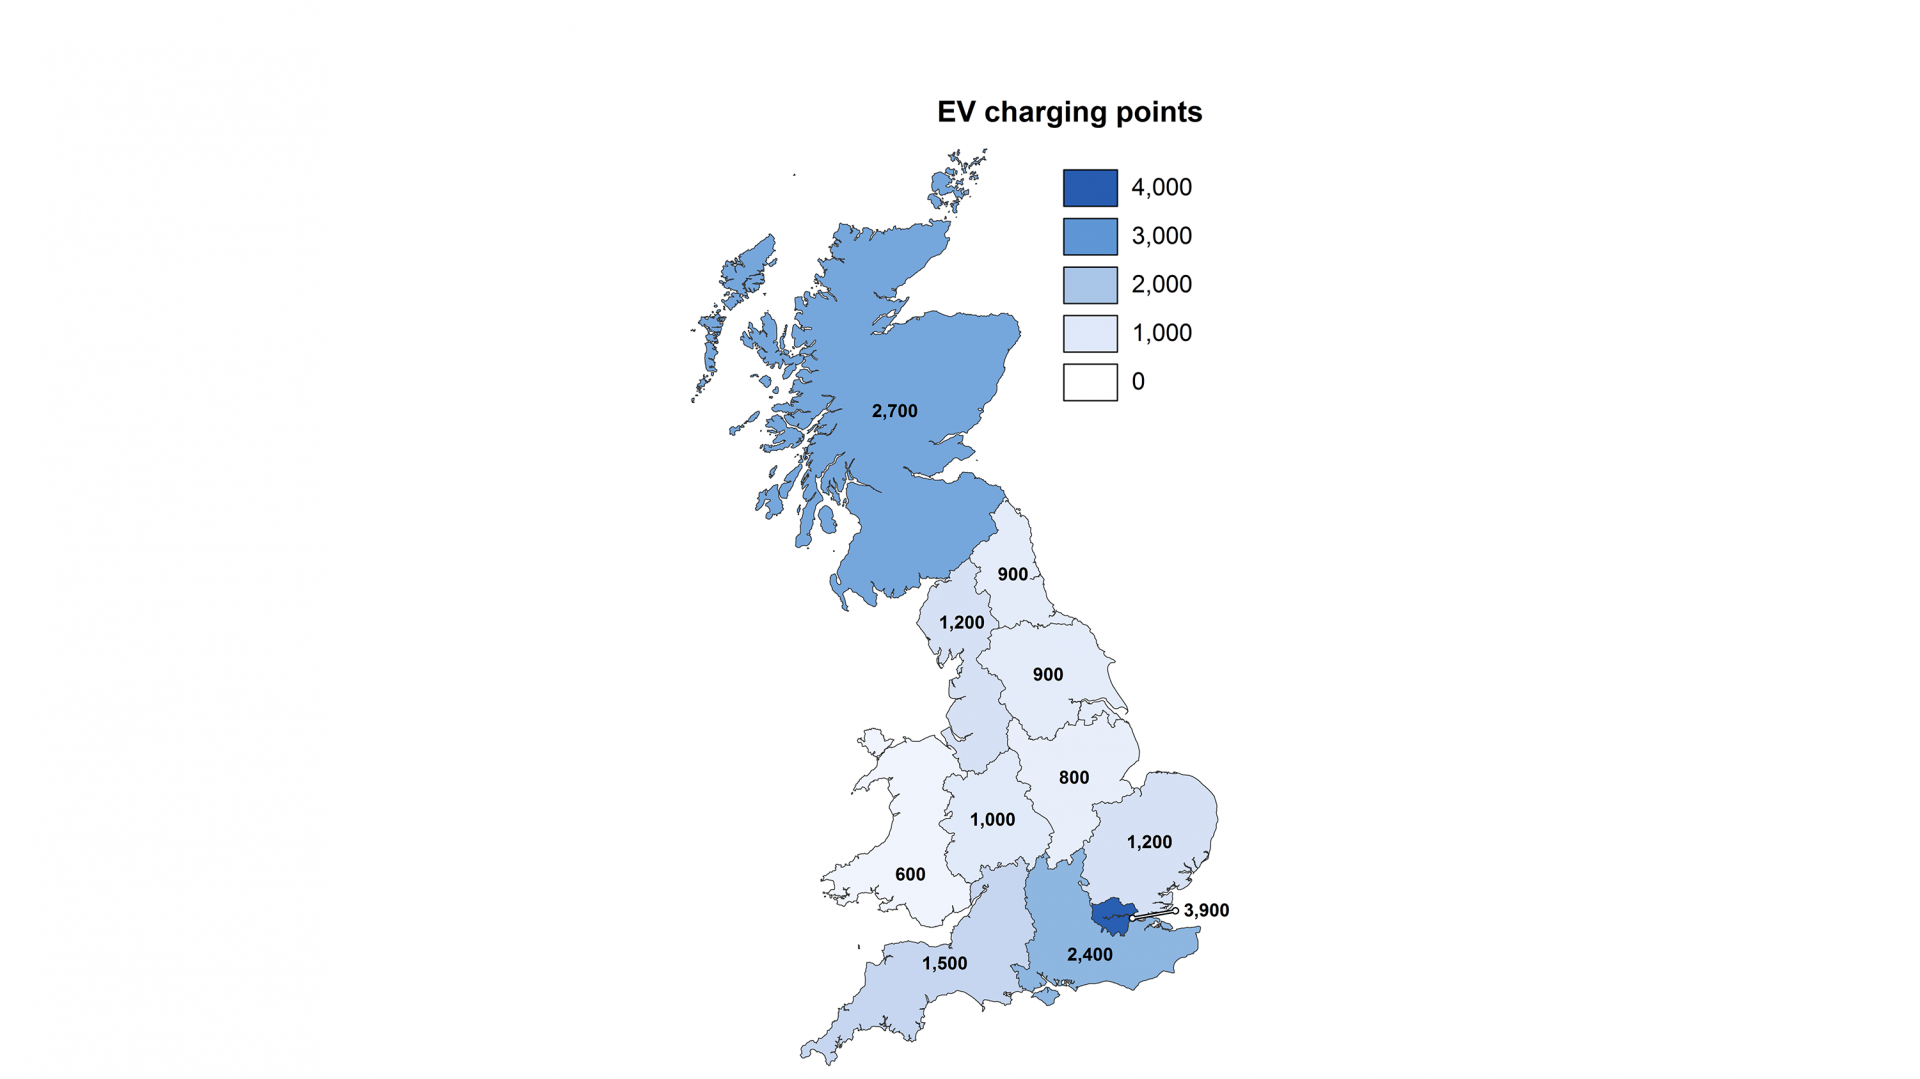
Figure 3.7: map of the number of electric charging locations.
3.1.4 Hydrogen refuelling stations
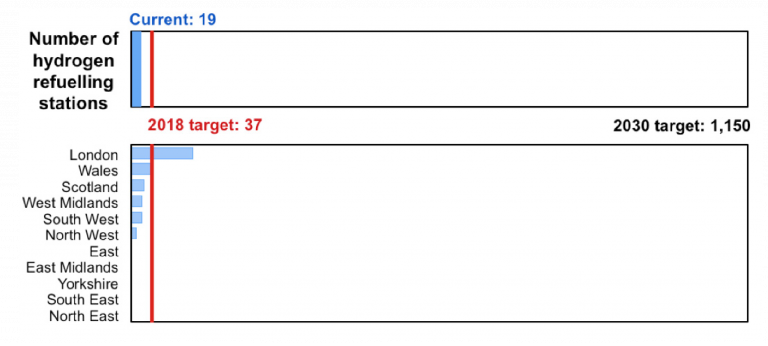
Hydrogen refuelling station deployment is not occurring quickly enough, jeopardising the achievement of the 2030 target, needed to support a hydrogen transport network.
65 hydrogen refuelling stations are required to support an initial hydrogen network in GB. There are currently 19, with over half located in London.
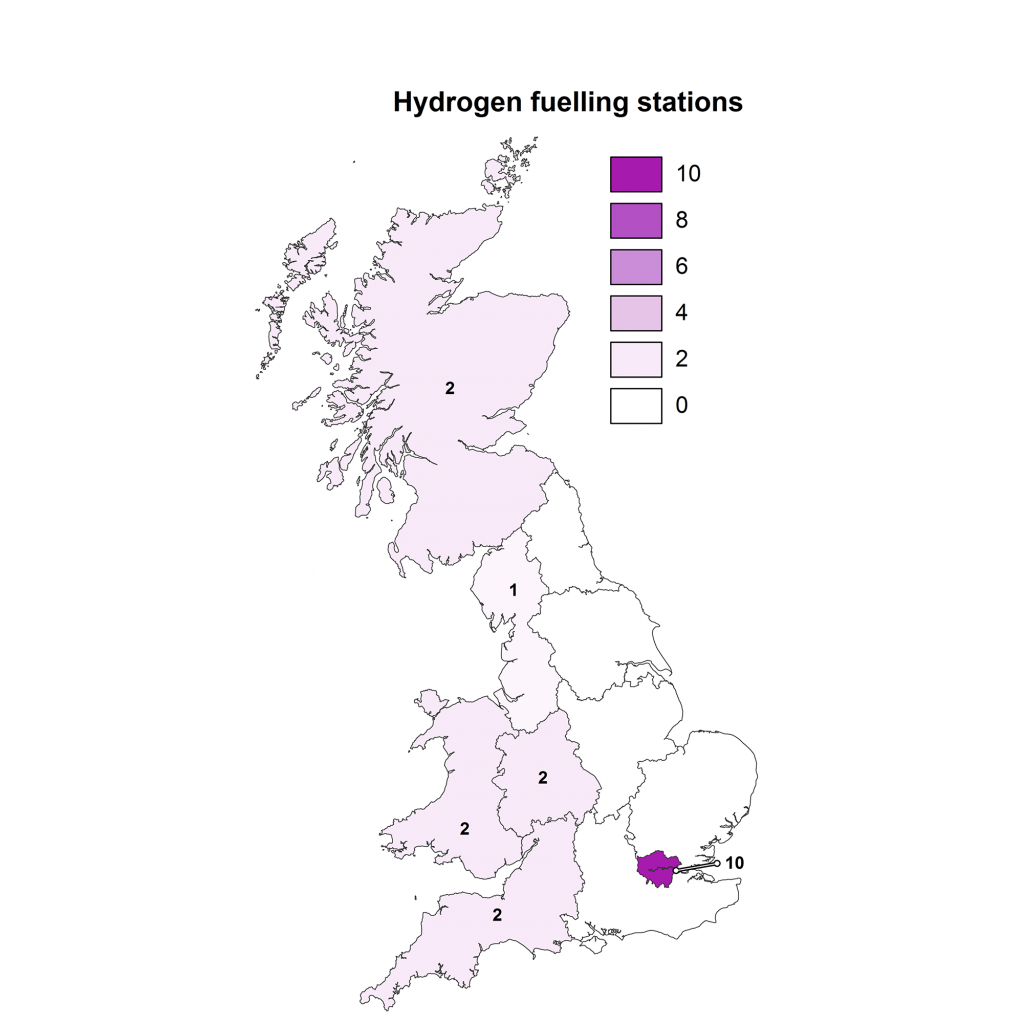
Figure 3.8: map of regional current status.
Apart from London, hydrogen refuelling stations are predominantly located on the western side of Britain and tend to be relatively clustered.
The government-industry UK H2 Mobility initiative set a target for the number of hydrogen refuelling stations required to support a national hydrogen vehicle fleet.
By 2030, 1,150 would be required, with intermediate targets of 65 filling stations for 2020 and 330 by 2025. Currently, there are only 19 hydrogen refuelling stations, jeopardising the feasibility of achieving the 2030 target, unless considerably more effort is put towards their deployment.
As with electric chargers, though to a more extreme degree, the distribution of hydrogen stations is strongly clustered – currently, over 50% of refuelling stations are in London. A further eight stations are located in western Great Britain, and one on the Scottish East coast. Further, the national target for stations was apportioned to each region based on the current number of registered vehicles. London and Wales are the only regions that are on track to achieve the 2030 target. Conversely, the eastern side of England (excluding London) does not have any refuelling stations, threatening their ability to achieve the 2030 target.
Barometer for hydrogen refuelling stations.
The location of these stations limits the operation of hydrogen-fuelled vehicles, and further limits the benefits (e.g. improved air quality) of this energy transition to a few clustered areas. Due to their long distance and high energy requirements, heavy goods vehicles (HGVs) would benefit most from a well-developed hydrogen network. However, the limited deployment and clustering of stations are restricting its use in HGVs.
3.1.5 Electric and hydrogen bus penetration
The transition to electric and hydrogen buses in on track to achieve the 2030 target. Despite making up a low share of the bus fleet, electric buses are replacing, in part, diesel buses coming to the end of their lifetime.
Early battery and hydrogen electric bus fleet penetration is on track even with overall growth of the bus fleet.
Commitments to improving air quality by cities is resulting in an increased share of electric and hydrogen buses in the overall fleet.
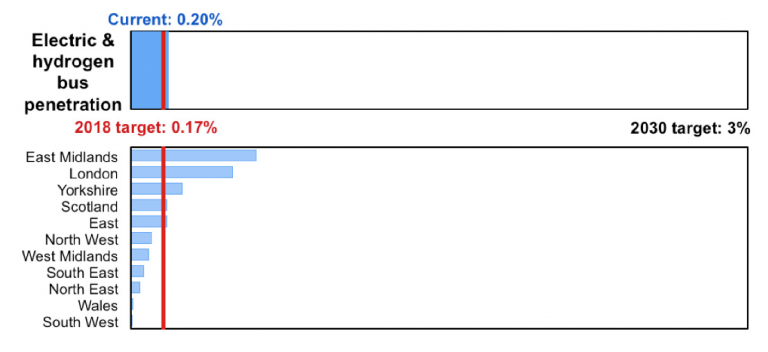
Barometer for battery electric and hydrogen buses.
By 2030, battery electric and hydrogen buses should account for 3% of bus fleet, which, compared to the plug-in vehicle target, is relatively small. This is related to the longer asset lifetime of the current bus fleet compared to private vehicles, and therefore a complete change in the fleet requires more time. While electrification transition may be slow, the progress is encouraging. The absolute number of battery electric and hydrogen buses is increasing at the same rate as its penetration rate of the entire fleet (Figure 3.10). This suggests that the increased proportion is due to replacing the existing (diesel) fleet with electric/hydrogen buses, rather than from any decrease in the absolute number of buses.
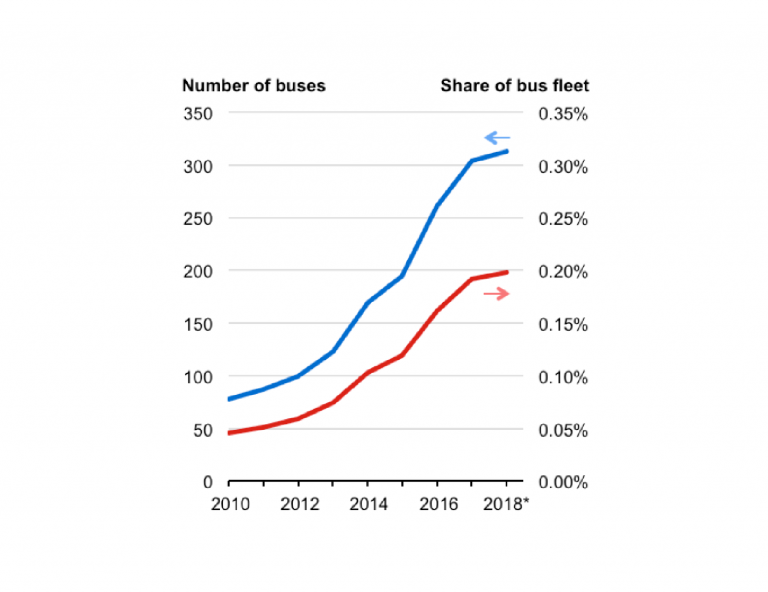
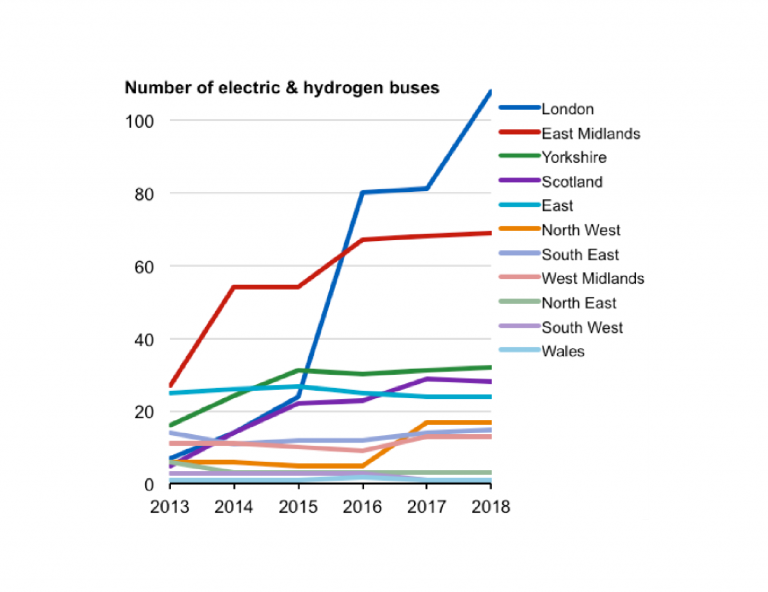
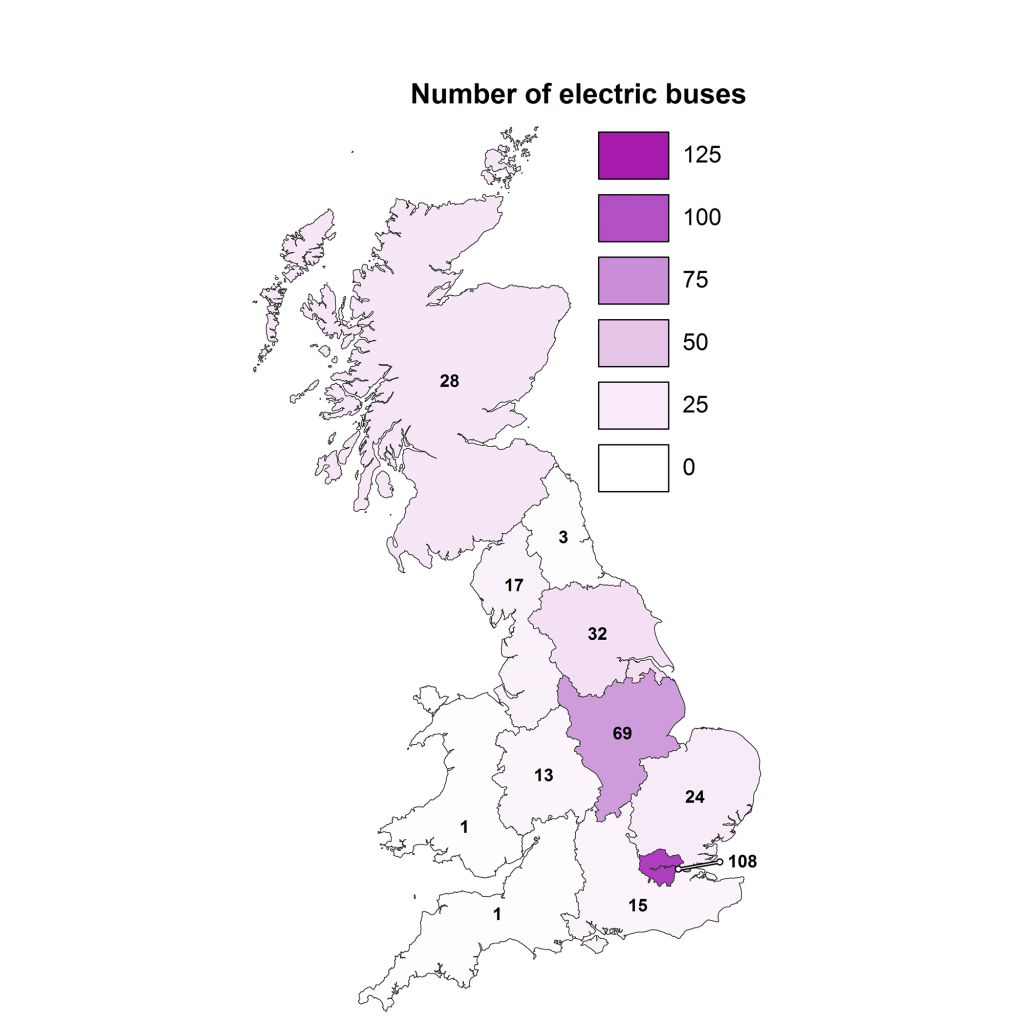
Figure 3.10: (left) Electric and hydrogen buses (blue line) and penetration of bus fleet (red line); (right) Number of ultra-low emission buses by region between 2013 and 2018 (quarter 1).
The share of battery electric and hydrogen buses in each region is affected by the commitments made by cities within each region. The East Midlands has the greatest share of electric buses compared to any other region. Nottingham, in the East Midlands, has been an early adopter having just increased their fleet to 58 electric buses. Cities tend to make their commitments to electric buses due to the air quality improvements they can provide. London has seen a 15-fold increase between 2013 and 2018 in the number of electric and hydrogen buses, which is linked to TfL’s air pollution commitments. The continued transition towards electrified public road transport will depend on cities, as currently electric buses have been limited to relatively short routes. However, with the implementation of a larger hydrogen network across the country, non-metropolitan areas could also benefit from an ultra-low emissions bus network.
3.1.6 Ultra-low emissions heavy goods vehicles
Less than 0.1% of the heavy goods vehicle (HGV) fleet is considered ultra-low emission.
This is not surprising as the transition is likely to be based around hydrogen fuel, which is lacking a developed refuelling network.
Ultra-low emissions HGV deployment is limited in Britain, with only four regions having more than 1 in 1000 heavy goods vehicles on the road.
Progress towards the electrification of HGVs is not on track to achieve the 2030 target, where 5.5% of the HGV fleet must be electrified.
Currently, less than a tenth of a per cent of the HGV fleet is considered ultra-low emissions. This is not unsurprising, as HGV technology currently limits its transition to using hydrogen, which, as discussed previously, is lacking a developed infrastructure. However, companies such as Tesla, Daimler, Volkswagen and ThorTrucks, have unveiled plans to produce electric HGV vehicles, with Tesla aiming to start production as soon as 2019. These future technological advancements could help Great Britain achieve its target, but this will be dependent on when these vehicles are commercially rolled-out.
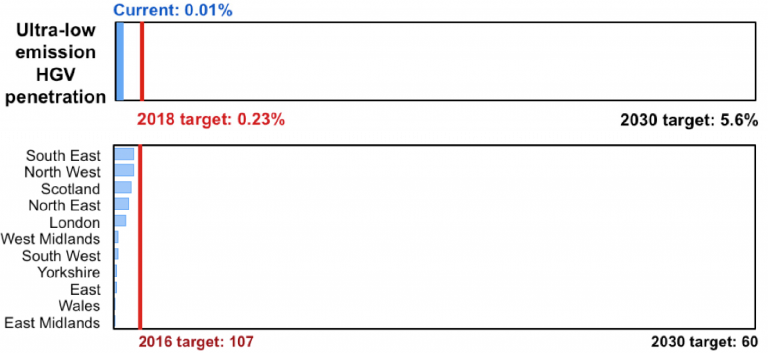
Barometer for ultra-low emission HGVs.
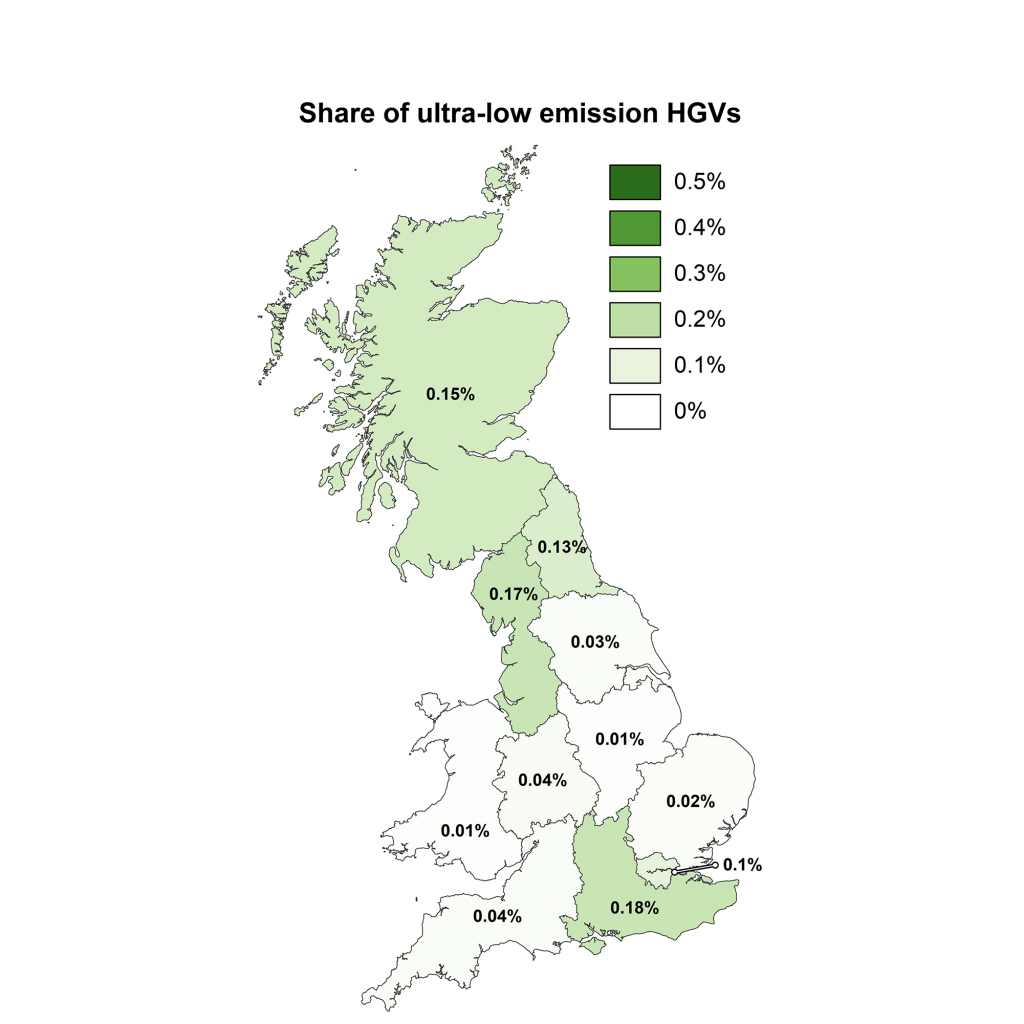
Regionally, the South East, North West and Scotland have the greatest proportion of ultra-low emission HGVs. These regions are equipped with or are near hydrogen refuelling stations. Wales, on the other hand, has over 10% of British hydrogen refuelling stations, but have one of the lowest share of ultra-low emission HGVs in its fleet. This is likely explained by the fact that these hydrogen refuelling stations are located at universities/research centre, and therefore are not likely to play a large role in ensuring an uninterrupted hydrogen network. Further, it is important to note that differences between regions are very small and all regions are at risk of not achieving the 2030 target.
3.1.7 Rail emissions
Rail emissions have decreased by only 1% since 2010, suggesting the industry is falling well behind the progress needed to achieve the 2030 target.
Abandoned electrification plans are jeopardising the achievement of the 2030 rail emissions target.
The proportion of electrified rail has only modestly increased since 1985, allowing only a small segment of the rail network to benefit from a decarbonising power sector.
By 2030, the rail industry needs to reduce its direct and indirect emissions by 25% as compared to 2010. Emissions reductions will likely occur in an exponential fashion due to the inertia of the industry and the relatively long time-frames required to complete infrastructure improvements. It is, therefore more likely that emissions reductions will occur in large discrete steps, rather than constant yearly reductions. However, since 2010, emissions in rail have only decreased by 1% suggesting that there is still considerably more work required to achieve the 2030 target.
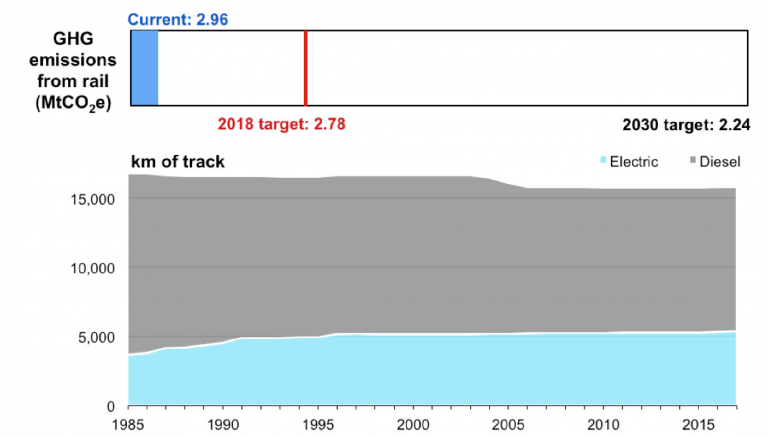
Barometer for rail emission reductions. Top: national progress; Above: share of electrified railways across Britain over the last three decades.
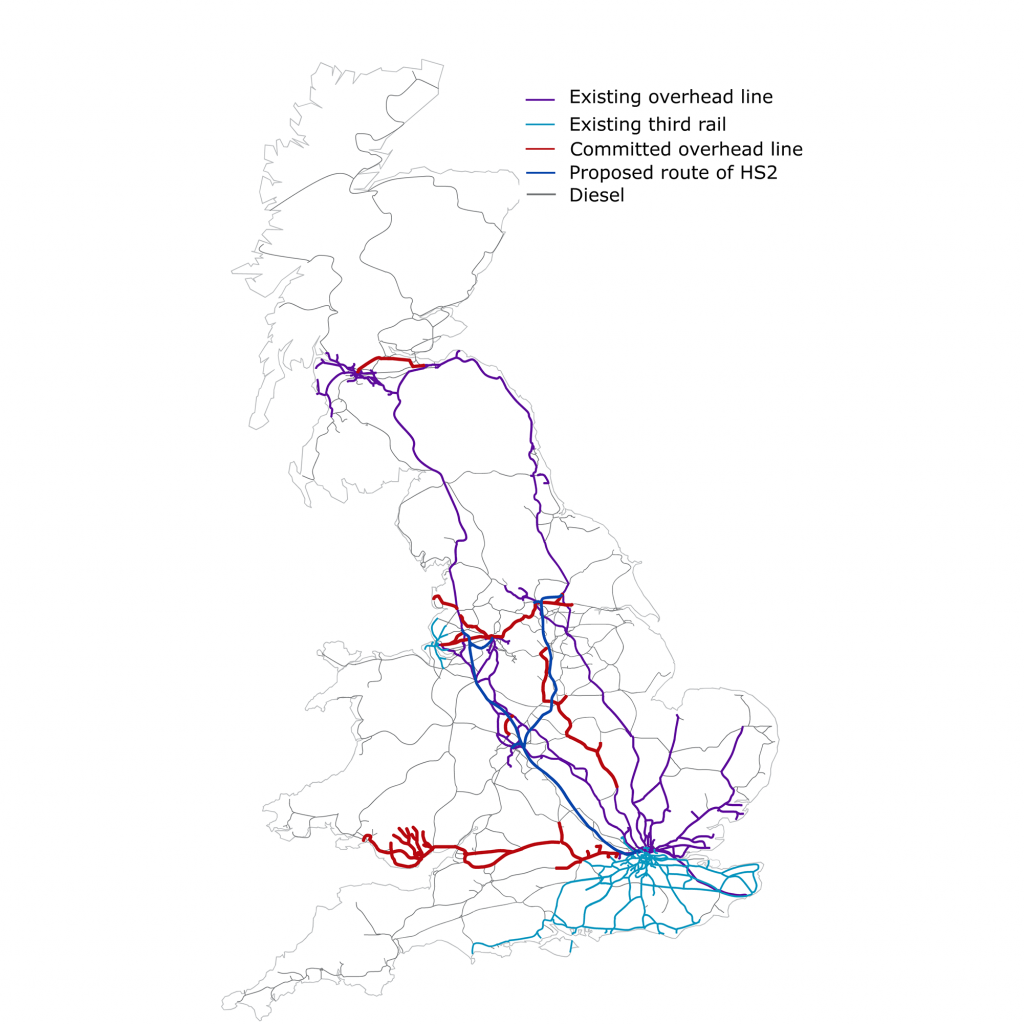
Figure 3.12: map of Britain’s railway lines, with colours to signify existing or proposed electrified lines, and grey to signify diesel.
To remain in line with the target, emissions will need to start falling due to greater overhead electrification and increased use of bi-modald, battery and hydrogen trains, as well as the use of other low carbon fuels. As the target includes both direct and indirect emissions, the sector could benefit from increasing the proportion of railways that are electrified to capture the falling carbon intensity of the power sector. However, there has been very modest progress towards railway electrification in the last 30 years (Figure 3.12). The proportion of electrified rail in a year is sensitive to the completion of electrification projects. The recently abandoned overhead electrification plans on the Great Western Main Line, Midland Main Line and Lake Line suggests that the proportion of electrified rail will not dramatically increase in the near future, jeopardising the 2030 target. But, the government does suggest that trains on these lines could be battery and hydrogen powered. While the proportion of electrified rail will increase with the completion of High Speed 2, this is not expected to be completed before the late 2020s, and therefore its contribution towards achieving the target could be limited, especially if there are any completion delays. Further, part of the remaining regions to electrify are too remote, and therefore the business case for electrification is not strong.
3.2 Implications of a transitioning transport sector
3.2.1 Total cost of car ownership passenger vehicles
A regional analysis of the total cost of ownership (TCO) of conventional (petrol and diesel), battery electric (BEV) and plug-in hybrid electric (PHEV) reveals which regions will incur a greater financial burden from electrification. This investigates the impacts of regional differences (e.g. driving habits, fuel costs) on the TCO of privately-owned vehicles. Appendix 1 provides an overview of the methodology, while Appendix 2 provides further analysis of the results.
The TCO gap is the difference in the lifetime cost of owning one vehicle over another. At a national level, the TCO gap is greatest between a petrol vehicle and a PHEV (~£6,200) and is the smallest between a diesel vehicle and a BEV (~£1,900). The regional variation in TCO is strongly related to the regional differences in kilometres driven, and, to a smaller extent, the regional variation in fuel cost prices (i.e. electricity, petrol and diesel). The annual distance travelled by each vehicle impacts its fuel requirements, depreciation rate and maintenance cost.
Further, recent changes to the Plug-In Grant Scheme –BEVs, as of the beginning of November 2018, will receive £3,500 instead of £4,500 and PHEVs will no longer receive any subsidy, previously £2,500 – has increased the TCO gap between these electric cars and fossil fuelled ones. Prior to this change, the TCO gap between a petrol vehicle and PHEV was ~£3,700 and between a diesel and BEV was ~£900.
Irrespective of vehicle type or changes in the Grant Scheme, the TCO gap is highest in Wales and Scotland, and lowest in London (Figure 3.13).
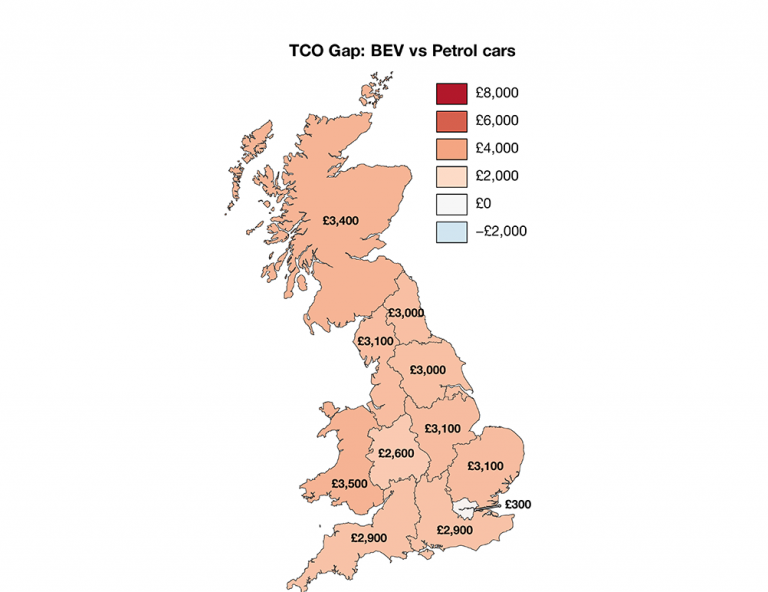
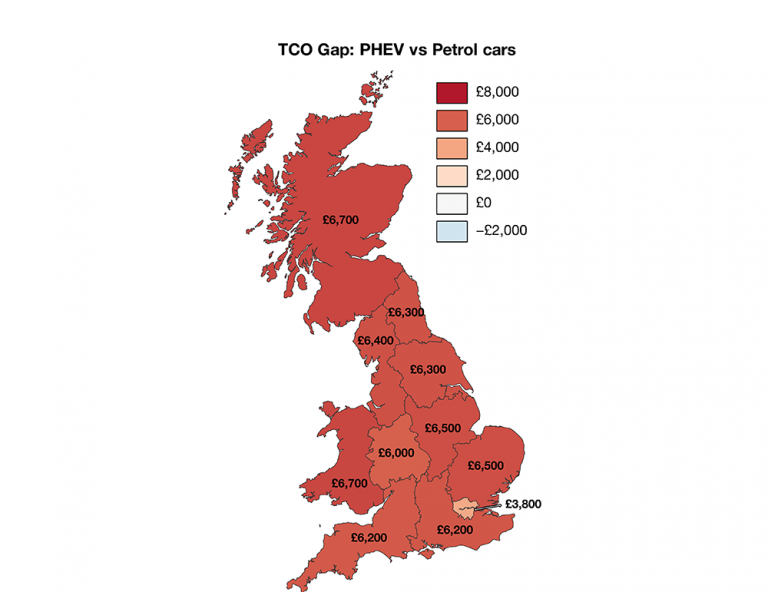
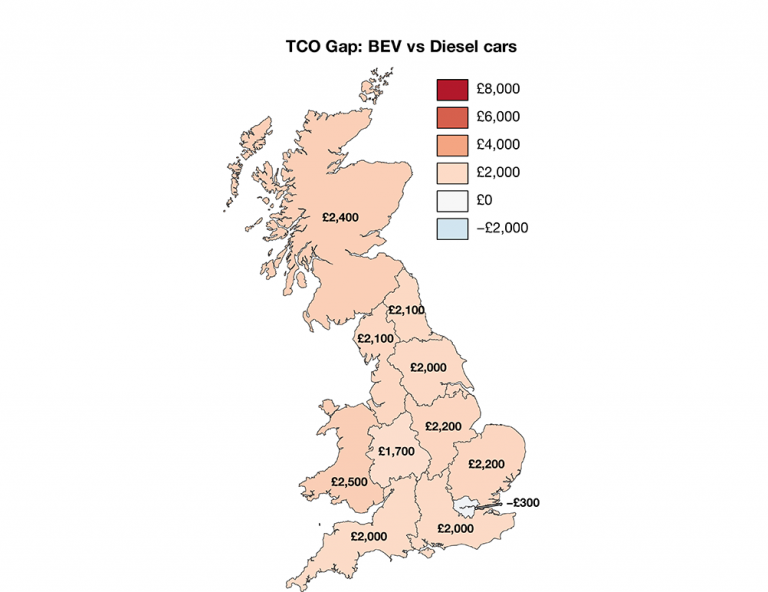
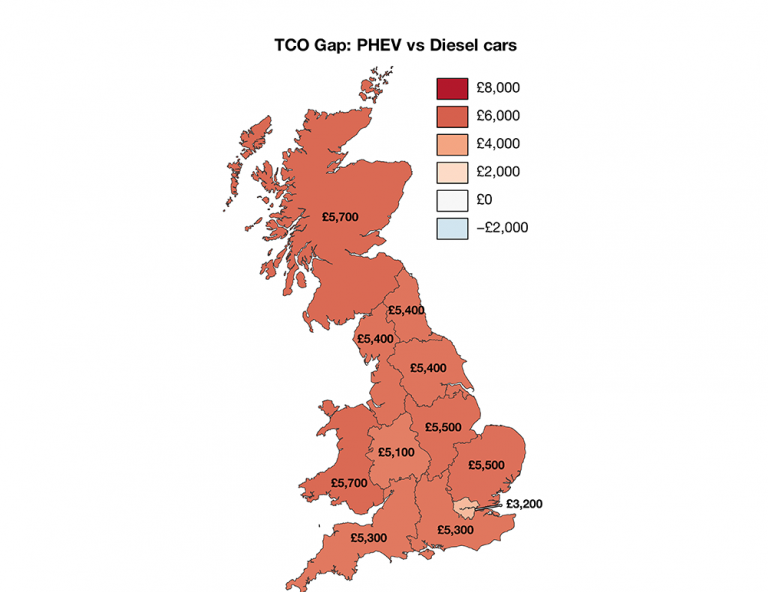
Figure 3.13: Regional TCO gaps between conventional and plug-in vehicles.
In London, unlike other regions, private vehicle use is not the main commuting mode, resulting in lower annual driving distances and subsequently lower TCOs.
Further, London has implemented an additional tax – the Congestion Charge – from which plug-in vehicles are exempt. As a result of this driving pattern and the additional charge on diesel (and petrol) vehicles, in London, the TCO of a BEV is lower than diesel vehicles. Prior to the change of the Plug-In Grant Scheme, the TCO of a BEV was also lower than a petrol vehicle in London. Further, this research assumed that a vehicle would only enter into the Congestion Charge zone eight times in the year. However, if travelled
into every working day, the annual cost of a petrol and diesel vehicle would increase by up to £3,000. Therefore, due to the additional £9,000 cost that would be incurred over a 3-year period for fossil cars, the TCO of PHEVs becomes lower than fossil-fuelled vehicles in London. If similar schemes were introduced in other regions, it could significantly improve the economics of BEVs and PHEVs, bringing them closer or even below cost parity with petrol and diesel vehicles.
Battery electric vehicles are already cheaper than petrol and diesel cars in London. This is related to fewer kilometres driven and the additional congestion charge.

While the TCO gaps may suggest BEVs, and to a lesser extent PHEVs, are approaching cost parity with conventional vehicles, there are additional concerns that could further hinder the deployment of these electrified vehicles. The initial cost, including the Plug-In Grant, of BEVs and PHEVs, used in this analysis, are up to twice the price of petrol and diesel cars. This significantly larger up-front cost can negatively impact the uptake of plug-in vehicles, even if TCO costs were relatively similar. This is especially true for lower gross income households, though the burden of a high initial cost could be slightly dampened if vehicles are financed.
In general, the availability of charging facilities correlates with the uptake of electric vehicles across GB. This is evident when looking at Wales, which has the fewest electric charging facilities and the lowest EV share in its fleet. Scotland, on the other hand, is an exception where the high share of British EV chargers are offset by the high TCO costs of plug-in vehicles. This suggests that in some cases costs issues outrank a high charger availability. As London is currently the only region where switching to BEVs produces a financial benefit against diesel vehicle ownership, it is best suited to continue pursuing the transition towards an electrified private car vehicle fleet. Additional measures (e.g. congestion charge) could be implemented in other regions to even out TCO barriers, giving regions the same opportunities to progress along the electrified private vehicle transition.
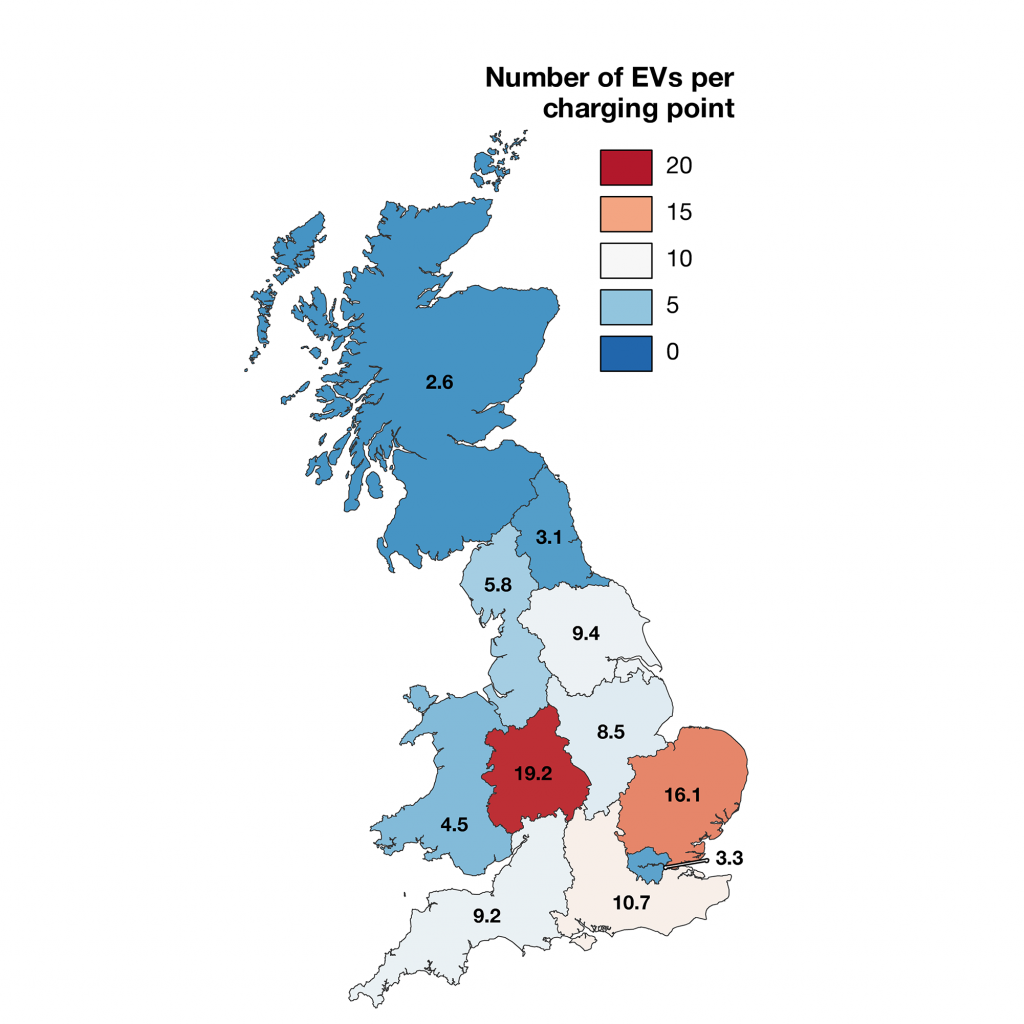
3.2.2 Availability of electric vehicle charging points
London, Scotland and the North East have a low ratio of number of EVs per available charging point, linked to having a higher proportion of EV chargers and/or a smaller (absolute) number of EVs (Figure 3.14). The East of England and the West Midlands have much higher ratios, suggesting greater competition for charging. However, this competition would not be as acute if EV penetration had not exceeded the 2017 modelled penetration of 0.4% of the fleet. This potentially suggests that in these regions the number of EVs is growing rapidly but is not being matched by charging infrastructure. On the other hand, if EV penetration in Wales had achieved 0.4% in 2017, it would have seen much greater competition for their EV chargers at 11 vehicles per charger. The regional variations in the number of EVs per charger would become even more pronounced by 2030, with competition being as low as 125 cars per charger in London to as high as of 590 cars per charger in the West Midlands. This competition will greatly affect vehicles owners who do not have private at-home charging. This competition would be amplified by overnight charging, if owners utilised these public points for such charging patterns, as vehicles will remain in these limited spots for longer periods, denying access to other vehicles. Therefore, this projected competition appears to suggest that the 27,000 EV charger target may not be sufficient to support the EV deployment.
Competition for EV chargers will become more acute if EV penetration targets are achieved. This is likely to be especially true in cities where more vehicle owners will not have private access to charging infrastructure.
The average distance between a home and the nearest charger will affect, at least in part, how a consumer perceives the ease of use of an EV. London has the lowest average distance between a home and a charger, which is not surprising given the high number of EV chargers and the high density of homes (Figure 3.14). Wales, on the other hand, has the largest average distance between chargers and homes. This could again partly explain, along with the higher TCO of plug-in vehicles, why uptake of EVs in Wales is lagging every other region.
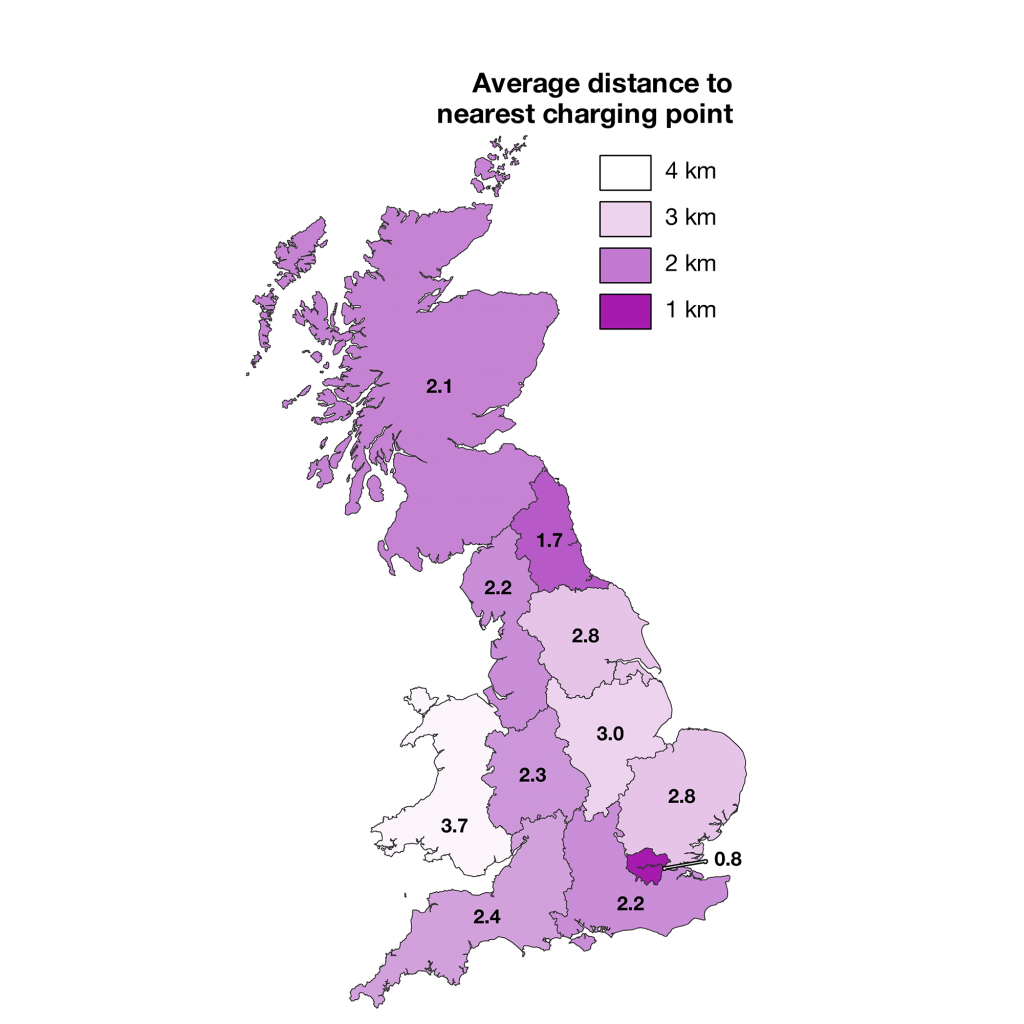
Figure 3.15: Average distance from households to the nearest EV charging point (both rapid or slow).
The average distance to an EV charger for British regions ranges between 0.8km and 3.7km, suggesting that charging facilities should not be a barrier to EV uptake, given current technology (Figure 3.15). However, when investigating in further detail where these chargers are located, it is not very surprising to find them clustered around cities – where population (and vehicle) densities are highest and where people have limited opportunities for private charging (i.e. do not have private garages/driveways). This suggests that anxieties over charging facilities may in part be dampened in cities but will remain present (if not stronger) in rural areas, where distances to chargers may be far greater. Rural areas, and non-metropolitan regions, are therefore at risk of behind left behind in the transition towards private-vehicle electrification.
A particular example of this is seen in Scotland, which has large areas without any charging points (particularly in the Highlands). Nonetheless, the average Scot is closer to a charging point than people in most English regions. This is because chargers in Scotland are heavily concentrated within Glasgow, Edinburgh, Dundee and Aberdeen, giving good coverage for most, but some people will be left more than 50 km away from any charging infrastructure.
The increase in EVs will have impacts on network loads, as the consumption of one vehicle is equivalent to an additional home. There is potential for these vehicles to charge overnight, when current demand is lowest. However, this will likely further change the demand profile. Further, owners will likely plug in their cars when they are parked, rather than returning to plug them in when demand is lowest. In this case, there is potential to delay or offset charging times, through smart charging to ease peak demand. Vehicle to grid (V2G) has been suggested as an extension to smart charging, which would enable electricity stored in EVs to be fed back into the grid at times of peak demand. Regions with less EV penetration and charger deployment could miss out on any benefit available from smart charging and V2G. This could mean more investment in grid reinforcement in these regions, with the cost being passed onto the consumers.
3.2.3 Railway investment
In 2016-17, £15.5 billion was spent on maintaining and improving the British rail sector, with three-quarters of the funding from central government and the remainder from local government and private corporations. There are, however, large regional disparities in where these funds are allocated. London received almost 50% of the total monetary input (£6.8 billion), while the North East received less than 2% (£290 million). When normalised by the total number of journeys taken in that same year, the North East, followed by Wales and the South West, invested the most per journey, whereas the East, South East and London all spent the least per passenger journey (Figure 3.16).
London spends more on railways than any other GB region, but the North East spends the most per passenger train journey.
When comparing Figure 3.16 to the electrification map (Figure 3.12), railway spending, electrification and spend per passenger journey appear to be correlated. Generally, regions – such as London, the South East and the North West – that have the highest absolute spend on rail are also the regions with the lowest spend per journey (due to high frequency of journeys) and have a large portion of the electric rail network. The reverse is generally true for regions with low absolute rail investment – such as Wales, the North East and the South West.
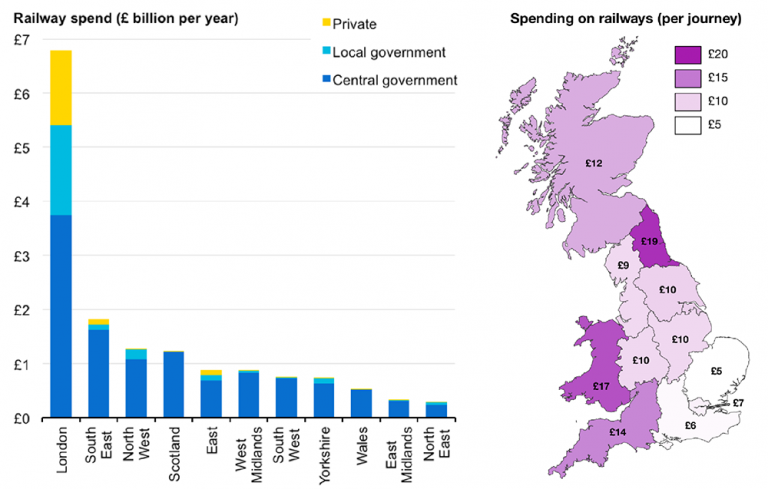
Figure 3.16: Railway investment in absolute terms and per passenger journey.
This suggests that despite the documented large up-front cost, electrification can be economically viable in the long-term, especially on routes with high passenger frequency. There are also additional benefits linked to greater investment in electrification, such as reduced journey times, quieter journeys and increased passenger use. These rail investments can therefore lead to modal shifts, which could result in even further GHG savings, especially if passengers are moving from private, fossil-based transportation.
Chapter 4:
Energy in buildings
Domestic buildings are a high-carbon sector due to heating. 83% of household energy is used for space and water heating. For economic and environmental reasons this is clearly the area to focus upon.
Domestic energy efficiency is lagging behind targets and non-domestic energy efficiency targets do not exist.
Scotland benefits from the largest share of high energy efficiency houses whilst Wales has the poorest performing housing stock. This has a large effect on energy bills, especially with electric heating, which can have significantly higher costs than oil or gas. Low energy efficiency is also linked to fuel poverty. However, this correlation is hard to see with the averaged out regional data.
Fuel poverty has been fairly even across Britain, but it is generally more prevalent in northern regions than southern ones, matching the trends in household income.
Few low-carbon heating systems (e.g. heat pumps) have been installed so far. Large deployment targets to 2030 will require a very rapid scale up. This will affect the cost of energy for each region differently, depending on the housing composition.
Electric heating is generally more expensive than on-grid gas and oil at current prices. Changing heating technology is capital intensive and is much more achievable in non-rental housing unless the right policy conditions are in place, putting more stress on low-income households that rent.
Southern England and Scotland spend the most on domestic energy. However, northern England and Scotland spend more of their income on energy than in the south. The difference in average spend by local authority area varies by approximately £750 per year.
Extreme electrification in the future could benefit energy spend in Scotland and the South-West, while increasing costs for midland and northern regions of England.
There are already high levels of electrification in non-domestic buildings. The South of England is the most electrified part of Britain in this sub-sector.
London and the South spend less on energy relative to Gross Value Added, making companies in these regions less susceptible to changes in the energy system.
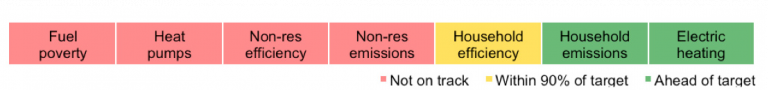
Figure 4.1: Progress towards transforming Britain’s buildings, highlighting the areas that are under- and overperforming
relative to near-term targets for decarbonisation. Each area is reviewed later in this section.
4.1 Overall buildings current status and future targets
The energy transition in buildings is primarily driven by the cost of energy and climate policy. The sector has seen many initiatives (e.g. Green Deal) over the past decade to facilitate the reduction of demand, with the aim that these will bring lower energy bills and lower GHG emissions. There are two main sub-sectors within buildings: domestic and non-domestic, the latter comprising of commercial and public buildings but not industrial or agricultural buildings. Electrification in buildings currently makes up about 35% of total consumption (see Figure 1.3). There is a large difference between the buildings subsectors. Commercial buildings utilise electricity for approximately 50% of their energy use, whereas domestic buildings only use just above 20%. Public buildings are only slightly more electrified at just below 30%.
The direct GHG emission reductions in all buildings are on track to achieve the 2030 target. For direct emissions, reductions are either achieved by reducing consumption of energy (outside of electricity) or fuel switching to electricity. The factors affecting these methods are investigated in the following sections, where domestic and non-domestic buildings are considered separately.
Towards a 2030 future, a combination of a change to low-carbon heating technologies and increasing energy efficiency will drive a reduction in direct GHG emissions from this sector. Electrification of heating is one method to achieve
decarbonisation in buildings – shifting the emissions burden from the buildings sector to the power sector. Although a viable option, the economics and practicalities of electrification for heating versus a range of other low-carbon options, such as hydrogen and biomass is still unclear. The exact individual contributions of each of these technologies to a low-carbon buildings sector will become clearer through the 2020s, where policies will be implemented to reach climate targets and rapidly falling costs of renewable generation technologies. The electrification through heat pumps is forecasted to become common place throughout British homes, with a predicted 1 in 12 households utilising this technology in 2030. At the same time, this will be supported by an energy efficient housing stock, with approximately 3 out of 4 houses having an Energy Performance
Certificate above a band C. This improvement will help to lower consumption, reducing energy bills or soften any possible increases in the cost of heating through alternative technologies and fuels.
The lack of available data and targets leave the future energy transition in buildings unclear, with even the current state of energy in buildings being relatively difficult to determine, when compared to other sectors. This is particularly evident in nondomestic buildings, where little information on the sub-sector’s progress exists.
Elevated levels of heating electrification in non-domestic buildings is likely to be a good option for further decarbonisation, although increases in commercial energy spend may affect businesses in some region more than others.
4.2 Current status and future targets for domestic buildings
4.2.1 Domestic GHG emissions
The reduction of direct GHG emissions from domestic buildings is on track. Direct emissions reductions have mainly been achieved through reducing consumption by increasing energy efficiency and by switching heating to cleaner fuels or to electricity (where it is then accounted for in indirect emissions – the power sector).
Over 80% of energy used in homes is for heating – suggesting large potential for continued decarbonisation.
These options have been supported by government policies aimed at increasing energy efficiency (e.g. Energy Company Obligation) and low-carbon energy technologies in homes (e.g. through the Renewable Heat Incentive).

Figure 4.2: Barometer for direct GHG emissions from domestic buildings.
Heating (space and water) dominates domestic energy usage, accounting for over 80% of total domestic building energy demand. Lighting and appliances are 100% electrified, whereas cooking still uses fossil fuels in many homes but can be electrified with relative ease4. Heating (water and space) is predominately achieved through the combustion of fossil fuels but electric replacements are usually less straightforward and can be more expensive. Most of the economic and environmental savings in domestic buildings can be achieved by increasing their thermal energy efficiency and/or by switching heating technologies and fuels. There is potential of decreasing direct emissions further through electrification of heating (or other low-carbon options). However, the additional (indirect) emissions could result in an overall net-increase if power sector does not decarbonise fast enough. The following sections now focus on these efficiency and heating technologies measures, as well as their socio-economic implications.
4.2.2 Energy efficiency
The Energy Performance Certificate ratings of buildings is currently behind where modelling predicts it needs to be. Although, it is within 90% of the 2018 target.
Homes in Scotland and South East England have the highest energy efficiency, while Wales the lowest efficiency homes.
A high proportion of the emission reductions required to reach the CCC 2030 GHG target is apportioned to energy efficiency measures. Total buildings GHG reductions by 2030 must be 26% for domestic and 21% for non-domestic users. This emphasises the importance of energy efficiency measures to achieve the overall targets.
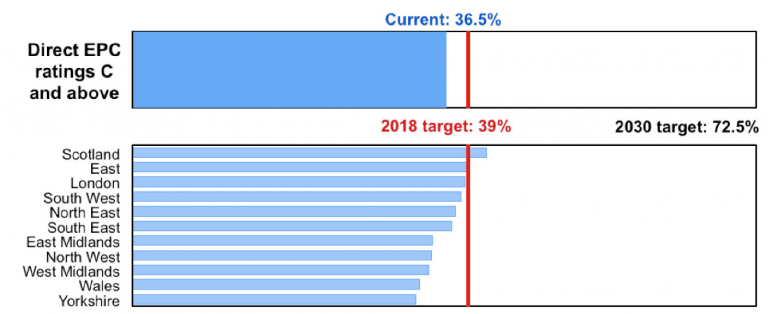
Figure 4.3: Barometer for energy efficiency by Energy Performance Certificate (EPC) ratings. Top: national progress; Above: regional progress.

Figure 4.4: Regional analysis of energy efficiency ratings.
The range in the average regional proportions only varies by approximately 10%. Yorkshire, the East Midlands and the Southwest have lower energy efficient homes than the South of England and Scotland.
Scotland has the highest energy efficiency homes and has benefitted from strong government agenda to support on the issue, initially through advice and education. Other reasons for the regional differences are unclear but may include the age of the properties; newer houses have a better performance on average than older ones, with more new homes built in the southern, more efficient regions. Also, the affordability of energy efficiency improvement measures can be a barrier, as the areas with lower efficiency typically have lower household income.
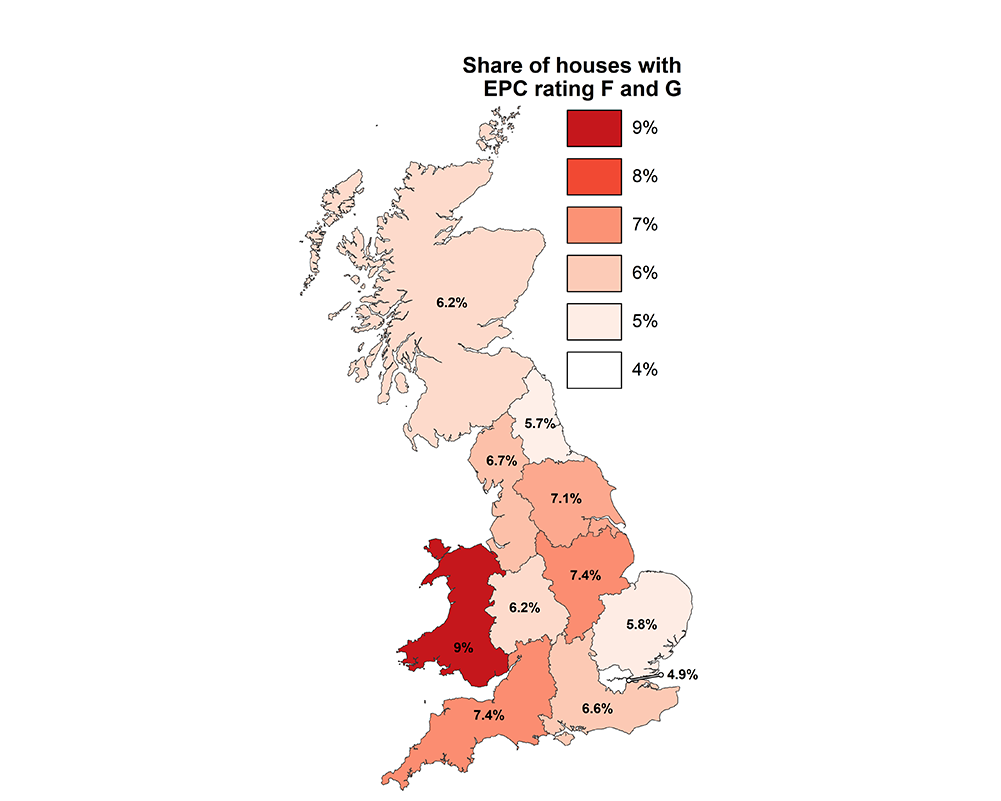
Figure 4.4: Regional analysis of energy efficiency ratings.
Generally speaking, the regions with the most EPC ratings of F and G have the lowest proportion of EPC ratings of C and above. Scotland has the most households with high EPC ratings andWales and Yorkshire have the least.The level of low EPC ratings has a correlation with population density, with the more rural areas having a higher proportion than the urbanised areas.
As buildings transition to cleaner heating technologies, energy efficiency will be important in keeping household energy bills down. Electric or low carbon heating sources can be more expensive than current heating (see section 0), so increases in efficiency are important to offset these costs. The current lowest efficiency homes are found in areas with lower incomes and, therefore, would be more sensitive to energy cost increases – highlighting the importance for action to mitigate this effect in the future.
4.2.3 Fuel Poverty
Poor energy efficiency in homes is often linked to fuel poverty, as household bills can become too high to maintain a level of comfort. 11% of households in Britain are fuel-poor. There is small (approximately 5% at the most) variation in the proportions of fuel poor homes in each region. Although,
it is important to note, even these small percentage changes means thousands or even tens-of-thousands of homes.
The Midlands, northern England and Scotland had the worst fuel poverty rates in GB between 2012 and 2016.
For fuel poverty an interim target was not included, as the eradication of fuel poor homes as soon as possible should be the objective. The political nature of this metric means that there are no milestones available for 2018. Therefore, the status of fuel poverty in Britain was deemed to be not on-track.
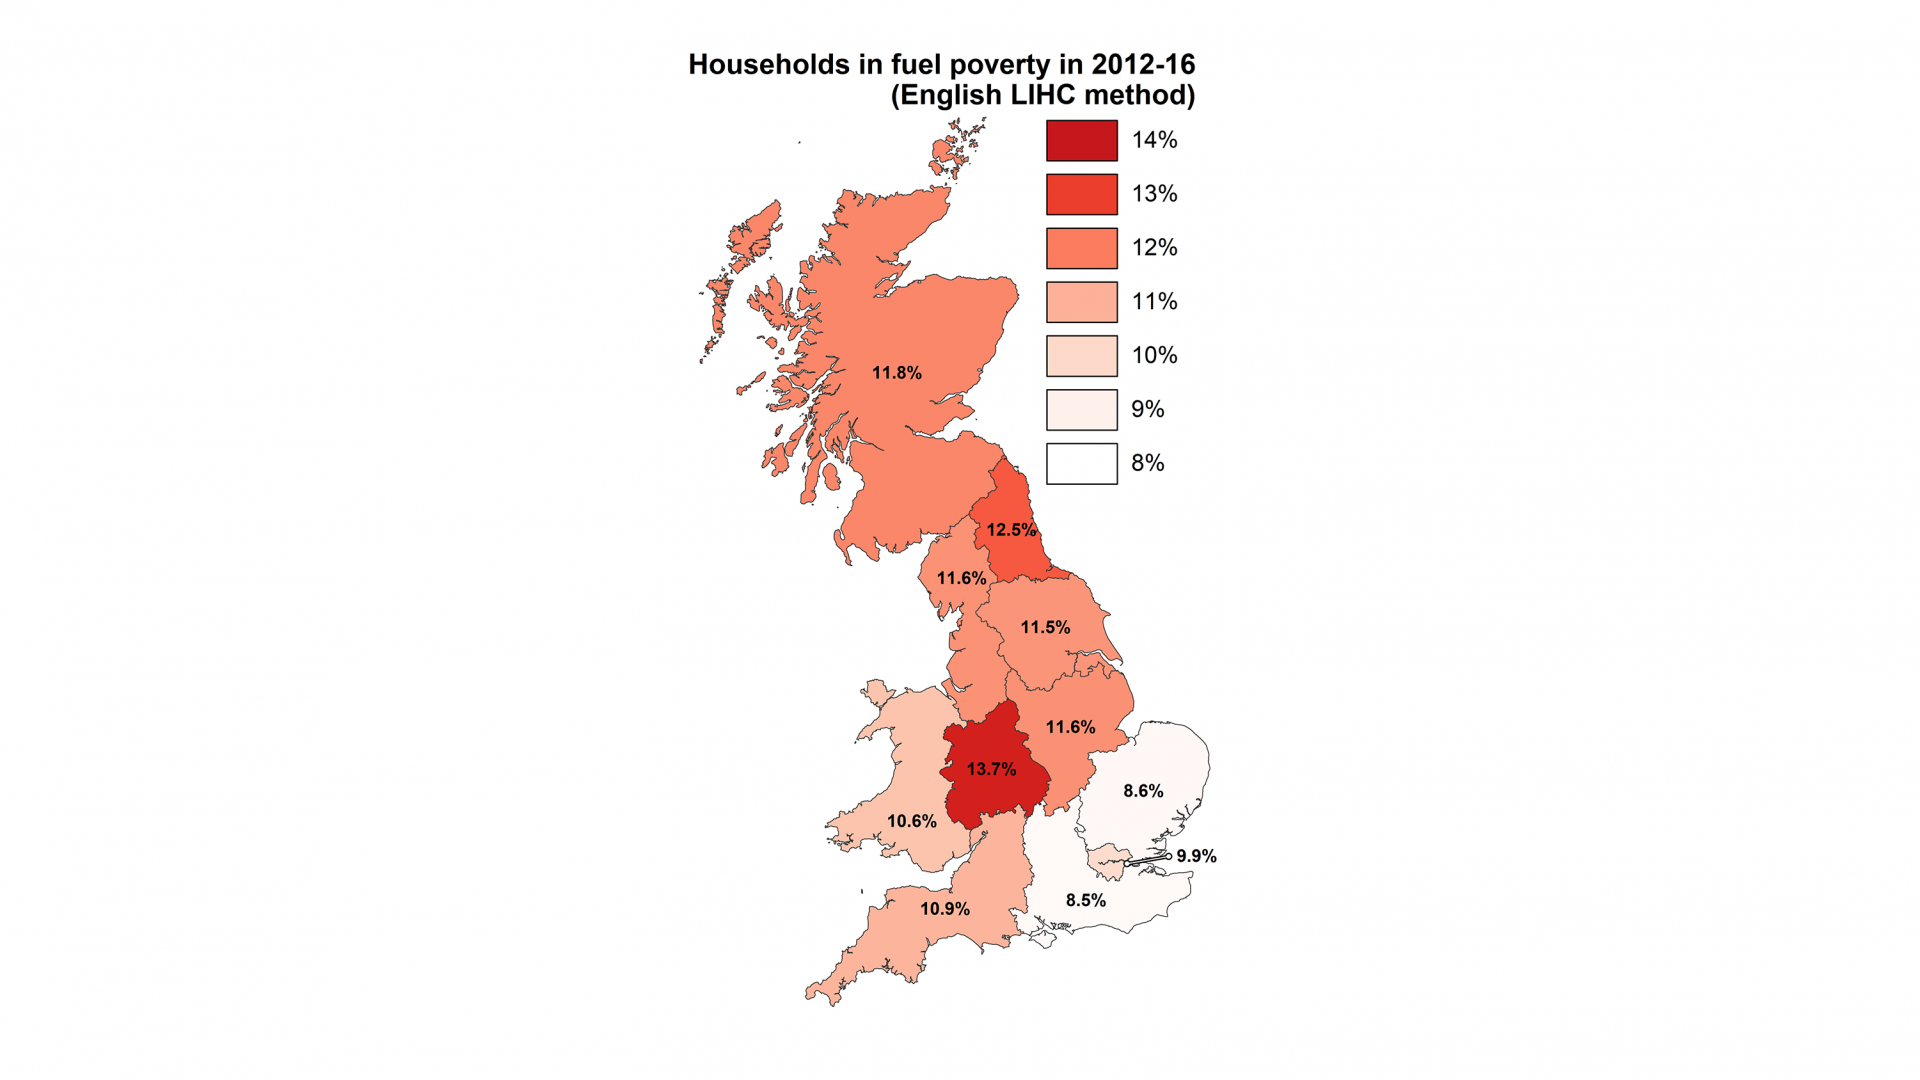
Figure 4.5: map of current status.
The Devolved Powers calculate fuel poverty through different methodologies. In Figure 4.5, the results are shown using the low-income high-cost methodology (LIHC), which is used by England, but applied to Scotland and Wales. However, using one methodology to calculate fuel poverty that is consistent and comparable between all the Devolved Powers would be useful for effective policies and measurement of progress.
Using the national-specific methodologies, Scotland has a 34% rate of fuel poverty, and Wales 23% – significantly higher proportions than those identified by the LIHC method. This is important as it dictates how many households get additional funding, but does not give a consistent comparison across Britain.
Other factors linked to fuel poverty are usually income and the ownership status of the property – whether it is let to a tenant or owned by the occupant. The restrictions of upgrading a let property means that the tenant may not be able to implement any improvements; landlords do not gain enough value themselves to implement the measures and vice versa for the tenants. 38% of homes are rented, meaning large proportions of the population are subject to these restrictions.
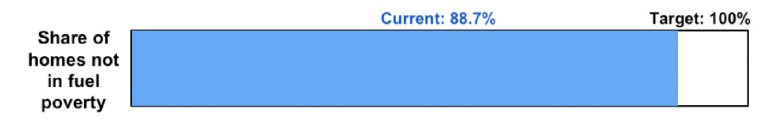
Barometer for fuel poverty.
Scotland, although having higher energy efficiency, has a mid-range value for proportion of fuel poor homes when compared to the rest of the country in the LIHC method. This could be caused by the low average income per household in this region as well as climatic factors. There are generally higher fuel poverty rates in the northern and midland regions of England and also Scotland, supporting the income per household and climatic variation reasoning. The averaging of household income and fuel poverty rates across a region like the South West could be masking information about the spread and difference in wealth. There are large areas of relative poverty in the South West and this could also be driving the fuel poverty rate in this region.
Similarly, the highest proportion of fuel poor homes seen in the West Midlands could also be affected by the same reasoning of that in the South West. The Midlands and the northern regions of England have some of the lowest shares of homes with EPC ratings C and above, suggesting that this negatively affects the share of fuel poor homes in this region negatively. However, the West Midlands, although having the highest fuel poverty rates, also has one of the lowest proportions of homes with EPC rates F and G (the lowest ratings). This confirms that although poor energy efficiency is linked to fuel poverty, there are other factors in these regional averages that have a significant effect on the levels of fuel poverty.
4.2.4 Electrification of heating
The electrification of heating is one option to potentially reduce the climate impact of energy use in homes. Heating is currently 8% electrified and on-track to reach 2030 target.
Electric heating penetration is highest in Scotland and the South West where there are high proportions of off-gas grid households.
However, whether electrification of heating will reduce household energy bills depends on many factors, including the efficiency of the heating technology; the price of electricity; and the efficiency of the home.
In GB, over 75% of households are connected to the gas grid. The use of efficient boilers in homes connected to the gas grid has helped see emissions reductions. However, further decarbonisation with gas combustion technology is highly limited, raising questions on what technology will proliferate in a low carbon energy transition. The future of heating is still under debate; the main options touted are electric heating, biomass and hydrogen, with varying degrees of hybridisation and co-existence. Electric heating (e.g storage heaters) is not a new technology.
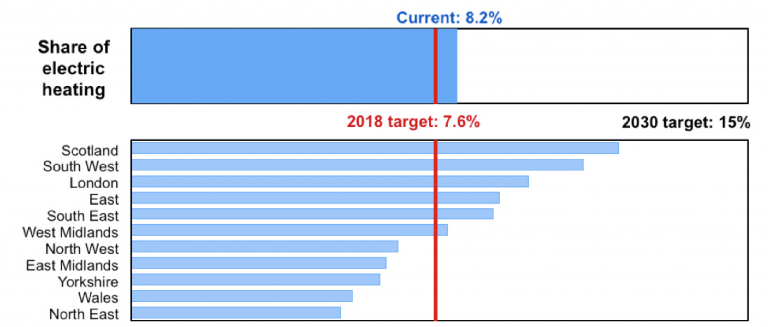
Barometer for electrification of heating. Top: national progress; Above: regional progress
However, there are questions over the efficiency and affordability of these older technologies given the current electricity price (higher when compared to gas and oil) and the efficiency of the current housing stock. Newer technologies are considered viable, notably heat pumps, claiming high efficiencies, potential heating bill decreases and fewer carbon emissions. There are two types of heat pumps: airsource (ASHP) and ground-source (GSHP), where GSHPs have higher efficiencies but require larger amounts of land and are more costly to install. As with all electrification technologies, emissions depend on the carbon intensity of the power system and would be accounted for in the power sector, reducing buildings’ direct emissions.
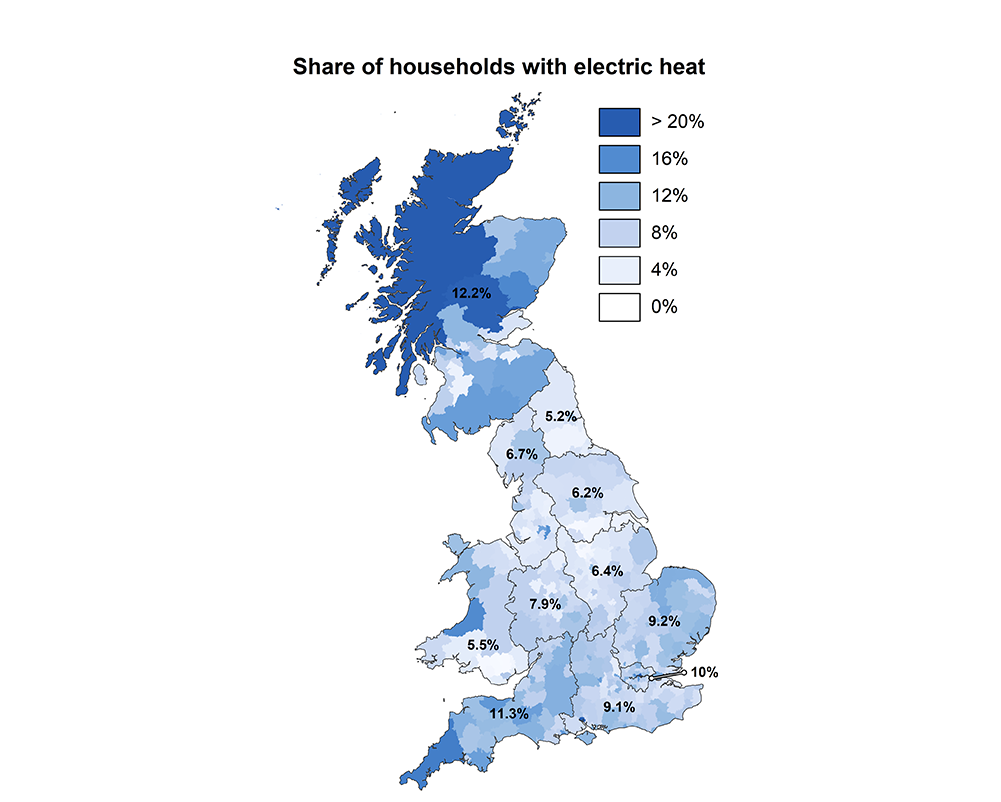
There is a split regionally in share of electric heat with Scotland and the South of England being above the national average of 8%. The remainder of Britain: the Midlands, North of England and Wales are below it. There is a greater variation, ranging from 0-25% of homes using electric heat, when analysed at a local authority level. The extremities of Britain are the most electrified with the Highlands and Islands of Scotland seeing up to 25% electric heating; the most westerly tip of the South-West also having high proportions. This is mainly due to the lack of gas grid connection in these areas (see Appendix 3).
As the energy system in Britain transforms, the areas with high penetrations of electric heat are susceptible to any changes in electricity price – especially as the majority of current electrification of heating is not through the high efficiency options, such as heat pumps. Price rises will have a greater impact on those households which use the most electricity.
4.2.5 Heat pump deployment
The CCC model that 2.2 million heat pumps should be deployed by 2030, rising to 5.8 million by 2035. This assumes a cost-optimised deployment rate of over 400,000 heat pumps per year in 2030, and 900,000 per year in 2035. For context, Britain installed approximately 6,500 heat pumps last year.
Heat pump deployment is not on-track. Currently, 1 in 650 homes has a heat pump, this must rise to 1 in 12 by 2030.
Scotland and the South West are ahead of target deployment of heat pumps, whilst all other regions are behind. This is likely because the installation of heat pumps is most attractive (practically and economically) in areas with high off gas-grid houses. London is only at 5% towards its 2018 interim target.
Heat pumps deployed in 2017 totalled 40,989 units (31,882 as air-source heat pumps (ASHP) and 9,107 ground-sourced heat pumps (GSHP)). According to CCC modelling, to achieve climate targets, there should be should behave been 65,000 heat installed by 2017, therefore suggesting current deployment is not on target. The current installation rate of approximately 6,500 per year is much lower than the modelled 28,000 per year in 2017. Heat pump installation is expected to ramp up during the 2020s and any delay could be compounded, making targets difficult to reach.
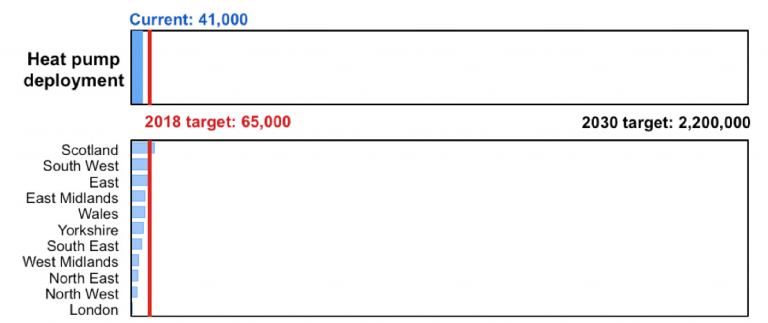
Barometer for heat pump deployment. Top: national progress; Above: regional progress.
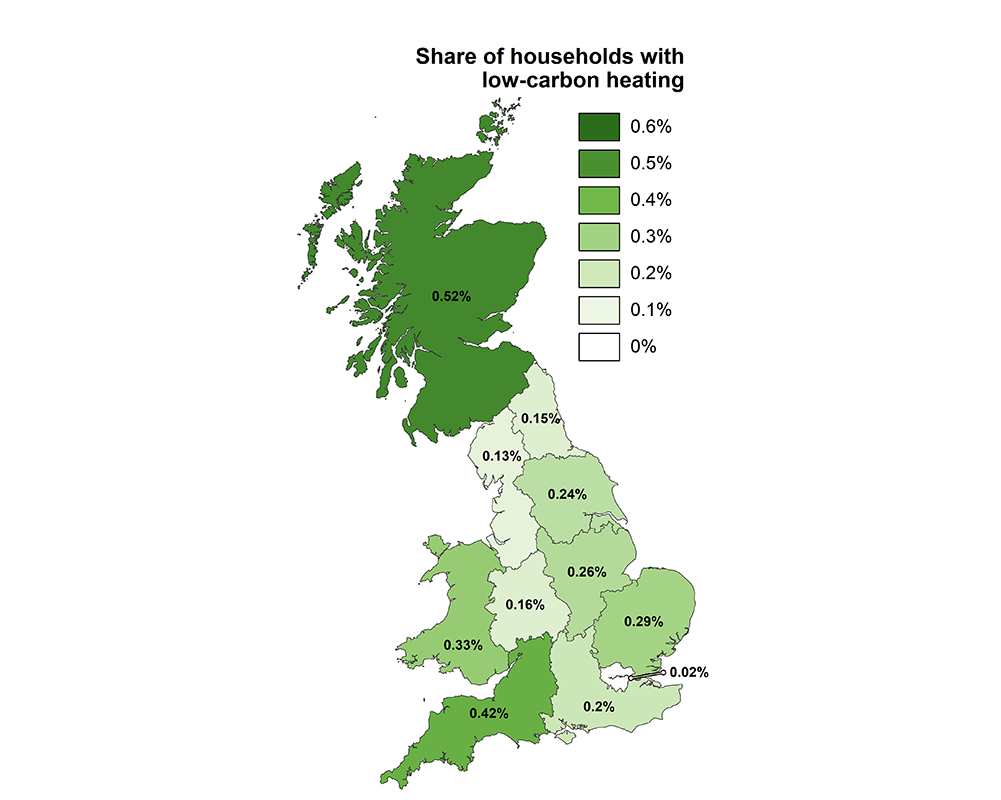
Figure 4.7: map of current deployment of all low-carbon heating technologies (including biomass and solar thermal).
Aside from heat pumps, there are other low-carbon technologies: biomass boilers and solar thermal (only for water heating. Scotland has high biomass deployment, as well as ASHP, possibly related to the large share of off-gas grid homes in the northern part of the region. Further, the South West also has high deployment of low-carbon heating technologies (Figure 4.7). In contrast, there are lower levels of deployment in the Midlands and northern parts of England. These areas have a high penetration of gas grid connections and on average lower household income. The latter may limit the ability to afford the high upfront capital costs of low-carbon heating.
London has significantly lower deployment of low carbon technologies, even though the proportion of houses off the gas-grid is similar to the rest of the country. This may be down to the number of homes owned compared to rented. Heat pumps and especially biomass boilers with fuel storage are large, and in urban settings space comes at a premium or is not available – for example in blocks of flats. Therefore, installation of these low-carbon technologies may not be practical. There are further air quality concerns about biomass boilers within urbanised areas, such as central London. These urbanised areas could benefit from support of other heating technologies not discussed here, such as district heating systems.
Scotland and the South West have the most low-carbon heating deployments. However, low-carbon heating penetration is below 1% in every region of Britain.
The overall percentages of low-carbon heating are very low and even lower for just heat pumps. This shows, when compared with the electrification share in Figure 4.6, a very small proportion are these efficient electrical heating technologies and will instead be utilising less efficient technologies such as storage heaters. This will have a negative effect on the cost of energy for those areas with high (inefficient) electrification (see section 4.2.4).
4.3 Implications for household consumers
This section extracts some of the socio-economic factors of the current energy system for buildings and suggests a view of what a future may look like with further transformation.
4.3.1 Household energy costs
The current energy system outlined in the previous section results in the costs to domestic consumers shown in Figure 4.8. Household spend was calculated by using electricity and gas retail prices per region; fixed yearly electricity and gas cost per region; electricity and gas consumption by local authority and number of houses per local authority.
The regional map shows that household costs, on average, only vary by ~£180 across GB. Scotland and the South-East have the highest prices. However, at local authority level, there are variations of over £1000 in household energy spending.
The energy spend in central London is very low (~£800) whereas on the outskirts into the South East the costs can be almost twice as high. This is likely related to the types of housing in each are, with central London featuring smaller flats and terraced housing compared to larger detached properties of the South East. Low costs are also seen in mid-Wales and along the East coast of England, particularly in Yorkshire and the Humber and the North East regions. Wales has a high proportion of off-gas grid homes but does not have a high penetration of electric heat. The northern regions in England have high share of on-gas grid properties and therefore benefit from low cost heat.
Southern England and Scotland spend the most on domestic energy. The difference in average local authority spend varies by around £1000.
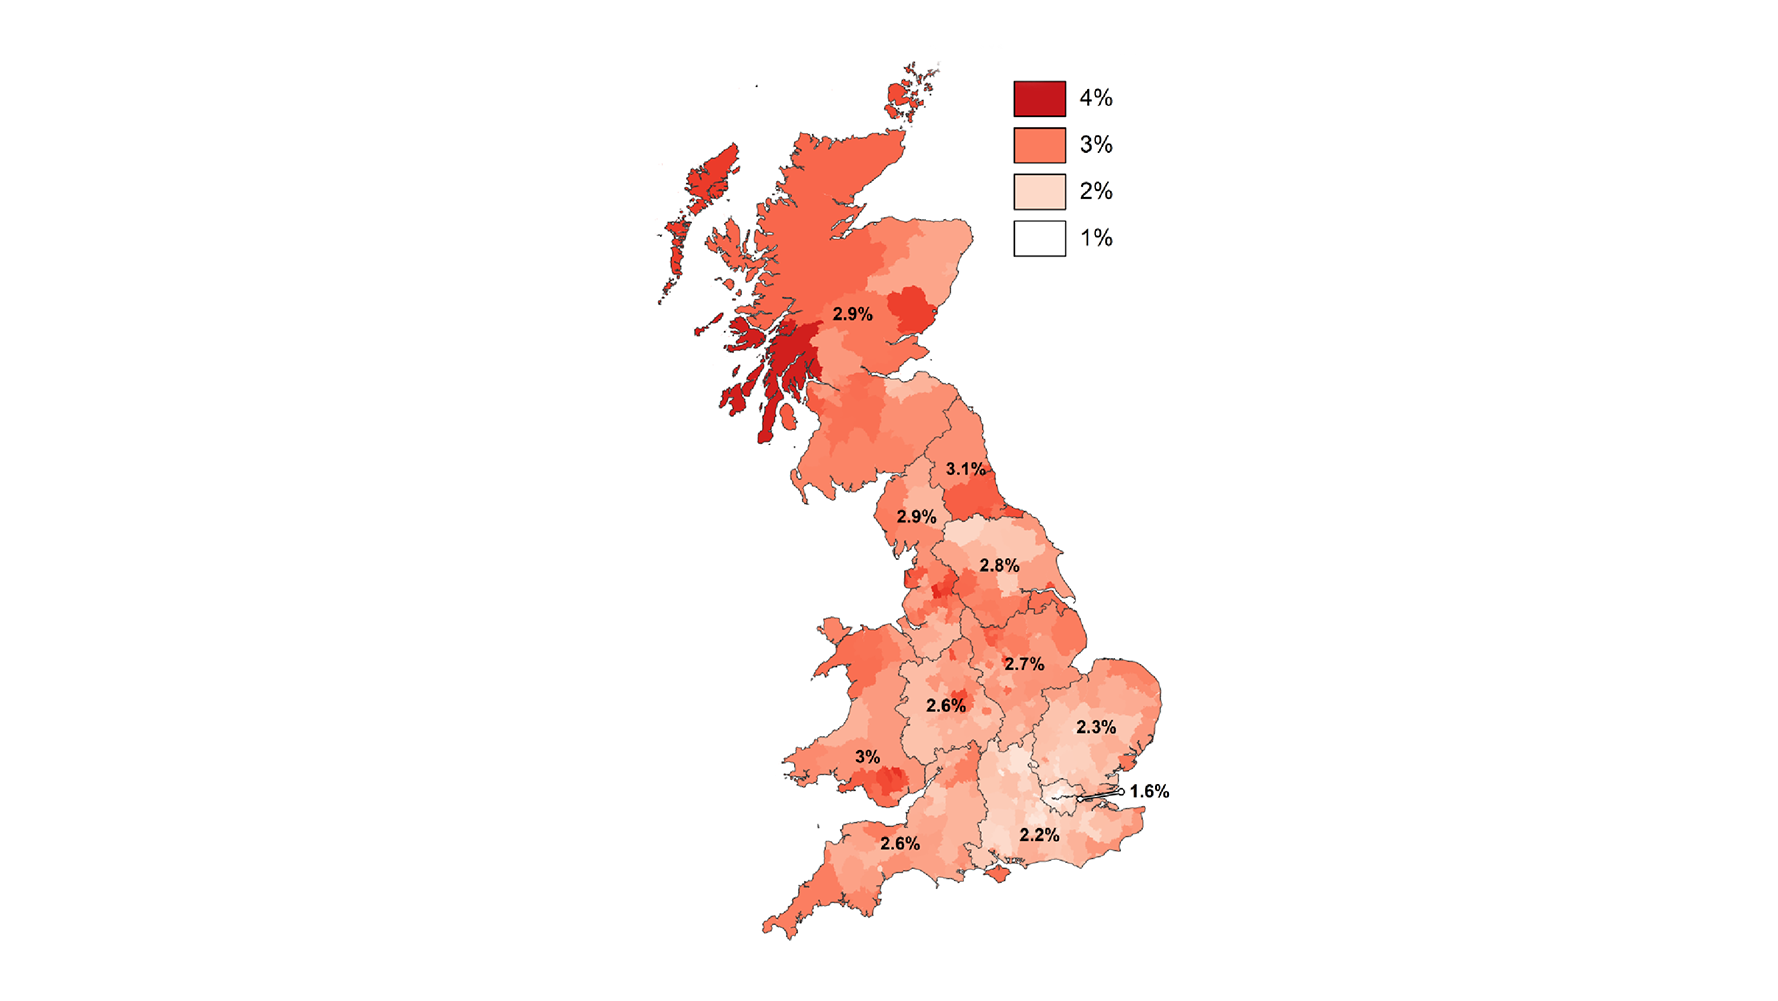 Average household spend on energy
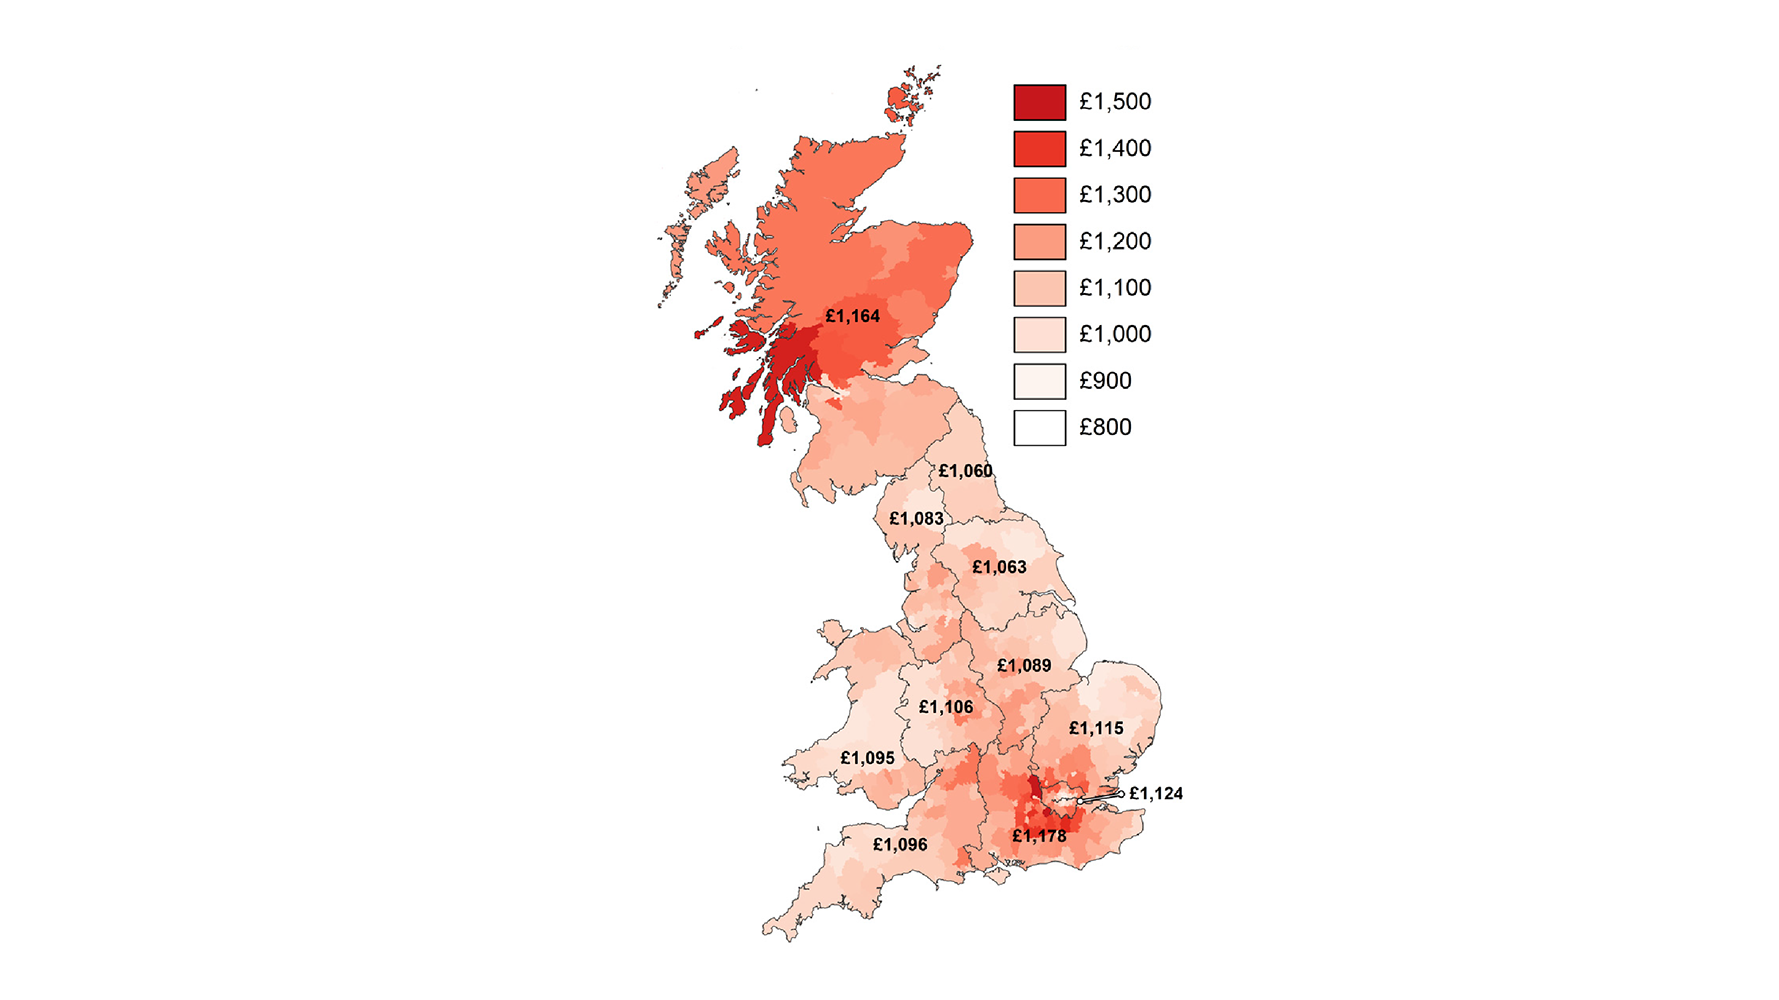 Share of household income spent on energy
Figure 4.8: Average household spend on energy by region and local authority.
The Highlands and the particularly the West coast of Scotland are high energy spend regions, which correlates with a high level of off-gas grid homes using electric and lower average temperatures.
The share of income spent on energy increases outside of London, the South East and East regions (Figure 4.8). The higher income regions spend a smaller proportion of their income on energy as the difference in energy spend between regions is small but the difference in household income is much larger. Generally, the energy spend as a share of income is higher in Scotland than it is for England and Wales.
4.3.2 Changes in household energy costs
To see what the implications of further energy transformations in buildings could look like, a future with high low-carbon heating uptake was modelled. It was assumed that all ‘standard’ on-gas grid homes use gas boilers and all ‘standard’ off-gas grid homes, that are not electric or biomass already, use oil boilers. There is also a carbon price incorporated in the future heating costs. The results show that low-carbon options can be cheaper for off-gas grid homes compared to those on gas-grid (Figure 4.9).
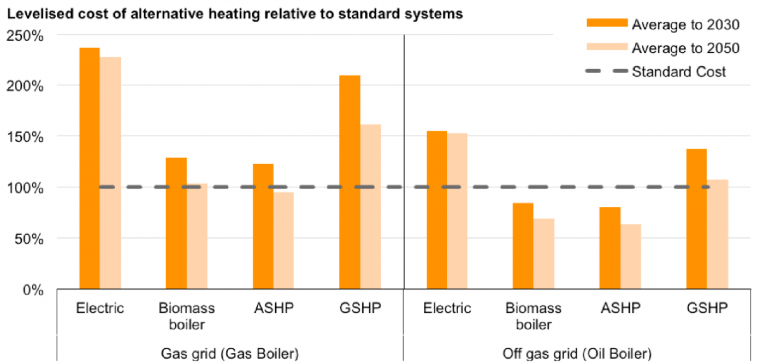
Figure 4.9: The levelised cost of alternative heating systems in 2030 and 2050 relative to gas boilers (left) and oil boilers (right).
A change in average energy spend per home by region to 2030 is shown in Figure 4.10 for each of the selected new low-carbon technologies. Further explanation of the calculation and assumptions is detailed in Appendix 3.
In general, a full-switch to a low-carbon technology could significantly increase energy spend, even with the carbon pricing included in these cost estimates (Figure 4.10). This increase ranges from 20% for ASHP and biomass technologies to over 70% (and potentially) 100% for GSHP and conventional electric technologies.
Overall, ASHP is the cheapest low-carbon option for all regions under these parameters. Biomass is more expensive but competitiveness and costs may vary regionally. These costs assume that there are no efficiency upgrades, keeping the heat demand constant. However, the additional cost of running electric or other alternative heating technologies would benefit from energy efficiency upgrades to homes.
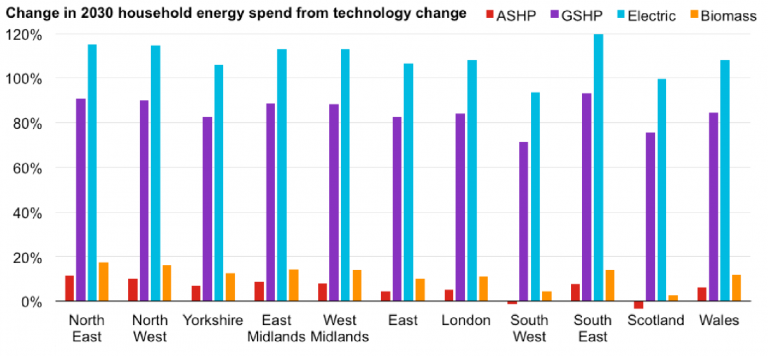
Figure 4.10: Average change in household energy spend from installing new low-carbon technologies. 0% implies no change when moving from a gas boiler. ASHP = Air Source Heat Pump. GSHP = Ground Source Heat Pump.
Large-scale electrification of gas and oil heating using ASHP could produce regionally winners and losers, with Scotland and the South
West reducing their energy spend by switching.
With a focus on ASHP as the cheapest option, Figure 4.11 visualises how the energy spend will change by region as the system is transformed through removing natural gas and oil heating completely, applying carbon pricing and electrifying through ASHP.
This gives an indicative view of how energy spend will change through technology changes. Scotland and South West look to benefit from the assumed switching, with regions in the north of England being worse off. This is mainly due to the current level of spend on energy, with northern and midland regions of England having strong gas-grid connection, providing a cheap heating option; the switch to ASHP for these regions makes it more expensive. In Scotland and the South West, there are currently a lot of off-gas grid homes utilising oil boilers. The switch to ASHP in these regions results in cheaper energy bills, when considering carbon pricing up to 2030.
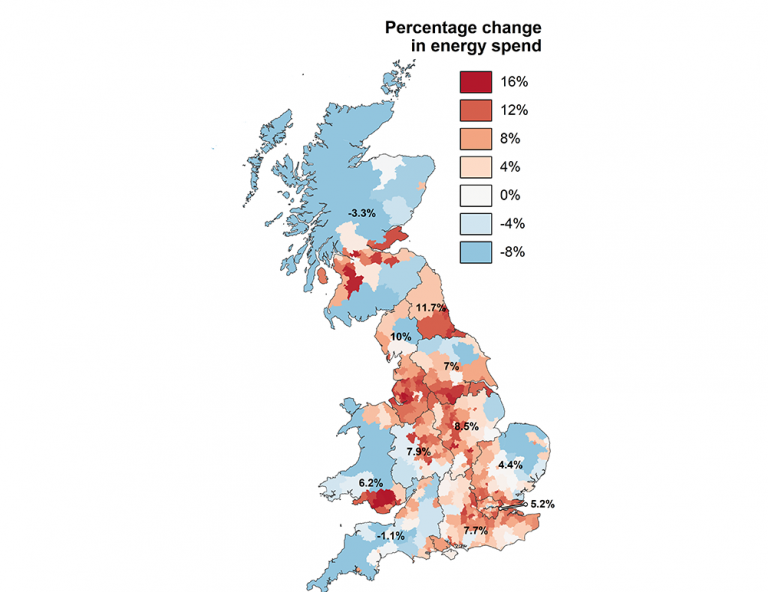
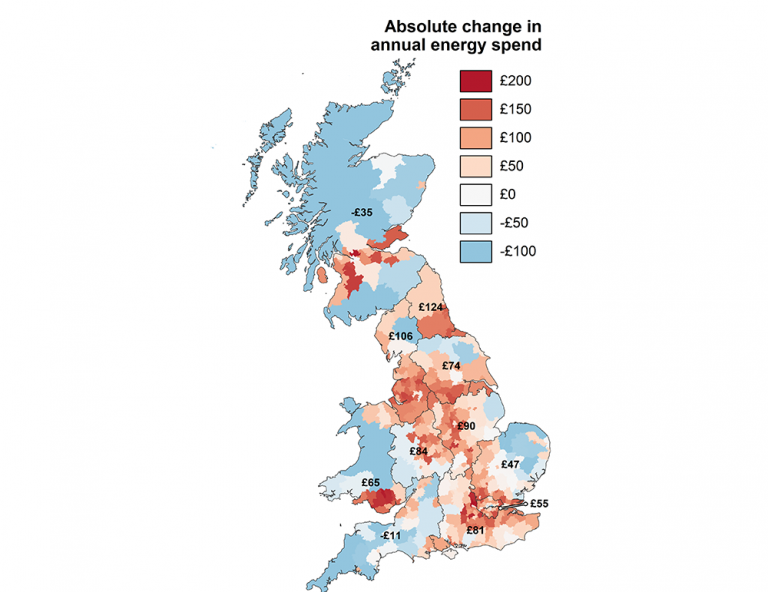
Figure 4.11: Change in energy spend by region.
4.4 Current status and future targets for non-domestic buildings
4.4.1 Non-domestic GHG emissions
Non-domestic buildings are behind on the reductions needed to be on-track for the 2030 target. The high level of electrification (see Section 1.3) in non-domestic buildings means that direct emissions are relatively low compared to domestic and other sectors.
The reduction of direct non-domestic buildings emissions is not on-track to meet 2030 targets.
Apart from the GHG reduction target, very few targets exist for non-domestic buildings. This further reflects the relatively slow progress towards emissions reductions in the non-domestic building sector.
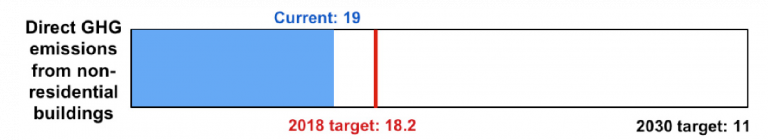
Figure 4.12: Barometer for direct GHG emissions in Non-domestic buildings.
4.4.2 Energy usage in non-domestic buildings
The current status of energy supply to non-domestic buildings can be seen by using electricity and gas meters as a proxy (Figure 4.13).
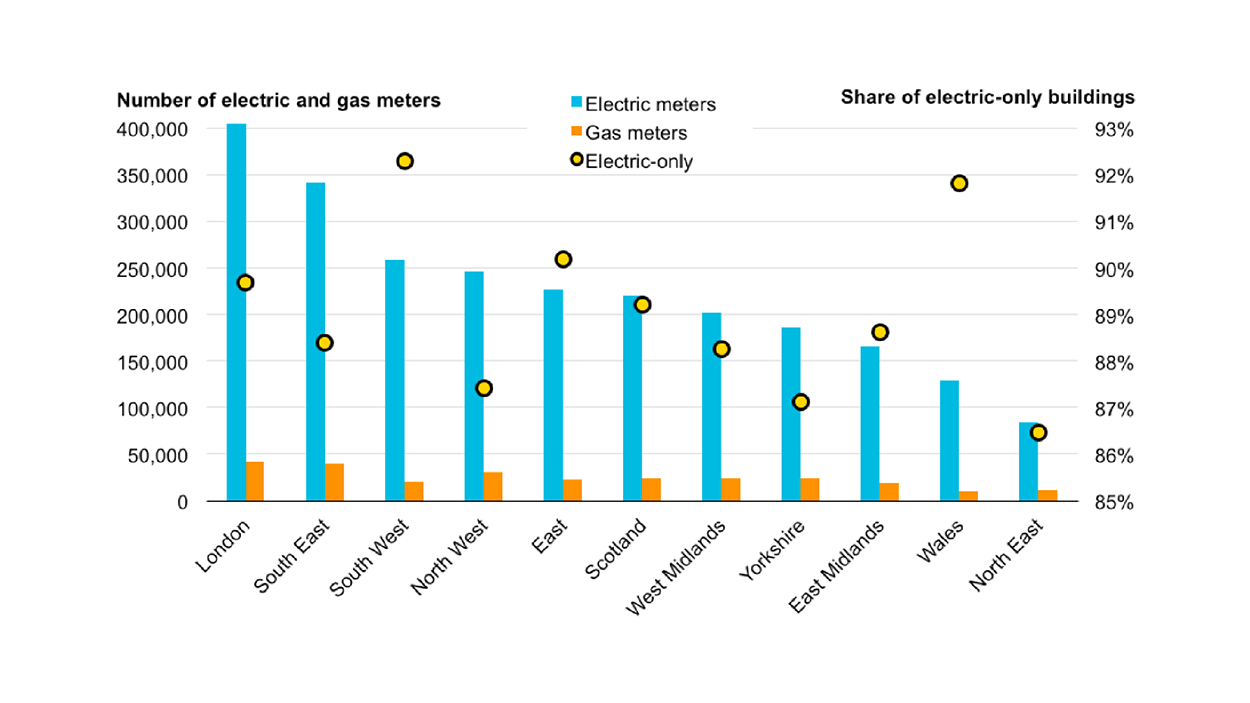
Figure 4.13: The number of non-domestic electric and gas meters in each region with the share of solely electric properties.
Non-domestic buildings in South England, Scotland and Wales are more highly electrified than the northern regions, meaning the latter’s commercial and public sectors are more susceptible to changes in electricity prices. Further electrification of this sector would result in direct emissions reductions, however, this would only result in overall emission reductions if the power sector carbon intensity targets are reached. The cost of this electricity depends on the technologies in the grid mix and the supply-demand balance of electricity. Possible rises in electricity costs in the future leave the highly electrified regions more open to cost increases. However, if strong carbon pricing is implemented the same could happen to the regions with low-electrification.
There is a large proportion of solely electric non-domestic buildings, especially in London, the South East and the North West.
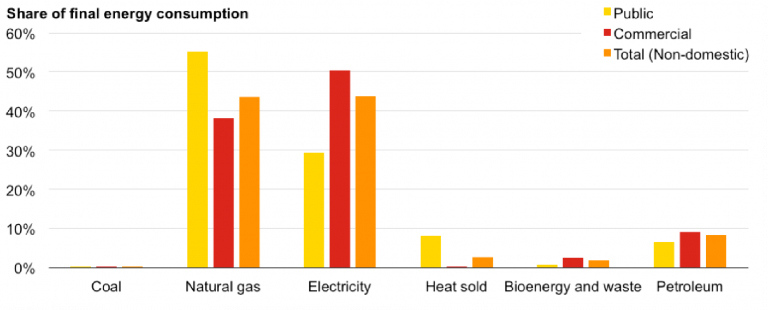
Figure 4.14: Final energy consumption in 2016 of Public, Commercial sub-sectors and the total non-domestic sector, as a % of total energy consumption by (sub-)sector.
There are large proportions of non-domestic buildings without gas meters. However, public (yellow) and commercial (red) buildings used as much electricity as natural gas in 2016 (43.8% and 43.4% share of primary energy consumption, respectively). This shows that those buildings with access to gas have high gas consumption. Public buildings used more gas than electricity; the opposite is seen in commercial buildings. It is assumed that public buildings are in general older buildings with lower heating efficiencies that are more likely to be connected to the gas grid, therefore require high gas demands. Commercial buildings are more likely to use air conditioning and electric heating units to satisfy their heating demands. The average for the non-domestic sector (orange) varies by application and is always between the public and commercial share.

4.4.3 Non-domestic energy efficiency
As with domestic buildings, energy efficiency is a key part of impacting the economic and climate performance of the non-domestic sub-sector, together with the type of energy and technologies supplying energy services to buildings that were discussed above. Currently, 36% of non-domestic properties have EPC ratings of at least a C. There are no targets or modelling that exist for non-domestic energy efficiency ratings. So, it is assumed that the energy efficiency ratings of non-domestic buildings need to reach the same target by 2030, and at the same rate, as domestic energy efficiency (Figure 4.15). This results in the non-domestic energy efficiency target being not on-track to reach 2030 targets.

Figure 4.15: Barometer for energy efficiency in non-domestic buildings.
4.5 Implications for business costs and competitiveness
The characteristics of the regions’ commercial composition and the energy system can have implications on the competitiveness of businesses in the region due to commercial and public sector costs. Spend on energy as a proportion of the region’s Gross Value Added (GVA) was calculated (Figure 4.16). All commercial and public activities were included in the GVA.
The southern regions spend a less on energy per economic output than northern regions. London spends the least and Wales spends the most.
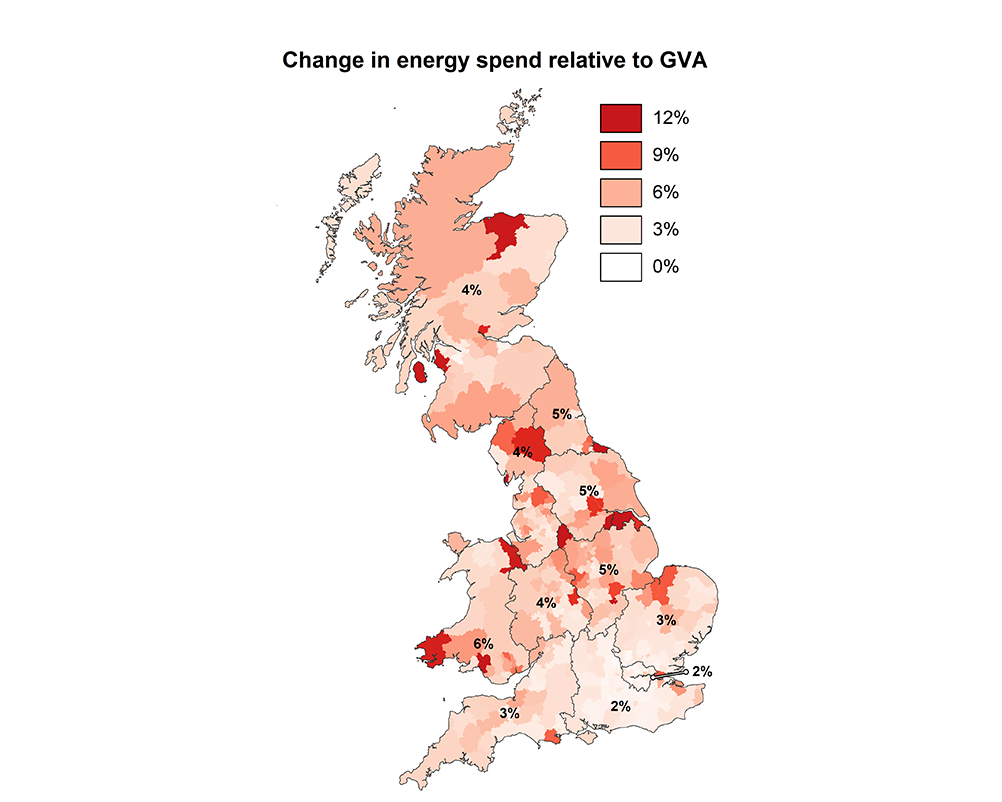
Figure 4.16: Change from national average of energy spend as a proportion of commercial GVA.
In general, the northern regions of England and Wales spend more on energy per economic output compared to Scotland and the southern regions of England. London has the lowest energy spend per GVA in Britain. Business sectors, such as financial services, tend to have very high GVA outputs with low energy spend requirements in office buildings. Conversely, non-metropolitan regions tend to have less of these high-yield, low-energy spend business sectors. For example, energy spend per GVA in Wales is significantly higher than the rest of Britain and is due to low GVA from its commercial and public sectors, as well as relatively high energy spend. Comparatively, the North East has the smallest commercial and public GVA but a lower energy spend than Wales.
These high-energy, low-output regions will be more susceptible to changes in energy cost, with profit margins of the non-domestic commercial building occupants, potentially greatly affected. The region that are most at risk are the northern regions of England, the Midlands and Wales. The future cost of energy for non-domestic buildings depends on the level of electrification and the effect of transformations in the power sector and other consuming sectors on electricity prices as well as the prices of other fuels. Increases in the energy efficiency of non-domestic buildings and the installation of more efficient technologies could see a decrease in the energy spend in these properties, bringing economic benefit to the commercial and public entities that use them.
Chapter 5:
Energy in industry
5.1 Overview
Industry is a difficult sector to transform, as there are many economic and technological barriers and there are no robust targets for the industrial sector’s energy transition, beyond GHG reduction. As a whole, British industry has decoupled its economic growth from the emission of GHGs, currently placing it on track to reach climate targets.
Absolute electricity use in industry has stayed constant, while its share has increased, as processes have been electrified and efficiency increases have been implemented. The top 10 energy consuming industries have varying degrees of electrification. At this point, many processes have been optimised for cost. It is theoretically possible to increase electrification but this will increase energy costs significantly. This would make British industry uncompetitive unless carbon pricing revenue is recouped.
North West, Midlands and South East are most at risk to losing jobs because of automation as these are the most industrialised areas in the country. Over 500,000 jobs are at risk in manufacturing, mining and quarrying, water and waste (see section 5.3.2), which would have significant impacts on the energy demand of the industrial sector.
5.2 Current Status
The energy transition in the industrial sector is generally more complex than in other sectors. Some industrial processes are very energy intensive, especially those that use high temperatures, so their decarbonisation is difficult because electric power does not always make economic sense for these applications.
Britain has also seen much of its energy-intensive industry dwindle, moving to other countries where energy is cheaper. Final products are increasingly imported, with a risk of ‘carbon leakage’ which is not considered in this report.
Industry is difficult to transform, as there are many economic and technological barriers.
The transition in industry is very much economics-led, with the variety of industrial processes, business structures and international competition making it difficult to prescribe targets and blanket regulation. There are far fewer targets that can be formed into metrics when compared with the power, transport and buildings sectors. As 35% of the industrial sector’s energy corresponds to a third of total electricity produced, a substantial increase in electrification could have a large effect on overall electricity demand, affecting the electricity market. There are trends that are driving electrification for industry, such as automation and pressure from climate targets to reduce emissions. However, there are also other transformations industry can make to reduce its direct emissions, such as the implementation of carbon capture use and storage (CCUS). Therefore, the industrial sector has huge potential for change although the exact direction is still yet to be seen.
5.2.1 Industrial sector emissions and energy use
GHG emissions in industry have approximately halved since 1990 (Figure 5.1). The mining of coal and lignite, petrochemical manufacturing and waste services have significantly reduced their emissions, although this is mainly caused by decreases in industrial activity in these sectors.
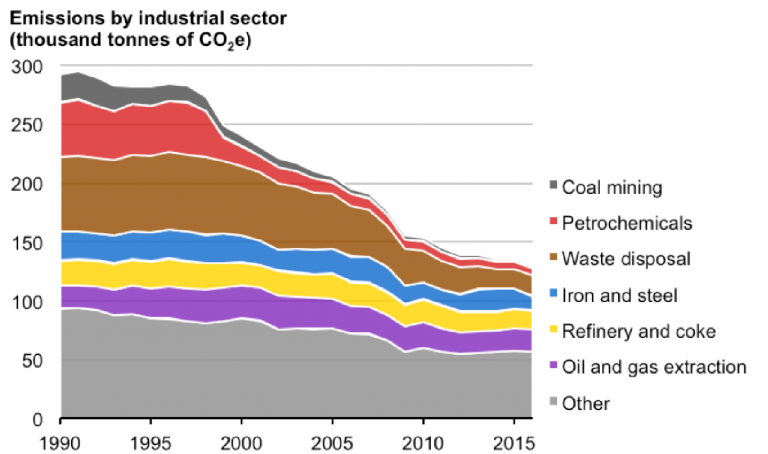
Figure 5.1: GHG emissions from industry 1990-2016.
Greenhouse gas emissions are decoupled from economic growth in Britain’s industrial sector.
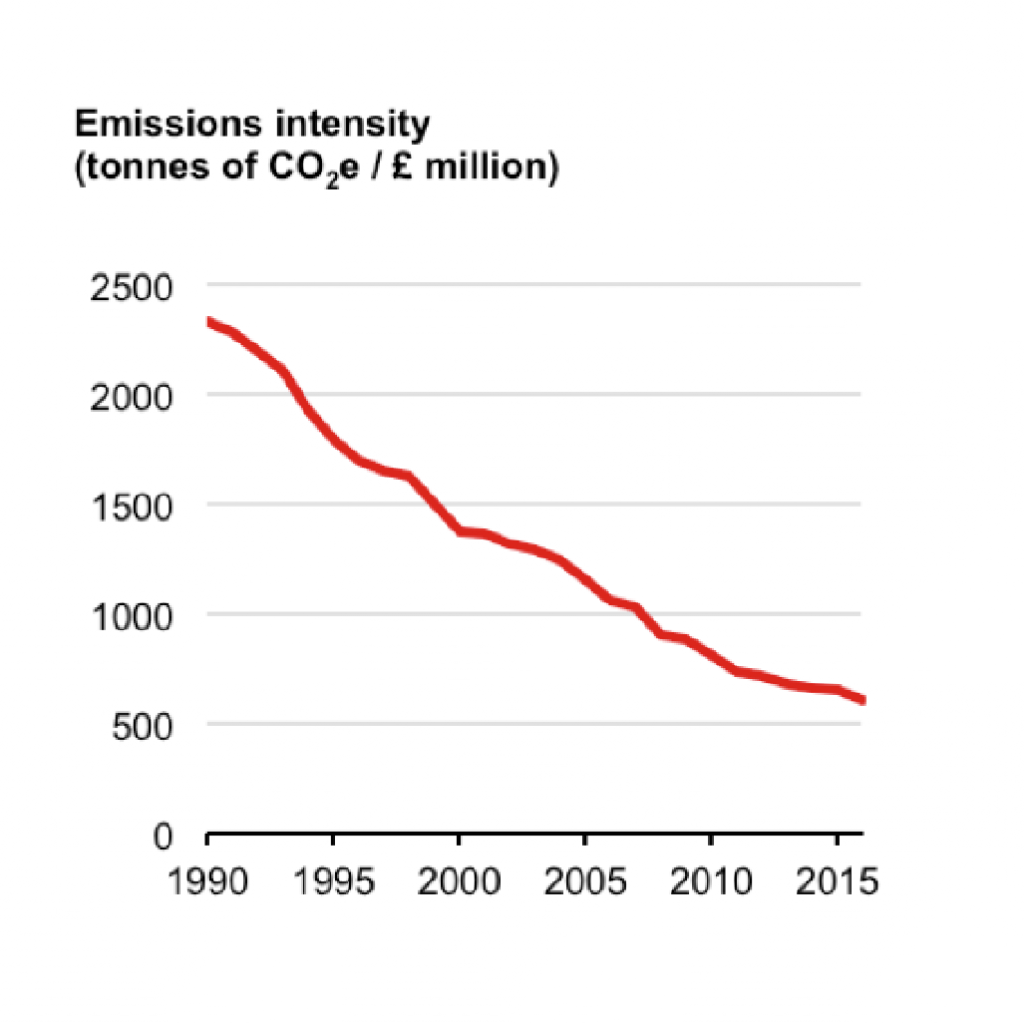
Figure 5.2: GHG emissions per Gross Value Added.
While economic output in industry has been increasing since 1990, greenhouse gas emissions linked to industry have been decreasing. Industrial emissions intensity normalised by gross value added (GVA), has decreased since 1990 (Figure 5.2) – a decoupling of growth and emissions. It is likely that a portion of the decrease in emissions was linked to the greening of energy use, as energy consumption remained relatively stable until 2006, while emissions decreased during that time. The subsequent emissions decrease is likely due to an interplay of less carbon intensive energy use and increased energy efficiency. However, despite economic growth from 1990, changes to the carbon intensity are also due to the changing composition of industry, with British moving away from some more carbon intensive sectors (such as steelmaking) to less carbon intensive ones.
Industry has seen substantial decreases in GHG emissions and is on-track to reach 2030 targets. This has been achieved by a mixture of emission reductions measures as well as the relocation of industry to other countries.
The CCC Fifth Carbon Budget provides a 2030 target for industrial emissions at 80 MtCO2e of direct emissions per year. When using CCC data to form a 2017 target, British industry is ahead of schedule in abating direct emissions (Figure 5.3). However, this target does not consider the emissions associated with electricity usage. Therefore, if industry is switching its energy consumption from fuels such as coal, oil or natural gas to electricity, the process is essentially considered to be emissions free. It is possible to then say that some of the emissions decrease can be linked to fuel switching to electricity.
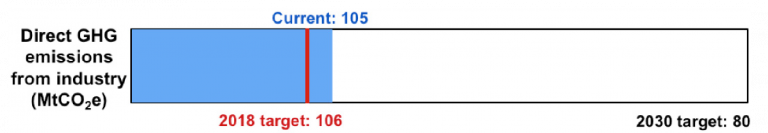
Figure 5.3: Barometer of industrial GHG emissions showing progression towards 2030 target.
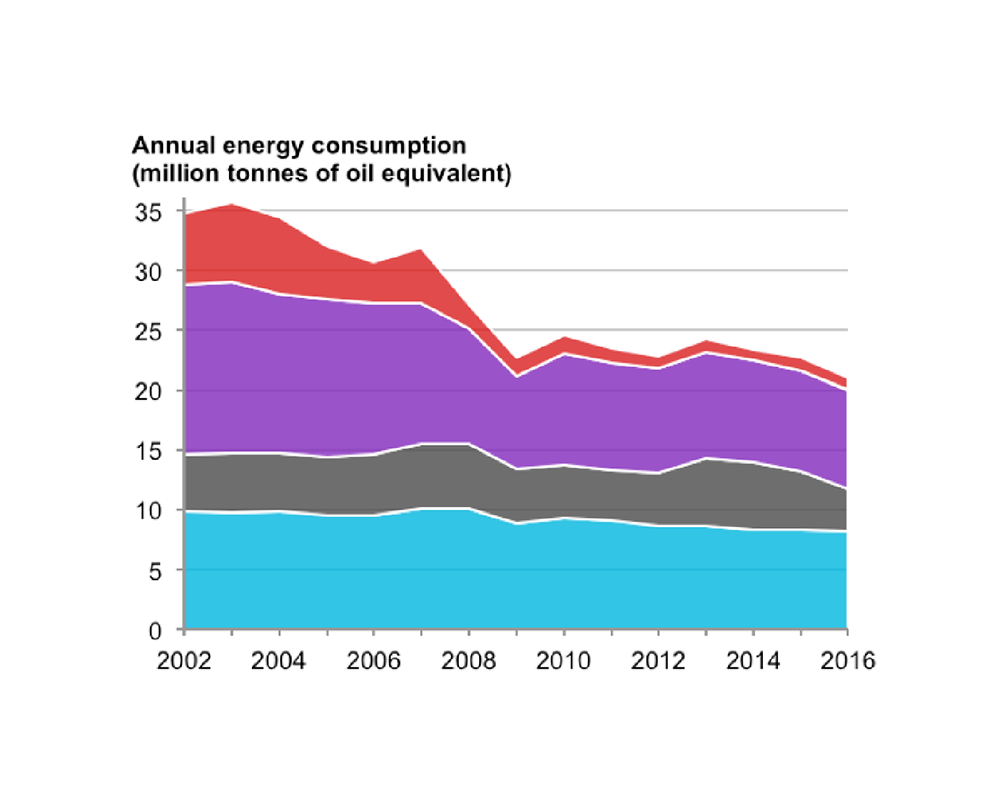
Figure 5.4: Consumption by fuel type for industrial sector 2002-2016.
In 2017, the industrial sector emitted 105 MtCO2e, down from 117 MtCO2e in 2008. Figure 5.4 illustrates that there has not been an absolute increase of electricity use in industry, which has remained fairly constant since 2002. The complexity of industrial change means that electrification of industries may be taking place without it reflecting in an increase in overall electricity consumption. Any efficiency increases could also be masking an increase in electrification of industry; the high-level data available cannot resolve these factors.
Whilst there has been a reduction in solid fuel use in most other sectors, industry still relies upon it for a significant proportion of its energy consumption, with solid fuel’s absolute energy consumption staying relatively constant since 2002. Total energy consumption reduced around the financial crash and has never recovered, signalling that this either caused a transition in industrial processes or some of – the mainly natural gas and oil consuming – industries have closed down.
5.2.2 The top 10 consuming industries
The top ten energy consuming industries have a large variety in the percentage of electricity usage (Figure 5.5). Each industry will have a theoretical maximum electrification potential, due to technological barriers as well as system integration barriers (whereby a certain process may depend on another process using a certain fuel).
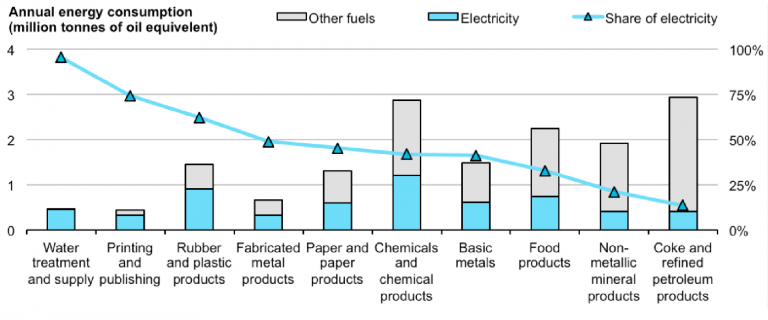
Figure 5.5: Consumption of top 10 industrial consuming sub-sectors and their penetration of electrification.
The manufacture of coke and petroleum products and non-metallic mineral products have the lowest electrification. Some further electrification in these sub-sectors, if technologically feasible, could help to reduce industrial emissions as these are high consuming sectors. Similarly, chemical and food production electrification would also be beneficial. Water services are almost completely electrified already, this is due to the processes relying mainly on electric pumps.
Some of the highest energy consuming industrial sub-sectors have low electricity consumption, showing that if further electrification could be applied it would yield large carbon reductions.
5.2.3 Industry by region
There is regional variation in the number of industrial companies in Britain, with the North East and Wales having the fewest companies (Figure 5.6), whereas, the highest number are in the South East, West Midlands and the North West.
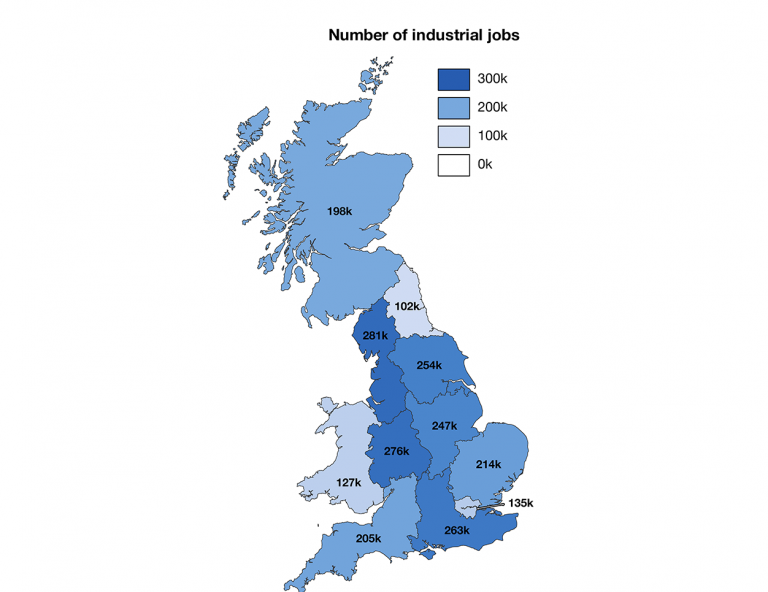
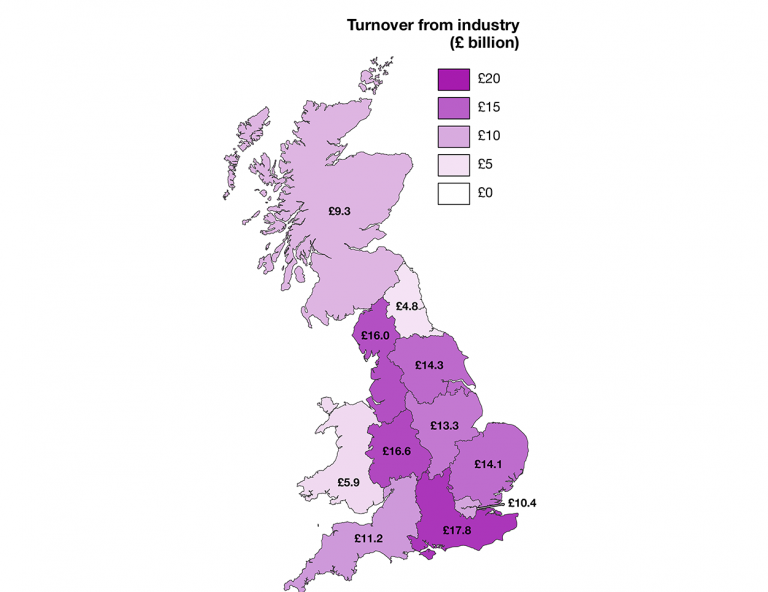

Figure 5.6: Number of industrial jobs, total turnover from industry and number of industrial companies in each GB region.
In general, the number of companies and the amount of turnover is linked, although some regions perform better than others. The northern regions of England (except the North East) are much more industrialised than the southern regions. The South East is the only southern region that is above the national average on all three metrics. Wales and Scotland are both below the national averages, although there is a high number of jobs in Scotland compared to the number of companies and turnover. Therefore, changes in industry such as automation or continued changes to industrial composition to reduce emissions would affect the northern regions of England most strongly.
Fluctuations in energy prices for industry could also strongly influence the economies of these regions. Significant fluctuations may become more common as the energy system continues in its transformation.
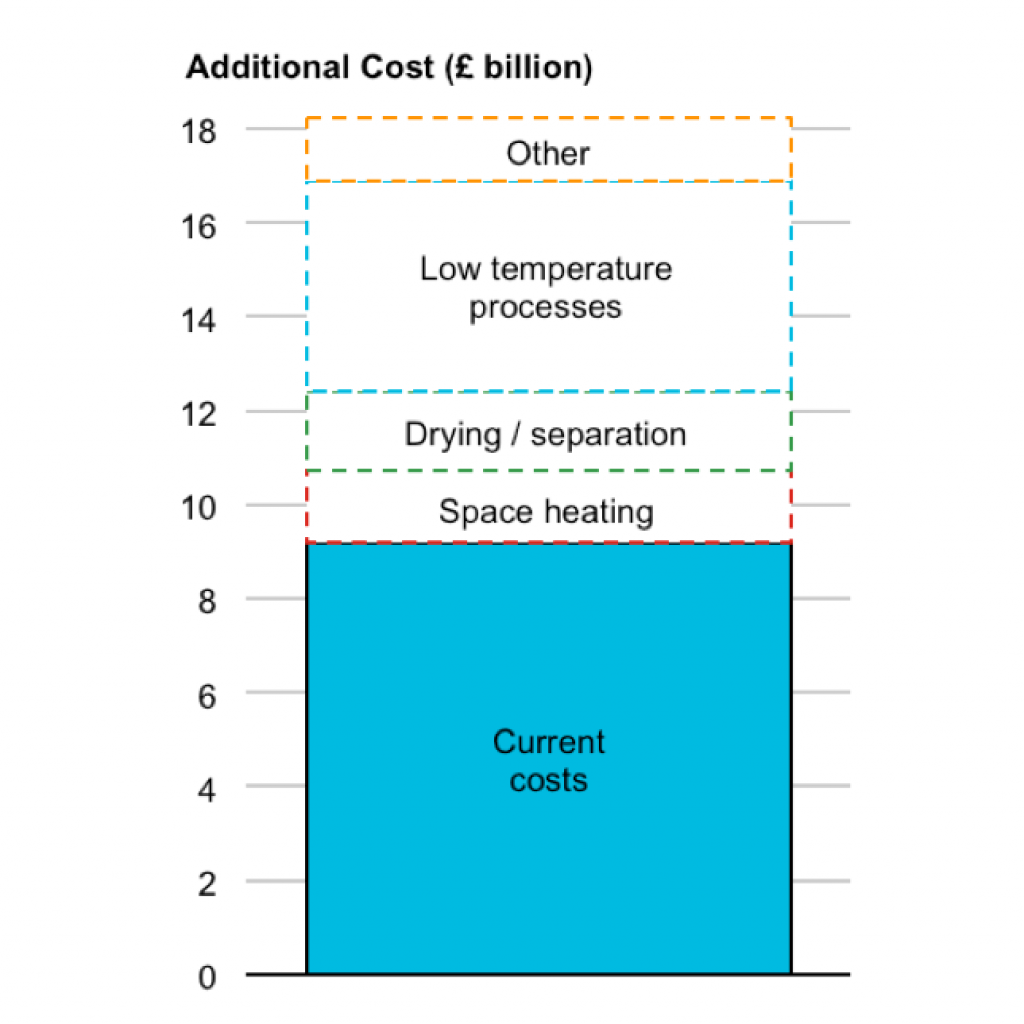
Figure 5.7: Additional cost of fully electrifying industrial processes.
5.3 Implications of a transitioning industrial sector
5.3.1 Changes in energy cost from increased electrification of industry
There are some processes that could theoretically be electrified such as space heating or drying. The potential cost to industry if fuel consumption for certain end-use applications were moved from fossil-based fuels to electricity is presented in Figure 5.7. This assumes that 1 kWh of electricity can provide the same thermal service as 1 kWh of coal, natural gas or oil. Further, it uses 2018 fuel prices7 to estimate the additional cost of completely electrifying certain end-use applications in industry. The values reflect what the total cost to British industry would be for the industries that collect end-use energy consumption data. This, therefore, does not reflect a complete cost to industry, but does offer an indication.
Any additional capital costs of changing systems to electricity were excluded so the analysis only includes the additional running costs of the end-use application. This analysis also ignores potential system interplays, whereby certain processes may provide inputs to other process (e.g. through steam production). Therefore, electrifying one end-use application may require greater fuel consumption downstream as the residual energy may no longer be present. The results are shown in Figure 5.7.
Transforming industrial process could significantly increase energy costs for industry. Support through carbon pricing revenues, for example, could help to reduce these additional costs.
The processes for electrification are ranked in order of assumed ease of electrification, with space heating being the easiest and low-temperature processes being the most difficult (of the processes considered in Figure 5.7). If space heating, drying/separation, low temperature processes and other end-use applications in industry are electrified, the annual energy cost approximately doubles compared to current costs. This is linked to low fossil fuel costs compared
to higher electricity costs. However, if carbon prices are to increase this could reduce the additional running costs of an electrified system, if the revenue is used to offset the electricity costs.
5.3.2 Automation
The trend of automation in industry is a highly debated topic. Increased automation will have varying regional impacts, depending on the relative dependence on high risk industries. For example, PwC suggests that up to 46% of manufacturing jobs are at high risk being automated, as are 23% of jobs in mining and quarrying, and 63% in waste and water. Figure 5.8 shows the number of industrial jobs in these sectors at risk from automation by region.
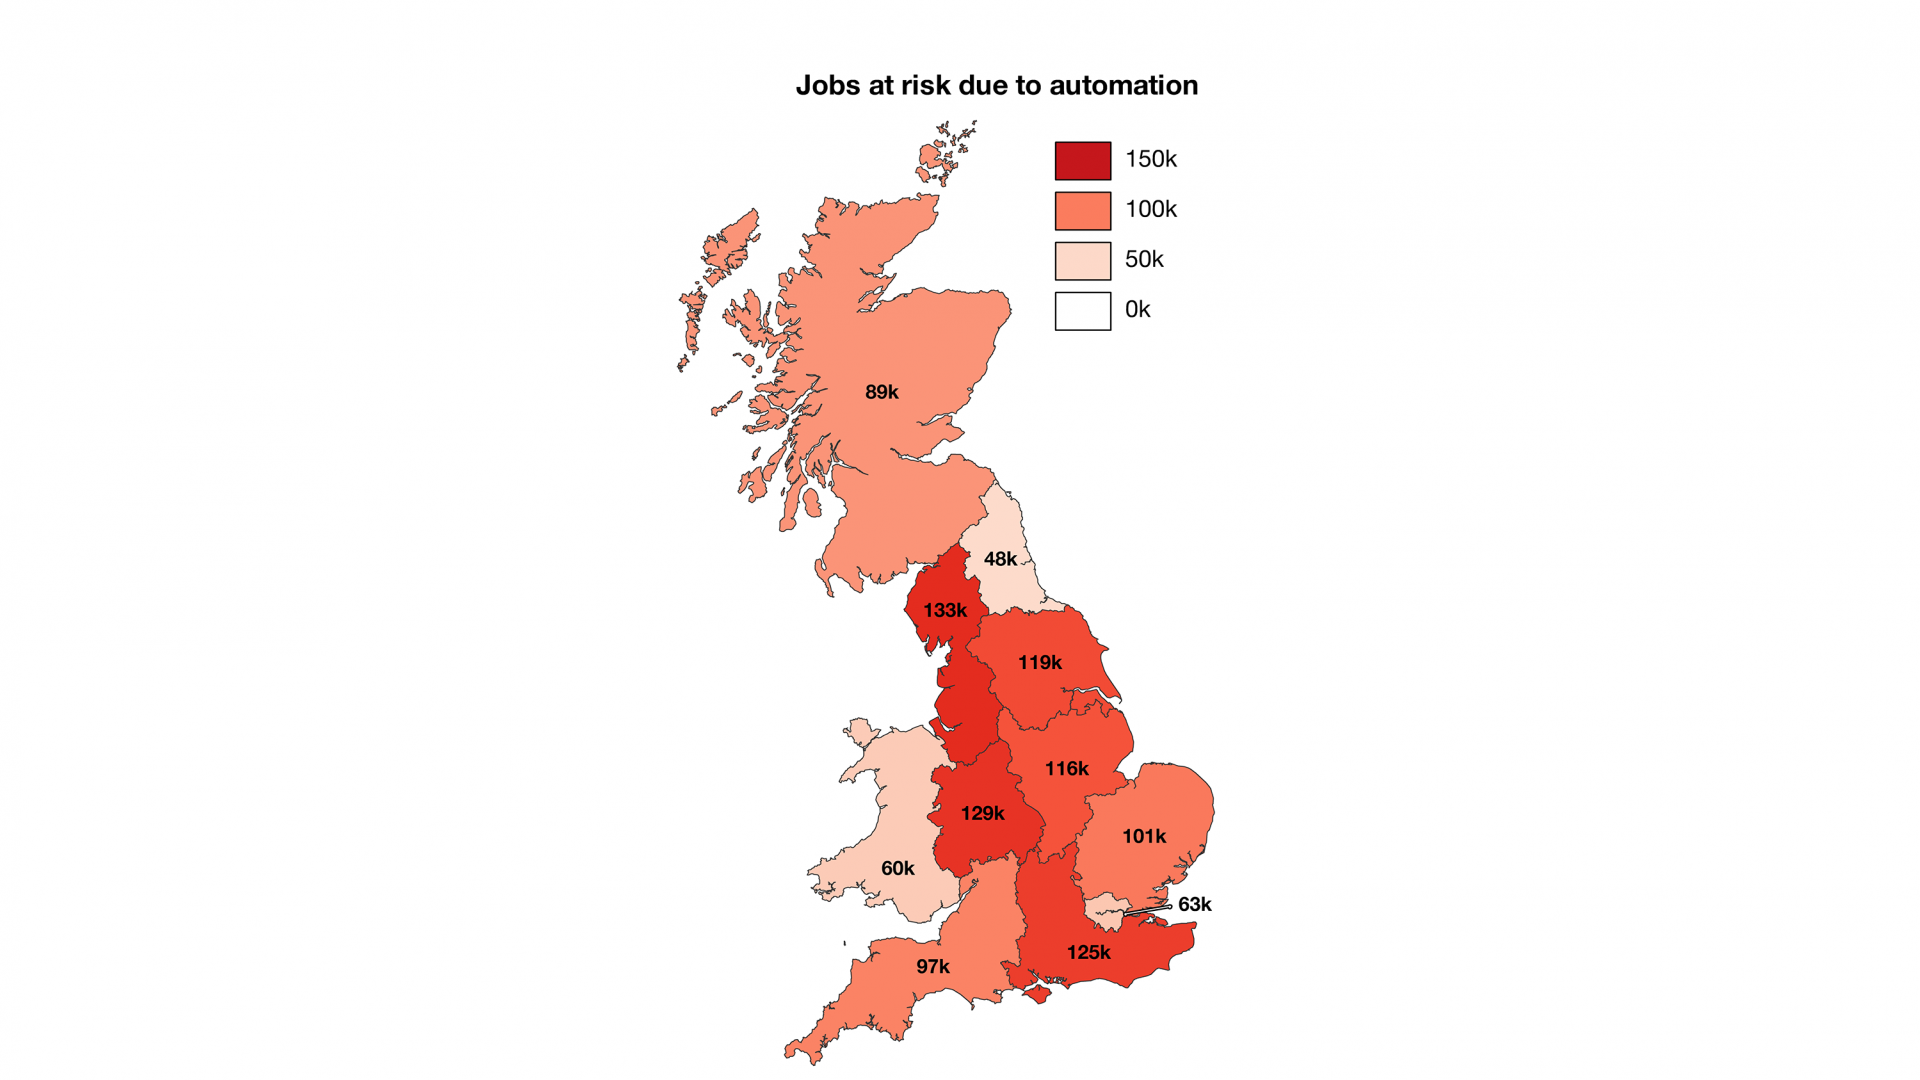
Automation could aid decarbonisation but may cost hundreds of thousands of jobs. The Midlands and northern regions are most at risk.
The North West, South East and Midlands are at the greatest risk of losing jobs to automation due to the prevalence of manufacturing, water and waste management. London, the North East and Wales are the least industrialised regions and therefore the potential for automation removing industrial jobs will have less of an impact on these regions.
Outside of the socio-economic implications, an increase in industrial automation could result in increased overall energy consumption, as energy is substituted for labour. However, automation is largely linked to electrification so the carbon intensity of the power sector will determine the GHG emissions from these automated processes. Whether this increases or decreases direct emissions from industry depends on what the process emissions were before automation.
Chapter 6:
Regional implications
The regional barometers in each section of this report have shown the status of Britain’s regions in transforming and future-proofing their energy systems. These results have been summarised for each region in Figure 6.1. The same methodology is used for the regions as is used for each sector: counting the number of metrics which are pushing ahead, within 90% of the target, or not on track. The following sections summarise the progress and impacts of transforming each region’s energy system.
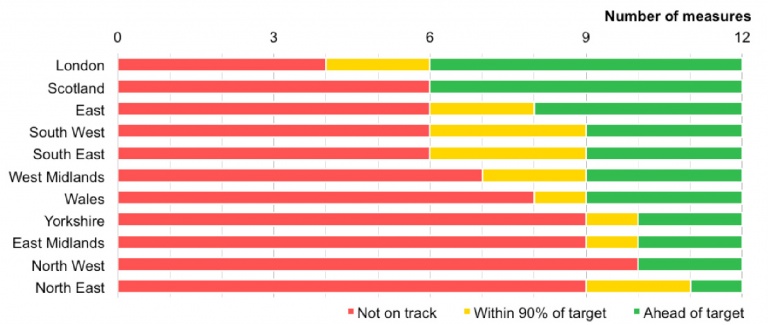
Figure 6.1: Overall indicator for how transformed the energy system is in Britain’s regions.
The sections below are ordered based on the ranking of how well each region is progressing. The data required to build a regional indication of the industrial sector was not available, thus industry is excluded from this chapter. This does not mean there are not specific regional impacts that come from transforming the energy supplied to Britain’s industry, for example the vehicle manufacturing in the West Midlands or the energy intensive industry in Tees Valley.
In Sections 3 and 4, this report calculates the total cost of ownership of modern electric vehicle and heating technologies, and the gap between them and their conventional counterparts. Figure 6.2 combines these to give the total additional cost a household in each region could expect to face for electrifying their heating and upgrading to an electric vehicle.
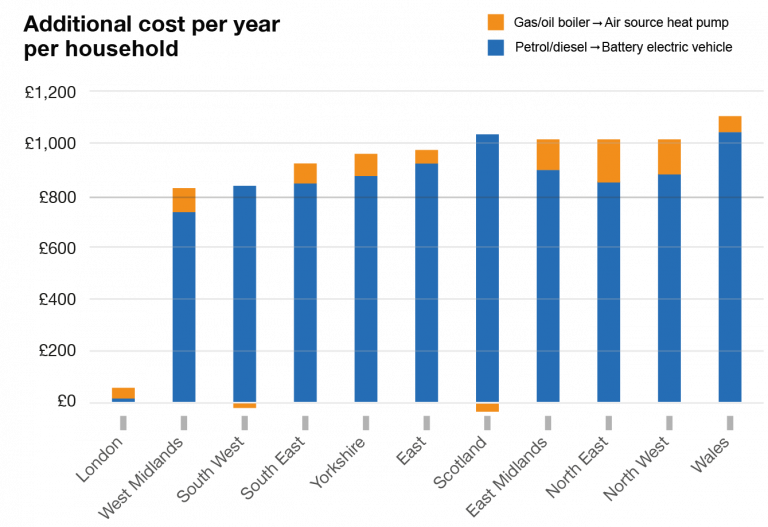
Figure 6.2: The annual additional cost of electrifying heat and transport in each region, measured as the total cost of ownership (TCO) gap between electric and conventional technologies. For heating, the cost is based on conversion from gas boilers where possible, and from oil boilers in homes off the gas grid. For vehicles, the cost is based on conversion from the regional share of petrol and diesel vehicles.
London stands apart from other regions because the unique characteristics of its transport networks (the Congestion Charge, and people driving fewer miles per year) mean the lifetime cost of owning an electric vehicle is on par with petrol already. In all other regions, there is still an appreciable cost barrier to uptake of electric vehicles.
Outside of London, there is a 30% spread in the cost gap, which ranges from an extra £840 per year in the West Midlands up to £1,100 per year in Wales. The regions which face smaller additional costs from electrification are generally those in the top half of the progress league table (Figure 6.1), and those with the highest costs are generally falling behind. This shows that the individual regional characteristics, especially socio-economic factors, are critical to the fair and equitable transformation of Britain’s energy system.

6.1 London
London has progressed the most of all Britain’s regions in terms of energy transition. A strong driver in the region is the electrification of transport. London’s power system is characterised by having no large generators. The urbanised nature allows for solar photovoltaics, although uptake is low at present.

As London does not expect growth in generation capacity, the power grid does not need to be expanded at regional borders, but reinforcement may well be necessary on lower voltage levels within the region to account for electric vehicles. Overall the region is driven and characterised by its energy consumption and not generation.
London has relatively high EPC ratings, although not as high as Scotland and the East, and has the lowest levels of F and G ratings. London is midrange in terms of fuel poverty, but high when compared to surrounding regions. This is most likely due to the demographic and socioeconomic structure of the southern regions. The housing structure has a higher electric heating rate than the rest of the country, due to the high proportion of electric heating for off-gas grid homes. Despite this, there are very few low-carbon heating installations in London.
With the transport sector, London shows the greatest decrease in absolute and relative emissions. This is likely related to efficiency gains in public transport, increases in active travel and decreases in road kilometres driven. In London, where public transport, walking and cycling make up a greater share of the modal split, the emissions per person from transport is about 1 tonne of CO2e per year. In every other region, commuting by private car dominates, and so residents emit 1.5 to 2.5 times that of Londoners.
London has the highest number of electric charging points. Hydrogen refuelling stations are even more strongly clustered within London; fewer than half of the stations are outside the capital. The region has the greatest number of ultra-low emission buses as TfL’s commitment to electric and hybrid buses has led to rapid uptake. Air quality issues are one of the main drivers of this development. London has seen the greatest increase in the number of electric/hydrogen buses, with an over 15-fold increase between 2013 and 2018. Overall, London has the lowest emissions from diesel usage in rail, due to higher rail electrification in the area. London as the only purely-urban region has by far the greatest number of bus stops per square kilometre, allowing for a modal share that is not dominated by private cars. This allows London to transition faster and more effectively, which will reduce travel costs in future.
The average distance driven by each vehicle is substantially lower in London than any other region, thus giving London the lowest total cost of ownership. London’s Congestion Charge – an additional tax – is not applicable to plug-in and hybrid vehicles, giving a substantial incentive for electric vehicles. TfL report that an average vehicle makes 8 trips vehicle per year into the congestion charge zone (assumed in this study); however, if a vehicle were to travel every working day into the zone, this could increase the cost of petrol and diesel cars by up to £3,000 per year, which would further improve the total cost of ownership for plug-in vehicles in comparison. London is the only region in Britain where total cost of ownership for battery-electric vehicles is lower than petrol or diesel. London has a low ratio of number of EVs per available charging point, linked to having a higher proportion of EV chargers and/or a smaller (absolute) number of EVs.
It is clear that railway spend was focused on London, receiving almost 45% of the combined funds from national government, local authorities and private organisations. Further, almost a third of central government railway spend went to London, which alone is greater than the spending from all sources in any of the other regions. Interestingly, spending correlates to the share of electrified network within the regions, putting London, South East, North West and Scotland at the top.
The additional cost of using a heat pump and electric vehicle amounts to ~£60 per year in London. This is mainly driven by the additional cost of in electric heating, as opposed to other regions where the cost increase in driven mostly by the increased BEV costs. London is on the cusp of having modern electric technologies reach cost parity with incumbent fossil fuels. The additional costs in London are substantially lower than in any other region.

6.2 Scotland
The Scottish energy system really stands out from the other regions. It is leading in several areas and acts as an example for the energy transition to come in other regions. Scotland has fully met half of the targets laid out in this report, joint first with London.

Scotland has the highest installed power station capacity, as well as the highest share of renewables of all regions. Onshore wind power dominates the generation mix, as this region offers an exceptionally good wind resource and low population density. The large increase in wind power generation has offset the phase-out of coal and gas, and the future closure of nuclear power. The wind industry enables Scotland to generate new employment and create an alternative for the oil and gas industry. Scotland has the largest number of jobs in renewables of all regions with the potential to continue growing as the transition continues.
However, more recently political uncertainties about the future of onshore wind have arisen, which may stop economic development in that area. Simultaneously, there is considerable uncertainty for potential future nuclear power plants, as these would increase the grid congestion already prevalent in Scotland. The siting of wind turbines at the best wind resource locations does not coincide with pre-existing location of the grid, which was built out many decades ago and not designed to cope with large amounts of wind power. Locally congested electricity from wind power can lead to opportunities for local smart energy solutions and sector coupling of the electricity, transport and industrial sector.
On the buildings side, Scotland has a relatively energy-efficient building stock with the highest proportion of EPC ratings above C. At the same time, a relatively high proportion of households live in fuel poverty: 11.8% using the English low income high cost (LIHC) method. One reason for that might be due to Scotland having the highest proportion of electric heat (12.2%) with Highlands reaching 20–25%. This corresponds to similar proportions of off-gas grid properties in these areas. 55% of Scotland’s off-gas grid homes are electric, the highest proportion in Britain. The average energy spend is second-largest in Scotland (largest in South East), with some areas spending £600 more per year when compared to British average. The average Scot is spending approximately 3% of disposable income on energy. This situation has been identified, and led to the largest deployment of efficient and low-carbon heating (0.52%, or 12,300 units). This aims to address both climate change and fuel poverty issues by increasing efficiency, which makes Scots likely to be better off in the future. However, this strongly depends on the technology the fuel poor homes are changing from and the energy efficiency of the homes. The economic decision to not build a gas grid has affected consumers negatively and raises questions on possible future de-carbonisation using hydrogen. If heating was changed through the installation of air-sourced heat pumps in the on-gas grid homes and off-gas grid homes (that are not already electric or biomass) change in energy spend would decrease by 3.3% in Scotland or £35 by 2030. This is a very small change in proportion of average household income.
In the transport sector Scotland has the second highest number of electric charging points, only London has more electric vehicle charging points. London, Scotland and the South East have more than half of Britain’s charging points between them. At the same time Scotland has a low ratio of EVs per available charging point, linked to having a higher proportion of EV chargers and/or a smaller (absolute) number of EVs. This means Scotland’s infrastructure is ready for greater EV uptake. Scotland is also second to London in the number of electric/hydrogen buses with an almost 6-fold increase between 2013 and 2018 and amongst the leaders in the proportion of Heavy Good Vehicles (HGVs) that are already electrified or using hydrogen. Regardless of vehicle type, the total cost of ownership is highest in Scotland (and Wales), while it is the lowest in London. This may be affecting the EV uptake in the region. Regionally for battery-electric vehicles and Plug-in hybrid electric vehicles, Wales, Scotland and the North East face the greatest financial burden when owning a vehicle.
The additional cost of using a heat pump and electric vehicle equates to ~£990 per year in Scotland. This is driven solely by the additional cost of BEVs compared to fossil fuelled vehicles, as we project a small saving from switching to ASHP in Scotland, related to the high off gas grid housing stock. Compared to other regions, Scotland has the 5th highest additional costs.

6.3 East of England
The east of England is the third most transformed region in Britain. A five-fold increase in grid capacity is needed for transporting electricity from offshore wind farms to load centres inland. The building of offshore wind farms will contribute significantly to the region’s economy, whilst at the same time reducing the overall transmission length by being close to London. The subsequent increase in employment will have a significant impact on the local economy with building of supply chains around the industry.
The EPC ratings are second highest in this part of the country. The same goes for residential fuel poverty rates. The southern regions effect means that electric heating rates are higher than on average. All of these factors mean that the region has an advantageous starting point for the energy transition.
Regionally, the West Midlands and the East of England are leading the EV uptake. At the same time the charging point density is low for the number of vehicles on the road, a consequence of the successful EV roll-out. The current situation indicates that innovation around smart charging could happen here, especially when EVs are combined with the future of offshore wind power for balancing services. This could lead to significant cost saving for this region.
The additional cost of having an ASHP and owning a BEV is equivalent to ~£970 per year in the East of England. As with most regions, this cost is mostly related to the additional cost of BEVs compared to fossil fuelled ones, with ASHP accounting for less than £50 of the total additional costs. As compared to other regions, the East has the 6th highest additional costs.

6.4 South West
The South West is ranked joint fourth when compared to the rest of Britain. However, this part of the country faces particular challenges. The South West is characterised by its weak electrical connection and remoteness, relatively speaking. Grid congestion is already present and hinders the further installation of solar photovoltaics.

The reductions in feed-tariffs for solar PV has affected the region negatively. It is to be expected that this region will be one of the first to restart the solar boom once the technology can support itself ‘subsidy free’ – due to its relatively good solar resource, compared to the rest of the country.
The buildings have a relatively high rate of EPC ratings of C and above but also a substantial share F and G rated buildings (7.4%). It sees higher fuel poverty than other southern regions, although still midrange. This is certainly due to having the highest electric heating rate outside of Scotland and the highest number of off-gas grid properties and the second most low-carbon heating installations.
Whilst the South West has a relatively large number of EV charging points, there has been a small uptake of EVs compared to the other southern regions. This has resulted in a relatively high proportion of chargers relative to EVs. The gap in total cost of ownership for EVs in the South West is similar to that of the other southern regions but its lower average household income could be stopping the deployment of these vehicles. For other low-carbon transport like buses and HGVs, the South West is lagging behind its targets.
The South West is among the regions with the lowest additional costs (3rd lowest) associated with electrification of heating and transport. This amounts to ~£845 per year, which is entirely from the additional cost of BEV ownership. In fact, as with Scotland, there is a benefit to switching heating
to ASHP, which is again related to the high off gas grid household stock.

6.5 South East
The South East of England is ranked joint fourth. The region has faced grid congestion in the past and the installation of almost 2 GW of photovoltaics has exacerbated the situation.
In response, the region has seen the largest storage capacity for new storage (i.e. not pumped-hydro). The storage is used for grid balancing and innovative approaches to load flow management by the local distribution network to alleviate grid congestion. This will benefit consumers, as their bills will be lower than what they could have been without these measures.
The South East has the lowest EPC ratings of the southern regions but it is still relatively high when to compared to the national average. Fuel poverty is lowest in the country despite having more houses off the gas grid the highest energy bills per household in Britain. This is mainly due to socioeconomic factors and milder winters. This should enable consumers and businesses alike to invest in new technologies and exploit the gains in the future.
The South East is amongst the regions with the highest number of EV charging points. It has high car ownership and private transport is the main mode of commuting. Therefore, there is potential to see large emission decreases through a modal shift or continued electrification of private transport. The region leads on the proportion and absolute numbers of HGVs that are already electrified or use hydrogen. The emissions due to diesel usage in rail are highest in the South East despite high electrification of rail and lowest spend per passenger journey. It is suspected that the large volume of journeys are the cause of this.
The South East has projected additional cost of electrifying heating and transport of ~£940 per year, the 4th lowest among Britain’s regions. As with other regions, this is mostly related to the additional cost of BEV ownership, which accounts for ~£860 of the additional yearly cost.

6.6 West Midlands
The West Midlands ranks as the sixth most transformed region, placing it in the middle of Britain’s league table. The power sector in this region is changing most drastically of all regions. It has become a large importer of electricity in recent years due to the retirement of conventional generation and very little uptake of renewable capacity.

This means that the region is decoupled from the economic activity of the energy sector in Britain and has no value creation and jobs from electricity generation. In future this will make the region worse off in terms of electricity generation than it was just a few years ago.
The region is midrange for most buildings’ metrics, for example in EPC ratings, but had the highest fuel poverty rates between 2012 and 2016, despite low electric heating rates. The combination of imported electricity and high fuel poverty rates means that there may be a challenge in the future.
On the upside, the West Midlands is leading with EV penetration at 0.52% of the car fleet. This growth is likely to be linked to the automotive industry that is present in the region and the fact that the total cost of ownership is the lowest in this region when compared to the rest of the Britain, except for London. The uptake of electric vehicles has also led to a higher EV to charging point ratio, suggesting greater competition for charging in the future. In fact, the regions performance on electric vehicles secures its position in the mid-range.
The West Midlands has the 2nd lowest additional cost associated with heating and transport electrification, behind London. The total yearly cost of ~£840 is primarily due to BEV ownership (~£760), while the additional yearly cost of ASHP heating amounts to ~£85.

6.7 Wales
The Welsh power system can be characterised by its large pumped-hydro storage capacity and a number of gas-fired power stations in the south. Wales has by far the highest rate of smart meter roll-out of all regions. This will enable consumers in Wales to become one of the first regions to profit from the potential benefits, such as demand response activities.

However, this may be offset by the low income in the region which makes it less likely that the necessary investment (such as electric vehicles and heat pumps) is undertaken on a large scale, unless specific support schemes are provided. This means Wales may miss out on the benefits of its smart meter rollout in the future whilst it has to burden the cost of rolling out millions of meters.
The Welsh housing stock is among the least efficient in Britain. It has one of the lowest regional proportions of EPC ratings above C and with 9% of EPC ratings in the F and G category. This means that electrification of heating could increase overall energy costs. This would negatively affect the region economically and could increase fuel poverty, where it currently holds a midrange position.
Wales has the lowest EV penetration and the fewest charging points, with only 3% of all the chargers being in Wales. This is induced by the more rural setting than other regions and higher driving distances. The region will miss out on the benefits of electric vehicles and could pay a higher price for electrification. Wales has a single electric bus running in Cardiff, which exemplifies the current situation. Wales has the lowest (joint with East Midlands) number of ultra-low emission HGVs and faces the greatest financial burden for battery-electric vehicles and plug-in hybrid electric vehicles. When normalised by the total number of journeys taken in that same year, Wales is amongst the highest investment spend per journey on rail and much higher than the South East of England (i.e. regions East, South East and London). This seems to correlate with the limited electrification in rail and reduces the chances of carbon emissions reduction through a modal shift in the transport sector.
Wales suffers the highest cost associated with transitioning to electric heating and passenger transport. The yearly additional cost amounts to ~£1,100, with ~£1,040 related to the increased cost BEVs and ~£60 related to the increased cost of ASHP.

6.8 East Midlands
The East Midlands is ranked joint eighth in the regional comparison. The power system continues to host a large coal and gas capacity, as well as a significant renewable and electricity storage capacity. Currently, the region has the second highest transmission capacity of all regions. However, a smaller growth rate compared to other regions further north could see the East Midlands lose this second-place ranking. The growth in renewables and existing transmission capacity places the region at a good starting point to undergo an electricity transformation.

The East Midlands has the second greatest absolute number and the greatest penetration of ultra-low emission buses into their fleet. In the East Midlands, the city of Nottingham has been an early adopter of electric buses, having recently purchased a further 13 battery electric buses to join the current 45. The East Midlands have the lowest number of ultra-low emission HGVs. Despite positive movement in the transport sector, there is still considerable changes required to ensure a transformation of the transport sector.
The East Midlands have one of the highest proportions of F and G rated buildings, resulting in part in high fuel poverty rates. Electric heating uptake is low in buildings. Considerable support is required to ensure that both the energy transformation in buildings can occur alongside other regions and that vulnerable consumers will not be significantly financially affected.
The additional yearly cost of using ASHP for heating and a BEV for private passenger transport amounts to over £1,000 in the East Midlands. This is mostly related to the ~£920 additional cost of BEV ownership. The East Midlands therefore ranks as the region with the 4th highest additional cost.

Humber Bridge
6.9 Yorkshire and the Humber
Ranking join eighth, Yorkshire and the Humber is characterised by its past of being home to several large coal power plants, remaining one of the few regions with active coal power generation, and currently has the second-most installed capacity. Further, as a result of Drax’s conversion of four out of six coal units to biomass, Yorkshire and the Humber has the greatest biomass capacity in Britain.

Projections indicate the region will connect several offshore wind farms, generating employment during the construction and operation phases. This added capacity in the region will mean either greater electricity storage will be required or a doubling of the grid capacity in neighbouring regions. Notably, the region currently has one of the lowest installed capacities in electricity storage, although recent announcements suggest Yorkshire may become a leader in this area.
Yorkshire has seen the greatest growth of all regions in the number of plug-in vehicles, having grown over 200 times its size since 2011, albeit from a low starting point. The region requires more incentives for progress in the energy transition of the transport sector as it would otherwise fall behind the rest of the country.
Buildings in Yorkshire have the lowest rate of EPC ratings above C in the country, with around 7% of buildings rated at F and G. Despite having the second lowest energy bills in Britain, fuel poverty is still high. Strong intervention is required to ensure that the region’s energy transition in buildings is not left behind.
The additional cost of electric heating and transport is ~£950 in Yorkshire. Of this, ~£880 is related to the additional cost of BEV ownership. This places Yorkshire slightly below average, ranking the 5th lowest cost among the regions.

6.10 North West
The North West ranks tenth, its power system has a rich mix of coal, gas and nuclear power stations, as well as offshore wind power in the Irish sea. Further, the largest wind turbine of the world resides in the newly finished Burbo Bank Offshore Wind Farm, which connects to an onshore substation at Wallasey, near Liverpool.
The North West was also the first region to have liquid air electricity storage, before the facility was moved from Lancashire to Birmingham. The region has one of the highest employment numbers in renewable energy in England, increasing its long-term competitiveness. Despite these progresses in the power sector, the region does not rank highly amongst the other regions in the energy transition of the power sector.
The North West is one of the leading regions for the penetration of ultra-low emission HGVs, both in absolute number and as a proportion of the HGV fleet. This however does not overcome the shortcomings in the other transport, transition metrics. The region requires greater support to ensure that it is not left behind in the energy transition of the transport sector.
Buildings in the North West are characterised by low-midrange EPC ratings. Despite lower electricity prices, the cost of heating still leaves many North Westerners fuel poor, due to overall lower regional incomes. This is generally reflected in all the midlands and northern regions. The transition to electric heating would increase energy bills in the regions, strongly affecting already vulnerable, fuel poor consumers.
The additional cost of electrifying heating and transportation amounts to ~£1,020 per year in the North West. This is mostly related to the additional cost of BEV ownership, which stand at ~£910 per year. The North West has the 2nd highest additional cost, behind only Wales.

6.11 North East
The North East is the least transformed region in GB. The North East’s power system is characterised by its need to triple grid transmission capacity by 2040, with the possibility of connecting an offshore wind farms in the near future. The largest power stations are Hartlepool nuclear power plant (1.3 GW), set for decommissioning in the mid-2020s, and Lynemouth biomass power station (400 MW). Excluding biomass, the North East has the lowest power station capacity in the country except London.

This absence of generation, especially by the mid-2020s means that an investment in wind power could boost local economy and enhance the current the structural changes ongoing in the region. Positively, the region has the second highest smart meter roll-out rate in Britain.
The North East has had the smallest growth in the number of registered plug-in vehicles, with its fleet in 2018 (Q1) being 34 times larger than it was in 2011, which is only half the national growth rate. To compound this, the North East has fewer electric and hydrogen buses than it did in 2010. Based on total cost of ownership calculations, battery-electric vehicles and plug-in hybrid electric vehicles place the greatest financial burden on consumer of the North East. Interestingly, the competition for charging points is amongst the lowest in Britain, meaning the stage is set for greater uptake of electric vehicles. Based on the total number of journeys, the North East invested the most per rail journey in 2017, despite its limited electrification.
The region’s buildings have a relatively high EPC ratings (above C). However, it has the second highest fuel poverty rates, despite having some of the lowest energy bills. There are currently very few low-carbon heating units installed, and our total cost of ownership calculations show that a change to electric heating would increase household bills in the North East the most compared to other regions.
The cost of switching to electric heating and transport in the North East is projected to be ~£1,015 per year. This is the 3rd highest cost increase across Britain’s regions, and only £2/year behind the North West. BEV ownership accounts for ~£890 of this additional cost, while ASHP heating accounts for ~£125. Clearly, efforts to reduce the cost premium for electric technologies in a region with below-average uptake and below-average income could have significant impacts on future progress.
Chapter 7:
Conclusions
This study has examined the current state of the energy transition and its likely future pathway. By combining publicly available data and commonly accepted scenarios for the energy transition we have identified targets for the future state of the energy system and the current state of the transition. As the energy transition cannot be measured directly, we have chosen to use a large number of indicators to establish whether the transition is on track.
These metrics serve as a proxy to gauge the process. For each metric we identify whether it is on track, almost on track (90% of target) or not on track. The progress is then measured towards scenarios from National Grid Future Energy Scenarios (FES), the Department for Business, Energy and Industrial Strategy (BEIS) and the Government’s Committee on Climate Change (CCC), which have the target year of 2030.
These findings are standardised in a barometer format, giving the visual representation of the progress. Additional data was gathered to present the barometers on a regional level for the 11 regions of Great Britain. This represents an important differentiation of the information when compared to previously published reports.
The regional information adds another layer of analysis and allows the investigation of the regional differences. Regions differ in their starting points in the energy transition, as well as in their potential to transition the power, transport, heating and industrial energy sectors and how they interact (sector coupling). We further combine this data with socio-economic information on each region, which allows us to analyse the implications for individuals and businesses.
The results from the barometers show that the power sector largely on track and in full state of transition. Further challenges lie ahead to achieve the deep decarbonisation that is required. The buildings energy sector poses a big challenge and requires significantly more effort to decarbonise. We have assessed the progress of decarbonising heating with electrification and increasing energy efficiency in homes, concluding that the current levels of activity will not yield the necessary results. The transport sector has a more diverse picture. Some of the chosen indicators show that the transport sector is on track (e.g. number of EV chargers) in some regions. However, regional differences are most pronounced in the transport energy sector. The industrial sector is potentially the hardest to decarbonise, as it is diverse in the application with the most energy-intensive processes unable to transform because of either economic or technical reasons. However, economic growth in industry has already decoupled from GHG emissions, which is an encouraging sign for the future.
7.1 Power
The sector is on track to meet three out of six of its objectives and in close pursuit of two more with one target clearly missed so far.
In the future all electricity will have to come from clean sources, such as wind, solar and nuclear, alongside the use of flexible options for balancing (e.g. bioenergy and gas with CCUS). The large cost reduction in renewable energies sources (RES) makes it more likely that intermittent generators will dominate the energy system.
A shift in the location of generators will change and therefore so will the areas of economic activity in the electricity supply sector. Generally speaking this favours more rural and coastal areas.
A multitude of different options, such as interconnection, storage and demand side response will be available in the future to allow the balancing of the system.
The roll-out of smart meters is taking place at a different speeds across the country, but is clearly behind the target. This prohibits the use of demand response from domestic customers in the near future.
Large cost reductions in key technologies such as renewable generators, batteries and hydrogen suggest that it is possible that costs for the consumers may not rise at all.
Renewables, particularly wind and solar farms, have led to job creation in less economically developed regions Britain. Scotland shows that the increase in renewable generation has created a strong new industrial sector. The changing generation mix is leading to shifting employment patterns, with job losses in fossil generation businesses offset by gains in employment in renewables. The dispersed nature of renewables means that jobs are created in construction, operation and maintenance in more remote areas.
7.2 Transport
The sector is on track to achieve three out of the seven targets examined for this research and falling well behind on four.
Transport is behind in reaching its GHG emissions target and a long way off the final target, meaning that large changes will be required to achieve the 2030 climate targets.
Electric vehicle (EV) sales are ramping up from a low base, but the current 0.4% of the fleet will need to become 27% by 2030 if climate targets are to be met.
At an aggregated, national level EV charger deployment appears to be on target to deliver enough charging points for the projected EV uptake. However, there is regional and intraregional clustering of these charging points, which will result in shortages and access problems in other locations. The electricity network implications of charging infrastructure also require significant investment.
Hydrogen vehicles have not yet developed in Britain, with only one vehicle model currently eligible for the Plug-In Grant. The lack of refuelling stations and their clustering in London further hinders deployment.
Early battery and hydrogen electric bus fleet penetration is on track despite overall bus fleet growth.
Rail emissions have only decreased by 1% since 2010, jeopardising the achievability of the 2030 target. Recently scrapped electrification plans are further hampering the transition of this industry.
7.3 Buildings
Domestic buildings are a high emitting sector, mainly due to the provision of heat. 83% of energy used domestically goes to space and water heating. Economically and environmentally this is the area to focus upon.
Domestic energy efficiency in Britain is lagging behind targets and non-domestic energy efficiency targets do not exist. Scotland benefits from higher proportions of high energy efficiency ratings whilst Wales has the poorest performing houses on average.
This can have a large effect on energy bills, especially with electric heating, which can have significantly higher costs than oil or gas. Low energy efficiency is also linked to fuel poverty. However, this correlation is hard to see with the averaged out regional data.
Fuel poverty has been fairly even across the Britain but is generally more prevalent in northern regions than southern ones, matching the trends in household income.
Despite large deployment targets for 2030, the share of low-carbon heating (especially heat pumps) is still very low. A large scale up in the near future is therefore necessary. This will affect the cost of energy for each region differently, depending on the housing composition and current heating source.
Extreme electrification could benefit energy spend in Scotland and the South-West, while increasing costs for midland and northern regions of England.
There are already high levels of electrification in non-domestic buildings. The South of England is the most electrified part of GB in this subsector.
London and the South spend less on energy relative to Gross Value Added (GVA), making companies in these regions less susceptible to changes in the energy system and its costs.
7.4 Industry
Industry is a difficult sector to transform, as there are many economic and technological barriers and there are no robust targets for the industrial sector’s energy transition, beyond GHG reduction.
As a whole, British industry has decoupled its economic growth from the emission of GHGs, currently placing it on track to reach climate targets.
Absolute electricity use in industry has stayed constant, while its share of total energy has increased, as processes have been electrified and efficiency increases have been implemented.
The top 10 energy consuming industries have varying degrees of electrification. At this point, many processes have been optimised for cost. It is theoretically possible to increase electrification but this will increase energy costs significantly. This would make industry uncompetitive unless carbon pricing revenue is recouped.
North West, Midlands and South East are most at risk to losing jobs because of automation as these are the most industrialised areas in the country. Over 500,000 jobs are at risk in manufacturing, mining and quarrying, water and waste. This would obviously have a large effect on the energy demand of the industrial sector.
7.5 Concluding remarks
So, in this first assessment of Britain’s energy transition, there is much to be positive about, but science fiction writer William Gibson’s observation that “the future is already here – it’s just not very evenly distributed” applies.
The rapid decarbonisation of electricity is a feather in Britain’s cap, providing a means to transform electricity-intensive sectors. Buildings and to some extent industry are already benefiting, whilst transport is potentially well-positioned. There are tough challenges ahead though, since areas such as heavy industry, freight transport and some parts of heating do not immediately lend themselves to electrification, so other options need to be considered. The uneven distribution of change also applies regionally and socially. A looming concern is the effect of disparities in the energy transition, with some at risk of being left behind economically due to unaffordable changes. As in other walks of life London stands apart, whilst less affluent regions in the north and elsewhere are falling behind on many measures.
This work has drawn from diverse sources to provide a synthesised picture. Full comparability of data is hard, but the authors have sought to adjust for differences of scope, time-scale and accuracy. Care has been taken to consider where Britain ‘ought’ to be relative to the desired end points. Many representations of the underlying data are possible and more has been left out than included. More can always be done and the authors welcome the engagement of readers to inform the future of Energising Britain. We thank you for reading this far.