Author: Alice Roberts

What is renewable energy?

These differ to non-renewable energy sources such as coal, oil and natural gas, of which there is a finite amount available on Earth, meaning if used excessively they could eventually run out.

Renewable resources can provide energy for a variety of applications, including electricity generation, transportation and heating or cooling.

The difference between low-carbon, carbon neutral and renewable energy

Renewables such as wind, solar and hydropower are zero carbon sources of energy because they do not produce any carbon dioxide (CO2) when they generate power. Low-carbon sources might produce someCO2, but much less than fuels like coal.

Bioenergy that uses woody biomass from sustainably managed forests to generate electricity is carbon neutral because forests absorb CO2 from the atmosphere as they grow, meaning the amount of CO2 in the atmosphere remains level. Supply chains that bring bioenergy to power stations commonly use some fossil fuels in manufacturing and transportation. Therefore woody biomass is a low carbon fuel, when its whole lifecycle is considered.

Managing forests in a sustainable way that does not lead to deforestation allows bioenergy to serve as a renewable source of power. Responsible biomass sourcing also helps forests to absorb more carbon while displacing fossil fuel-based energy generation.

Nuclear is an example of a zero carbon source of electricity that is not renewable. It does not produce CO2,but it is dependent on uranium or plutonium, of which there is a finite amount available.

Managing forests in a sustainable way that does not lead to deforestation allows bioenergy to serve as a renewable source of power.

How much renewable energy is used around the world?

Humans have harnessed renewable energy for millions of years in the form of woody biomass to fuel fires, as well as wind to power ships and geothermal hot springs for bathing. Water wheels and windmills are other examples of humans utilising renewable resources, but since the industrial revolution fossil fuels, coal in particular, have been the main source of power.

However, as the effects of air pollution and CO2 produced from burning fossil fuels become increasingly apparent, renewable energy is gradually replacing sources which contribute to climate change.

In the year 2000 renewable energy accounted for 18% of global electricity generation, according to the IEA. By 2019, renewable sources made up 27% of the world’s electrical power.

Why renewable energy is essential to tackling climate change

The single biggest human contribution to climate change is greenhouse gas emissions, such as CO2, into the atmosphere. They create an insulating layer around the planet that causes temperatures on Earth to increase, making it less habitable.

Renewable sources of electricity can help to meet the world’s demand for power without contributing to global warming, unlike carbon-intensive fuels like coal, gas and oil.

Bioenergy can also be used to remove CO2 from the atmosphere while delivering renewable electricity through a process called bioenergy with carbon capture and storage (BECCS).

Forests absorb CO2 from the atmosphere, then when the biomass is used to generate electricity the same CO2 is captured and stored permanently underground – reducing the overall amount of CO2 in the atmosphere.

Humans have used renewable energy for millions for years, from wood for fires to wind powering boats to geothermal hot springs. 

What’s holding renewables back?

The world’s energy systems were built with fossil fuels in mind. This can make converting national grids difficult and installing new renewable energy sources expensive. However, as knowledge grows about how best to manufacture, build and operate renewable systems, the cost of deploying them at scale drops.

There are future changes needed. Renewables such as wind, solar and tidal power are known as intermittent renewables because they can’t generate electricity when there is no sun, wind or the tidal movement. For future energy systems to deliver enough power, large scale energy storage, as well as other flexible, reliable forms of generation will also be needed to meet demand and keep systems stable.

Renewable energy key facts:  

Go deeper

Pricing of offering of Senior Secured Notes due 2025

RNS Number: 8306C
Drax Group PLC (Symbol: DRX)

Drax Group plc (“Drax“) today announced that its indirect wholly owned subsidiary, Drax Finco plc (the “Issuer”), priced its offering (the “Offering“) of euro denominated senior secured notes due 2025 (the “Notes“) in an aggregate principal amount of €250 million.

The Notes will bear interest at an interest rate of 25/per cent. per annum and will be issued at 100 per cent. of their nominal value.

Drax has placed cross-currency swaps to convert the proceeds of the Offering into Sterling, as a result of which the effective Sterling-equivalent interest rate is 3.24 per cent. per annum.  The Notes will extend the Group’s average debt maturity profile and reduce the Group’s overall cost of debt.

Drax intend to use the gross proceeds of the Offering (i) for general corporate purposes, which may include the repayment of indebtedness, and (ii) to pay estimated fees and expenses of the Offering, including Initial Purchasers’ fees and commissions, professional fees and other associated transaction costs.  Drax intend to repay the existing £350 million 4 ¼ per cent. Senior Secured Fixed Rate notes due 2022 issued by the Issuer in full before 31 December 2020.

Enquiries:

Drax Investor Relations: Mark Strafford

+44 (0) 1757 612 491

Media:

 Drax Head of Media and PR: Ali Lewis

+ 44 (0) 203 9434311

Website: www.drax.com/uk

Cautionary Statement

This release is being issued pursuant to Rule 135c under the U.S. Securities Act of 1933, as amended (the “Securities Act“) and is for information purposes only and does not constitute a prospectus or any offer to sell or the solicitation of an offer to buy any security in the United States of America or in any other jurisdiction. Securities may not be offered or sold in the United States of America absent registration or an exemption from registration under the Securities Act. The Notes and related guarantees were offered in a private offering exempt from the registration requirements of the Securities Act and were accordingly offered only to persons outside the United States in compliance with Regulation S under the Securities Act. No indebtedness incurred in connection with any other financing transactions will be registered under the Securities Act.

This communication is directed only at persons who (i) have professional experience in matters relating to investments falling within Article 19(5) of the Financial Services and Markets Act 2000 (Financial Promotion) Order 2005 as amended (the “Order“), (ii) are persons falling within Article 49(2)(a) to (d) (“high net worth companies, unincorporated associations, etc.”) of the Order, (iii) are persons who are outside the United Kingdom, or (iv) are persons to whom an invitation or inducement to engage in investment activity (within the meaning of section 21 of the Financial Services and Markets Act 2000) in connection with the issue or sale of any notes may otherwise lawfully be communicated or caused to be communicated (all such persons together being referred to as “relevant persons”).

Any investment activity to which this communication relates will only be available to, and will only be engaged in with, relevant persons. Any person who is not a relevant person should not act or rely on this document or any of its contents.

This announcement is not a public offering in the Grand Duchy of Luxembourg or an offer of securities to the public under Regulation (EU) 2017/1129, and any amendments thereto.

The Notes are not intended to be offered, sold or otherwise made available to and should not be offered, sold or otherwise made available to any retail investor in the European Economic Area (the “EEA”) or in the United Kingdom (the “UK”). For these purposes, a retail investor means a person who is one (or more) of: (i) a retail client as defined in point (11) of Article 4(1) of Article 4(1) of MiFID II; (ii) a customer within the meaning of the Insurance Distribution Directive), where that customer would not qualify as a professional client as defined in point (10) of Article 4(1) of MiFID II; or (iii) not a qualified investor as defined in Regulation (EU) 2017/1129 (as amended, the “Prospectus Regulation”). Consequently no key information document required by Regulation (EU) No 1286/2014 (as amended, the “PRIIPs Regulation”) for offering or selling the Notes or otherwise making them available to retail investors in the EEA or in the UK will be prepared. Offering or selling the Notes or otherwise making them available to any retail investor in the EEA or in the UK may be unlawful under the PRIIPs Regulation. Any offer of Notes in any Member State of the EEA or in the UK will be made pursuant to an exemption under the Prospectus Regulation from the requirement to publish a prospectus for offers of Notes.

The Manufacturer target market (MiFID II product governance) is eligible counterparties and professional clients only (all distribution channels).

In connection with any issuance of the Notes, a stabilising manager (or person(s) acting on behalf of such stabilising manager) may over-allot Notes or effect transactions with a view to supporting the market price of the Notes at a level higher than that which might otherwise prevail. However, stabilisation may not necessarily occur. Any stabilisation action may begin on or after the date on which adequate public disclosure of the terms of the offer of the Notes is made and, if begun, may be ended at any time, but it must end no later than 30 days after the date on which the issuer received the proceeds of the issue, or no later than 60 days after the date of the allotment of the Notes, whichever is earlier. Any stabilisation action or over-allotment must be conducted by the stabilising manager (or person(s) acting on behalf of the stabilising manager) in accordance with all applicable laws and rules.

Forward Looking Statements

This release includes forward-looking statements within the meaning of the securities laws of certain applicable jurisdictions. These forward-looking statements can be identified by the use of forward-looking terminology, including, but not limited to, terms such as “aim”, “anticipate”, “assume”, “believe”, “continue”, “could”, “estimate”, “expect”, “forecast”, “guidance”, “intend”, “may”, “outlook”, “plan”, “predict”, “project”, “should”, “will” or “would” or, in each case, their negative, or other variations or comparable terminology. These forward-looking statements include, but are not limited to, all statements other than statements of historical facts and include statements regarding Drax’s intentions, beliefs or current expectations concerning, among other things, Drax’s future financial conditions and performance, results of operations and liquidity, strategy, plans, objectives, prospects, growth, goals and targets, future developments in the markets in which Drax participate or are seeking to participate, and anticipated regulatory changes in the industry in which Drax operate. By their nature, forward-looking statements involve known and unknown risks, uncertainties and other factors because they relate to events and depend on circumstances that may or may not occur in the future. Readers are cautioned that forward-looking statements are not guarantees of future performance and are based on numerous assumptions. Given these risks and uncertainties, readers should not rely on forward looking statements as a prediction of actual results.

END

How to make batteries more sustainable

batteries in a recycling bucket

Batteries can be found everywhere: in our houses, in our cars and vans and even in the tech we wear. More than just being pervasive, battery technology has enabled a huge amount of technological breakthroughs – from the increasing distances electric vehicles can travel between charges, to being able to store renewable electricity for when it’s needed.

These two developments in particular – emission-free electric transport and grid-scale batteries that can power homes, businesses and cities even when energy sources are not generating – could be two key aspects in the transition to a zero carbon energy future. However, questions remain around batteries’ environmental impact.

What’s in our batteries?

The batteries we use every day are typically made from a mix of metals and chemicals such as lead and acid (as found in petrol and diesel-engine cars), or zinc, carbon, nickel and cadmium, which make up some of the batteries found in the home.

Then there’s lithium-ion. The go-to material mix for the rechargeable batteries powering mobile phones, laptops and, more recently, a high proportion of electric vehicles around the world.

The surge in the production of lithium-ion batteries over the last decade has led to an 85% price reduction, which in turn, has encouraged the use of these reliable batteries in electric vehicles and large-scale energy storage solutions. While this is a positive step in the development of rechargeable goods, it raises issues in the handling of spent batteries.

Each year around 600 million batteries are thrown away in the UK alone – even rechargeable batteries have a shelf-life. While recycling allows the safe extraction of raw materials for use in other industries and products, the majority of discarded batteries are left to rot in landfill sites. This can lead to their chemical contents leaking into the ground causing soil and water pollution.

Batteries left in soil

For batteries of any size to play a role in a sustainable future, an overhaul is needed in preventing harmful levels of battery waste. 

The battery problem

Although the number of batteries that are recycled has increased, currently the EU puts the recycling efficiency target for a lithium battery at only 50% of the total weight of the battery.

Connecting positive and negative terminals on a rechargeable lithium mobile battery

Standard recycling methods achieve this by separating and processing the plastics and wiring that make up the bulk of the battery pack, then smelting and extracting the copper, cobalt and nickel found within the cell, releasing carbon dioxide in the process. Crucially, these recycling practices do not typically recover the aluminium, lithium or any of the organic compounds within the battery, meaning that only around 32% of the battery’s materials can be reused. A lack of recycling facilities in the UK means spent batteries have traditionally been exported overseas for treatment, upping emissions even further.

It is not only spent batteries that cause a problem, the creation of them can be harmful too. For example, lithium mining can pose health hazards to miners and damage local communities and their environments.

In one area of Chile, 65% of available water is used in the production of lithium for batteries, meaning water for other uses, such as maintaining crops, must be driven in from somewhere else, impacting farmers greatly. There are also risks around contaminated water leaking into livestock and human water supplies, as well as causing soil damage and air pollution.

As a result, teams across the globe are working to make the production and recycling of batteries more efficient and eco-friendly.

Switching materials

Researchers based at Chalmers University of Technology in Sweden and the National Institute of Energy in Slovenia, are developing an aluminium-ion battery. This type of battery offers a promising alternative to lithium-ion due to the abundance of aluminium in the Earth’s crust and its ability, in principle, to carry charges better than lithium.

Disassembling the battery from an electric vehicle (EV)

The reduction in material and environmental costs that come with using aluminium over lithium might mean batteries made with it could offer more affordable, large-scale storage for renewable installations.

While more research is still needed to reduce the size and control the temperature of aluminium batteries, researchers believe they will soon enter commercial production and eventually could replace their lithium-ion predecessors.

Elsewhere, IBM Research’s Battery Lab is developing a sustainable battery solution made predominantly of materials extracted from seawater, a composition that would avoid the concerns associated with the production of lithium-ion cells.

While the exact combination of materials in not public, Battery Lab claims the new concept has outperformed its lithium-ion counterpart in energy density, efficiency, production costs and charging time. 

Making good of the old

Along with advancements in battery development, new recycling methods are also reducing the environmental impact of batteries.

German company, Duesenfeld, is innovating the recycling of lithium-ion batteries used in electric vehicles through an innovative new process.

Batteries are first discharged and disassembled into their constituent parts. The metals are extracted with a water-based solution, the liquid chemicals evaporated and condensed, and the dry materials crushed and separated, ready for reuse. Importantly, Duesenfeld’s method avoids incineration, reducing the carbon footprint of lithium-ion battery recycling by 40% and enabling over 90% of the batteries’ materials to be salvaged and reused in new batteries.

Fortum, a Finnish energy company, is exploring a similar process, with the potential to recycle more than 80% of battery materials, including cobalt, manganese and nickel.

This year Fortum signed a deal with German chemical company BASF and Russian mining and smelting firm Nornickel to develop a renewable-powered, electric vehicle battery recycling cluster in Finland. The aim is to create a ‘closed-loop’ battery production and recycling system, meaning materials from recycled batteries would be used to make new batteries.

While it is clear there is a long way to go in reducing the environmental impact of battery production and recycling, continued development of both batteries and technology can pave a path for a cleaner, safer, battery-powered, zero carbon future.

Electric vehicle battery pack

EV fast facts from Electric Insights:

  • Electric vehicles (EVs) on roads in Great Britain – including EV vans – emit on average just one quarter the carbon dioxide (CO2) of conventional petrol and diesel vehicles
  • If the carbon emitted in making their battery is included, this rises to only half the CO2 of a conventional vehicle
  • EVs bought last year could be emitting just a tenth that of a petrol car in four years’ time, as the electricity system continues to decarbonise

The myths, legends and reality of Cruachan Power Station’s mural

Down the kilometre-long tunnel that burrows into the dark rock of Ben Cruachan, above the giant rumbling turbines, sits something unusual for a power station: a work of art.

The wood and gold-leaf mural might seem at odds with the yellow metal turbines, granite cavern walls, and noise and heat around it, but it’s closely connected to the power station and its ties to the surrounding landscape.

The entrance tunnel might take engineers and machines to the heart of Ben Cruachan, but the mural transports viewers to the mountain’s mythical past. It tells the story of how this remarkable engineering achievement came to help power the country.

The narrative of the mural

Much like the machines and physical environment surrounding it, the Cruachan mural is big, measuring 14.6 metres long by 3.6 metres tall. Combining wood, plastic and gold leaf, the relief is interspersed with Celtic crosses, textures evocative of granite rock and gold orbs that resemble the urban lights Cruachan helps to power. Running from left to right, it tells a linear narrative that spans the history of the mountain.

An artist’s impression of the mural in the Visitor Centre at Cruachan

In the first of the mural’s three segments is a Scottish red deer, a native species that still thrives in Scotland today. Below it is the figure of the Cailleach Bheur, a legendary old woman or hag found across Gaelic mythology in Scotland, Ireland and on the Isle of Man. The Cailleach has a symbolic representation of a variety of roles in different folklores, but she commonly appears as a personification of winter, and with that, as a source of destruction.

In the context of Ben Cruachan, Cailleach Bheur is often taken to mean the ‘Old Hag of The Ridges,’ a figure who acts as the mythical guardian of a spring on the mountain’s peak. The mural tells her story, of how she was tasked to cover the well with a slab of stone at sundown and lift it away at sunrise. One evening, however, she fell asleep and failed to cover the well, allowing it to overflow and cause water to cascade down the mountain, flooding the valley below and drowning the people and their cattle.

The mural within the Turbine Hall at Cruachan Power Station undergoing maintenance  [November 2018]

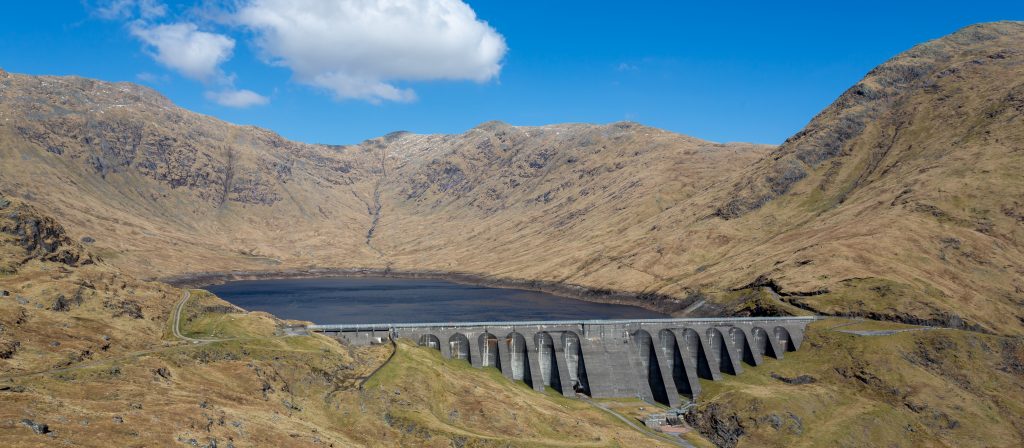
This serves as the legendary origins of Loch Awe, from which Cruachan power station pumps water to the upper reservoir when there’s excess electricity on the grid.

The story claims the water washed a path through to the sea, creating the Pass of Brander. The site of a 1308 battle in the Scottish Wars of Independence, where Robert the Bruce defeated the English-aligned MacDougall and Macnaghten clans.

The mythical first section of the mural is separated by a Celtic-style cross from the modern second segment, which portrays the power station’s construction within Ben Cruachan. Here, four figures represent the four lead engineers of the project from the firms James Williamson & Partners, William Tawse Ltd, Edmund Nuttall Ltd and Merz & McLellan. They stand by the mountain, a roughly cut path running through its core.

At the base of the mural are the faces of 15 men lying on their sides. These are the  15 who were killed in  1962 when the ceiling of the turbine hall caved in during construction. Their uniform expressionless faces, however, turn them into symbols of the 30-plus workers who died while digging and blasting the power station’s tunnels and constructing the dam at the upper reservoir.

Next to this is a fairy tale portrayal of Queen Elizabeth II, who wears a gold grown and holds a sceptre from which electricity flows in a glowing lightning bolt through rock, commanding the power station into life.

The final third of the mural shows the whole power station system within the mountain. The upper reservoir sits nestled in the slopes of Ben Cruachan with water flowing down the mountain to the four turbines and Loch Awe below. Viewed as a whole, the mural takes the audience from mythology to the modern power station, which continues to play a vital role in the electricity system today.

Carving the Cruachan mural

The mural was created by artist Elizabeth Falconer, who was commissioned to create it to celebrate the power station’s opening by the Queen on 15 October 1965. At the time, only two of Cruachan’s four 100 megawatt (MW) reversible turbines were completed and operational, but it was still the first station of its kind to operate at such a scale. Two of the power station’s  turbines were modified with increased capacities meaning Cruachan can both use and generate up to 440 MW.

HRH Queen Elizabeth II opening Cruachan in 1965

HRH Queen Elizabeth II opening Cruachan on 15 October 1965

The project came to Falconer through her husband, a native of Aberdeen who worked as an architect partner to one of Cruachan’s engineering firms. The brief simply requested she create a piece to fill the empty space on the wall of the turbine hall. Deciding to dive into the history and mythology of the mountain, she initially carved the mural in London and only ventured into Hollow Mountain years after it was first put in place, to make renovations on the work.

Cruachan Power Station was a visionary idea and represented a considerable technical and engineering achievement when it opened. The designs and construction of the reversable turbines put this site at the cutting end of modern energy technology.

So, it’s fitting the mural appears distinctly modern in its design, yet tells a story that connects this modern power station to the ancient rock it lives within.

It’s Cruachan’s mural’s location inside the mountain that makes it so unique as a work of art. However, at a time when the electricity grid is changing to an increasingly renewable system, based more around weather and geography, the connections the mural makes between Scotland’s landscape and the modern power station, make it relevant beyond the turbine cavern.


Find out more about Cruachan Power Station

Georgia Mill Cluster catchment area analysis

Forest in LaSalle catchment area

The seventh report in a series of catchment area analyses for Drax looks at the fibre sourcing area surrounding a number of compressed wood pellet plants operated by Georgia Biomass (now owned by Enviva) and Fram Renewable Fuels.

The evidence found in the report by Hood Consulting shows a substantial increase in forest inventory (stored carbon) and a relatively stable forest area. However, with continued pressure from urban development, future losses of timberland area are possible.  Despite this, increasing growth rates can maintain and improve wood supply and carbon stock for the foreseeable future.

Increasing forest growing stock and carbon sequestration

The overall inventory of growing stock in the catchment area has increased by 63 million cubic metres (m3) between 2000 and 2018, a growth of 19.3%.  All of this increase has been in the pine area, which increased by nearly 68 million m3, whereas the hardwood species decreased in volume by 4.5 million m3. Overall, the inventory volume split by species in 2018 was 72% to 28% softwood to hardwood. The breakdown by product category is shown in Figure 3 below.

Figure 1: Change in growing stock by major product category and species (USFS)

The pine saw-timber and chip-n-saw product categories, larger dimension and higher value material, showed the largest increase in inventory, whereas pine pulpwood decreased in total volume.  The most substantial change occurred from 2010 to 2018, where pulpwood went from an increasing trend to a decreasing trend and saw-timber increased in volume much more rapidly – this is shown in Table 1 and Figure 2 below.

Change (cubic metres (m3))Pine SawtimberPine Chip-n-sawPine PulpwoodHardwood SawtimberHardwood PulpwoodTotal
2000-201851,301,62822,277,139-5,835,2301,211,110-5,657,11463,297,533
2000-201014,722,99512,707,6745,262,192-3,740,507-5,76989923,182,455
2010-201836,578,6329,569,465-11,097,4224,951,618112,78440,115078
Table 1: Change in growing stock volume by major product category (USFS)

These changes are likely to reflect an increasing age class in the catchment area, with younger stands of pine (previously classed as pulpwood), growing into a larger size class and being reclassified as saw-timber.  This means that the volume of saw-timber availability in future will be significantly higher, but pulpwood availability will be diminished.  For pellet mill markets any loss in pulpwood availability can be compensated by an increase in sawmill residue production if market demand is maintained or increased.

Figure 2: Change in growing stock by major product category and species (USFS)

Growth rates for both softwood and hardwood species have been increasing since 2000 as shown in Figure 3 below. Softwood growth has increased by 18.5% since 2000 and hardwood by 1.4%. The improved softwood growth rate probably resulted from increased investment in the management of pine forests, the superior quality of seedlings and better management practice (ground preparation, weed control, fertilisation etc.). This is a very positive trend for the sequestration rate of carbon and also for providing landowners with the potential to increase revenue per hectare and encourage the retention and improved management of forests, rather than converting to other land uses. The Georgia catchment area is likely split between passive owners that do not actively manage, where growth rates are slower or decline and the incentive to convert land is greater, and owners that actively manage to improve growth and quality, increasing revenue and maintaining productive forest.  There is likely to be a much greater differential in growth rate between these two management approaches than reflected by the trend in Figure 3, highlighting the importance of active management for carbon abatement.

Average annual growth rate per hectare (USFS)

Figure 3: Average annual growth rate per hectare (USFS)

Stable forest area

At a macro scale, the distribution of land use categories has remained relatively stable since 2000, with no apparent major shifts in land use. The timberland area around the seven mills has decreased by around 135 thousand hectares (ha) between 2000 and 2018 (2.3% of the total land area), whilst the area of arable and urban land increased by 98 thousand (1.7% of total area) and 158 thousand (2.7% of total area) ha respectively.  In 2018, timberland represented 67% of total land area and all forest and woodland 80% of total area, down from 69% and 82% respectively in 2000 (Figure 1).

Change in land use category (USDA)

Figure 4: Change in land use category (USDA)

Looking at this change in land use more closely, the timberland area shows the most pronounced decline between 2010 and 2018, a drop of 117 thousand ha. The largest change in other land use categories over this period was an increase of 97 thousand ha in urban and other land, suggesting that a large proportion of the timberland area has been converted to urban areas.

LaSalle Bioenergy forest area

The most significant change in agricultural land occurred prior to 2010, when the timberland area remained relatively stable, this change appears to have involved the transition of pastureland to arable crops. There may also have been some reclassification of forest and woodland types, with a decrease in the area of woodland and an increase in forestland during the period between 2000 and 2010 (Table 2).

Change (hectares (ha))TimberlandOther ForestlandArable CroplandWoodlandPasturelandUrban & Other Land
2000-2018-135,19570,07398,436-77,904-113,725178,315
2000-2010-18,53953,15073,243-73,077-95,63060,852
2010-2018-116,65616,92225,193-4,827-18,09697,463
Table 2: Timing of land use change in Georgia catchment area (USDA)

These trends are also clear and apparent in Figure 3 below which shows the sharp decline in timberland area, albeit small in absolute area relative to the total catchment area size, and the steady increase in urban land.  Georgia ranks 8th in the list of US States and territories by total population with 10.6 million and 17th by population density at 184 per square mile (mi2) compared to just 63 per mi2  in Mississippi where Drax’s Amite Bioenergy (ABE) pellet plant is located and 108 per mi2 in Louisiana where the Morehouse Bioenergy (MBE) and LaSalle Bioenergy (LBE) mills are located (US Census Bureau). This population pressure and increased development can lead to more forest loss and land use change.

Trends in major land use categories (USDA)

Figure 5: Trends in major land use categories (USDA)

Drax’s suppliers in the Georgia catchment area have made a commitment not to source wood from areas where land use change is taking place. This commitment is monitored and verified through the Sustainable Biomass Program (SBP) certification process that is maintained by each mill.  Any land use change in the catchment area is likely to be a result of prevailing economic drivers in the region rather than due to actions being taken by the pellet producers.

Increasing demand and surplus forest growth

Strong markets are essential for ensuring that forests are managed and restocked to optimum benefit, sawlog markets are particularly important as this is highest revenue stream for forest owners. Figure 6 shows the trend in market demand for each major product category since 2000 and demonstrates the recent increase in softwood sawlog demand as the US economy (particularly housing starts) recovered from the global recession at the end of the last decade. Softwood pulpwood demand increased through the 2000s but has remained relatively stable since 2011, with the exception of a peak during 2018 which resulted from an increase in volume generated by salvage operations after hurricane Michael.

Figure 6: Demand for wood products (USFS, TMS)

Figure 6: Demand for wood products (USFS, TMS)

The comparison of average annual growth and removals in the Georgia catchment area is much more tightly balance than in Drax’s other supply regions, as shown in Figure 7. Since 2000 the average annual surplus of growth has been around 3.6 million m3 with both demand and growth increasing in recent years.

Figure 7: Average annual growth, removals and surplus (USFS)

Figure 7: Average annual growth, removals and surplus (USFS)

As shown in Figures 2 & 3, growth rates are strong and inventory is increasing, this is not a problem in the Georgia area.  The relatively small surplus, as compared to other catchment areas in the US South, is due to the higher concentration of wood fibre markets and the more intense forest industry activity in this region.  As of July 2020, there were over 50 major wood-consuming mills operating within the Georgia catchment area and an additional 80+ mills operating within close proximity, overlapping the catchment area.  Total pulpwood demand in 2019 was 12.9 million tons, of which approximately 87% was attributed to non‐bioenergy‐related sources (predominantly pulp/paper) and 13% was attributed to the bioenergy sector.  Given the bio-energy sector’s low ranking position in the market (with the lowest ability to pay for fibre), combined with the relatively small scale in demand compared to the pulp and paper industry, the influence of biomass markets can be considered to be minimal in this region, particular when it comes to impacts on wood prices and forest management practice.

Wood price trends

Pine sawtimber prices suffered a significant decline between 2000 and 2010, dropping almost $21 per ton as a result of the global financial crisis and the decline in demand due to the collapse in housing markets and construction (Table 3).  Since 2010 pine sawtimber has remained relatively stable, with some minor fluctuations shown in Figure 8 below.

Change ($/ton)Pine SawtimberPine Chip-n-sawPine PulpwoodHardwood SawtimberHardwood Pulpwood
2000-2019-$20.92$15.14$5.95$12.55$4.70
2000-2010-$20.92-$21.41$2.11$11.25$5.67
2010-2019$0.00$6.27$3.84$1.30-$0.97
Table 3: Stumpage price trends (TMS)

Pine pulpwood prices have been on a generally increasing trend since 2000, with a more significant increase since 2011.  This increase does not reflect an increase in demand or total volume, which has remained relatively stable over this period, but a shifting of the geographic distribution of the market with some new mills opening and old mills closing, resulting in increased competition in some localised fibre baskets and leading to an overall increase in stumpage price.

Figure 8: Stumpage price trends (TMS)

Figure 8: Stumpage price trends (TMS)

Figure 9 below shows that, with the exception of the hurricane salvage volume in 2018, pulpwood removals have declined or remained relatively stable since 2010, whereas pulpwood stumpage prices increased by 41% from 2010 to 2018.

Figure 9: Pulpwood demand and stumpage price (USFS, TMS)

Figure 9: Pulpwood demand and stumpage price (USFS, TMS)

Comparing this stumpage price trend with other catchment areas of the US South (Figure 10), where Drax sources wood pellets, the Georgia area is on average 35% higher than the next highest area (Chesapeake) and 87% higher than the lowest cost area (Amite Bioenergy in Mississippi).  This price differential is predominantly due to the scale of demand and availability of surplus low-grade fibre.

Figure 10: Comparison of pine pulpwood stumpage prices in Drax supply areas US South (TMS)

Figure 10: Comparison of pine pulpwood stumpage prices in Drax supply areas US South (TMS)

Hood Consulting summary of the impact of the seven pellet plants on key trends and metrics in this catchment area.

Is there any evidence that bioenergy demand has caused the following…

Deforestation?

No. US Forest Service (USFS) data shows a 108,130-hectare (-2.6%) decrease in total timberland in the Georgia catchment area since Georgia Biomass’ first full year of production in 2012. Specifically, this loss in total area of timberland coincided with a more than 21,000-hectare increase in cropland/pastureland and a more than 73,000-hectare increase in urban land and land classified as having other uses.

However, there is little evidence to suggest that increased wood demand from the bioenergy sector has caused this decrease in total timberland. Furthermore, pine timberland – the primary source of roundwood utilized by the bioenergy industry – has increased more than 17,000 hectares in the catchment area since 2016.

A change in management practices (rotation lengths, thinnings, conversion from hardwood to pine)?

No. Changes in management practices have occurred in the catchment area over the last two decades. However, there is little evidence to suggest that bioenergy demand, which accounts for roughly 10-14% of total pulpwood demand (and only 5-7% of total wood demand in the catchment area), has caused or is responsible for these changes.

Clearcuts and thinnings are the two major types of harvests that occur in this region, both of which are long-standing, widely used methods of harvesting timber. TimberMart-South (TMS) data shows that thinnings accounted for 67% of total reported harvest area in the southeast Georgia market from 2000-2010, but only 43% of total harvest area reported from 2012-2019. Specifically, this downward shift was initiated by the bursting of the US housing bubble in the mid-2000s and had been completed by the early 2010s. We’d like to note that this shift coincided with a nearly 50% decrease in pine sawtimber stumpage price from 2006-2012. This is important because the strength of pine sawtimber markets had been a driving force behind timber management decisions in this region in the early and mid-2000s.

Also, contributing to the decreased prevalence of thinnings was the strengthening of pine pulpwood markets in the mid-2000s, as pine pulpwood stumpage prices increased more than 40% in the Georgia catchment area from 2003-2008. So, with sawtimber markets continuing to weaken and pulpwood markets doing just the opposite, the data suggests that many landowners decided to alter their management approach (to take advantage of strong pulpwood markets) and focus on short pulpwood rotations that typically do not utilize thinnings.

Ultimately, the shift in management approach that occurred in this market can be linked to the weakening of one type of timber market and the strengthening of another. In the early and mid-2000s, timber management was focused on sawtimber production – a type of management that utilizes thinnings. However, for more than a decade now, this market has been driven to a large degree by the pulp/paper industry, with a significant portion of the timber management in this area focused on short pulpwood rotations.

Diversion from other markets?

No. Demand for softwood (pine) sawlogs increased an estimated 39% in the Georgia catchment area from 2011-2019. Also, increased bioenergy demand has caused no diversion from other pulpwood markets (i.e. pulp/paper), as pulpwood demand not attributed to bioenergy held steady and remained nearly unchanged from 2012-2017 before increasing in 2018 and 2019 due to the influx of salvage wood brought about by Hurricane Michael.

We’d like to make special note that increased demand for softwood sawlogs since 2011 has not resulted in a full pine sawtimber (PST) stumpage price recovery in this market. Reduced demand for softwood sawlogs in the late 2000s and early 2010s resulted in oversupply, and this oversupply has remained, despite increased demand the last 6-8 years. As a result, PST stumpage prices have held steady and averaged roughly $30 per ton in the catchment area since 2013 – down approximately 35% from the 2000-2006 average of more than $46 per ton, but up roughly 15% from the 2011-2012 average of approximately $26 per ton.

An unexpected or abnormal increase in wood prices?

No / Inconclusive. The delivered price of pine pulpwood (PPW) – the primary roundwood product consumed by both Georgia Biomass and Fram – increased 26% in the Georgia catchment area over the six years directly following the startup of Georgia Biomass, increasing from $29.16 per ton in 2011 to $36.63 per ton in 2017. And while this 26% increase in delivered PPW price coincided with a roughly 1.1 million metric ton increase in annual pine pulpwood demand from Georgia Biomass and Fram, total demand for pine pulpwood (from both bioenergy and other sources) actually decreased 7% over this period. Moreover, evidence suggest that this increase in PPW price is more closely linked to changes in wood supply, specifically, the 9% decrease in PPW inventory from 2011-2017.

However, there is evidence that links increased demand from the bioenergy sector to an increase in secondary residual (i.e. sawmill chips, sawdust, and shavings) prices. Specifically, the price of pine sawmill chips – a residual feedstock utilized by the bioenergy industry for wood pellet production – held steady and averaged approximately $26 per ton in the Georgia catchment area from 2008-2012. However, from 2012-2016, pine sawmill chip prices increased more than 15% (to $29.55 per ton in 2016). This increase in price coincided with annual pine residual feedstock purchases by Georgia Biomass and Fram increasing from roughly 325,000 metric tons to nearly 1.0 million metric tons over this period. However, note that pine sawmill chip prices have held steady and averaged roughly $29.50 per ton in the catchment area since 2016, despite further increases in pine secondary residual purchases by Georgia Biomass and Fram (to more than 1.2 million metric tons in 2019).

Ultimately, the data suggests that any excess supply of pine secondary residuals in the catchment area was absorbed by the bioenergy sector in the early and mid-2010s, and the additional demand/competition placed on this market led to increased residual prices. However, the plateauing of residual prices since 2015 along with the continued increase in secondary residual purchases by Georgia Biomass and Fram further suggest that an increasing percentage of secondary residual purchases by the bioenergy sector is sourced from outside the catchment area. Specifically, Fram confirmed this notion, noting that 35-40% of its secondary residual purchases come from outside the Georgia catchment area (from six different states in the US South).

A reduction in growing stock timber?

No. Total growing stock inventory in the catchment area increased 11% from 2011 through 2018, the latest available. Specifically, over this period, inventories of pine sawtimber and chip-n-saw increased 35% and 13%, respectively. However, pine pulpwood inventory decreased 11% from 2011-2018.

Note that the decrease in pine pulpwood inventory was not due to increased demand from bioenergy (or other sources) or increased harvesting above the sustainable yield capacity of the forest area – as annual growth of pine pulpwood has exceeded annual removals every year since 2011. Rather, this decrease can be linked to the 24% decline in pine sawtimber removals that occurred from 2005-2014 (due to the bursting of the US housing bubble and Great Recession that followed). In this region, timber is typically harvested via clearcut once it reaches maturity (i.e. sawtimber grade), after which the stand is reestablished, and the cycle repeated. However, with the reduced harvest levels during this period also came a reduction in newly reestablished timber stands – the source of pine pulpwood. So, with less replantings occurring during this period, inventories of pine pulpwood were not replenished to the same degree they had been previously, and therefore this catchment area saw a reduction in pine pulpwood inventory levels.

However, according to the US Forest Service, annual removals of pine sawtimber have increased 50% in the Georgia catchment area since 2014, which would suggest higher clearcut levels and increased stand reestablishment. TimberMart-South data also supports this assertion, as clearcut harvests have constituted approximately 60% of the total harvest area reported to TimberMart-South in this region since 2014, compared to 40% from 2005-2014. Ultimately, these increases in clearcut (and stand reestablishment) levels may not be reflected in increased pine pulpwood inventory levels in the short term – as it can take more than 10 years for a pine seedling to become merchantable and reach the minimum diameter requirements to be classified as pulpwood. However, adequate supply levels are expected to remain in the meantime. Furthermore, pine pulpwood inventory levels are expected to increase in the mid-to-long terms as a result of the increased harvest levels and stand reestablishment levels that have occurred in the catchment area since 2014.

A reduction in the sequestration rate of carbon?

No / Inconclusive. US Forest Service data shows the average annual growth rate of total growing stock timber has remained nearly unchanged (holding between 6.0% and 6.1%) in the catchment area since 2011, which would suggest that the sequestration rate of carbon has also changed very little in the catchment area the last 8-10 years. However, the 11% increase in total growing stock inventory since 2011 does indicate that total carbon storage levels have increased in the Georgia catchment area since Georgia Biomass commenced operations in this market.

An increase in harvesting above the sustainable yield capacity of the forest area?

No. Growth-to-removals (G:R) ratios, which compare annual timber growth to annual harvests, provides a measure of market demand relative to supply as well as a gauge of market sustainability. In 2018, the latest available, the G:R ratio for pine pulpwood, the predominant timber product utilized by the bioenergy sector, equaled 1.06 (a value greater than 1.0 indicates sustainable harvest levels). Note, however, that the pine pulpwood G:R ratio averaged 1.44 from 2012-2017. The significant drop in 2018 was due to a 31% increase in removals (due to Hurricane Michael) and is not reflective of the new norm. Specifically, pine pulpwood removals are projected to be more in line with pre-2018 levels in 2019 and 2020, and so too is the pine pulpwood G:R ratio.

Timber growing stock inventory

Neutral. According to USFS data, inventories of pine pulpwood decreased 11% in the catchment area from 2011-2018. However, that decrease was not due to increased demand from bioenergy. Typically, a reduction in inventory is linked to harvest levels above the sustainable yield capacity of the forest area, but in this case, annual growth of pine pulpwood exceeded annual removals every year during this period.

Ultimately, the decrease in pine pulpwood inventory from 2011-2018 can be linked to decreased pine sawtimber production beginning in the mid-2000s. Specifically, annual removals of pine sawtimber decreased 24% from 2005-2014, and the reduction in harvest levels during this period meant fewer new pine stands were reestablished, and that has led to the current reduction in pine pulpwood inventory. (Note that the decrease in pine sawtimber removals from 2005-2014 was mirrored by a 27% increase in pine sawtimber inventory over this same period). However, USFS data shows that annual removals of pine sawtimber have increased 50% in the Georgia catchment area since 2014, which suggests that pine pulpwood inventory levels will start to increase in the catchment area due to increased harvest levels and the subsequent increase in stand reestablishment levels.

Timber growth rates

Neutral. Timber growth rates have increased for both pine sawtimber and pine chip-n-saw but decreased slightly for pine pulpwood in the catchment area since 2011. Evidence suggests that this decrease in pine pulpwood growth rate is not due to increases in bioenergy demand, but rather linked to changes in diameter class distribution and indicative of a forest in a state of transition, where timber is moving up in product class (i.e. pine pulpwood is moving up in classification to pine chip-n-saw).

Forest area

Neutral. In the Georgia catchment area, total forest area (timberland) decreased more than 115,000 hectares (-2.8%) from 2011 through 2018. Note that this decrease coincided with a roughly 19,000-hectare increase in cropland and 93,000-hectare increase in urban land and land classified as having other uses.

Specifically, pine timberland, the primary source of roundwood utilized by the bioenergy industry, decreased over 34,000 hectares from 2011-2016. However, from 2016-2018, pine timberland stabilized and rather increased more than 17,000 hectares in the catchment area (or a net decrease of roughly 17,000 hectares from 2011-2018). Ultimately, there is little evidence that the decrease in pine timberland from 2011-2016 or increase since 2016 is linked to increased bioenergy demand. Rather, the overall decrease in pine timberland since 2011 appears to be more closely linked to the relative weakness of pine sawtimber markets in the Georgia catchment area and the lack of return from sawtimber.

Wood prices

Positive / Negative. Intuitively, an increase in demand should result in an increase in price, and this is what the data shows in the Georgia catchment area as it relates to increased biomass demand from Georgia Biomass and Fram and the prices of the various raw materials consumed by these mills. Specifically, the 1.4-million metric ton increase in softwood pulpwood demand attributed to Georgia Biomass and Fram coincided with a 20% increase in delivered pine pulpwood price and a 10-15% increase in pine chip prices from 2011-2015. Since 2015, biomass demand has held relatively steady, and, overall, so too have delivered pine pulpwood and pine chip prices. The apparent link between increased bioenergy demand and increased pine raw material prices is supported further by statistical analysis, as strong positive correlations were found between softwood biomass demand and both delivered pine pulpwood and pine chip prices. However, note that biomass demand alone is not responsible for these changes in prices, as softwood biomass demand accounts for only 10-15% of total softwood pulpwood demand in the catchment area. Rather, the prices of these raw materials are impacted to a larger degree by demand from other sources (i.e. pulp/paper), which accounts for 85-90% of total softwood pulpwood demand in the Georgia catchment area.

On the other hand, it’s also important to note that the increase in bioenergy-related wood demand has been a positive for forest landowners in the Georgia catchment area. Not only has bioenergy provided an additional outlet for pulpwood in this market, but the increase in pulpwood prices as a result of increased pulpwood demand has transferred through to landowners (improved compensation). Specifically, since 2015, pine pulpwood (PPW) stumpage price – the price paid to landowners – has averaged more than $17 per ton in the Georgia catchment area. This represents a 70% increase over the approximately $10 per ton averaged by PPW stumpage in the catchment area over the last five years prior to Georgia Biomass’ startup in 2Q 2011.

(Note: Pine pulpwood stumpage prices are notably higher in the Georgia catchment area due to a much tighter balance in supply and demand (in comparison to most other markets across the US South). For instance, in all other areas across the US South2, PPW stumpage prices have averaged less than $9 per ton since 2015, or roughly half that of prices in the Georgia catchment area).

Markets for solid wood products

Positive. In the Georgia catchment area, demand for softwood sawlogs used to produce lumber and other solid wood products increased an estimated 39% from 2011-2019, and by-products of the sawmilling process are sawmill residuals – materials utilized by Georgia Biomass and the Fram mills to produce wood pellets. With the increased production of softwood lumber, so too has come an increase in sawmill residuals, some of which have been purchased/consumed by Georgia Biomass and Fram. Not only have these pellet producers benefited from the greater availability of this by-product, but lumber producers have also benefited, as the Georgia Biomass and Fram mills have provided an additional outlet for these producers and their by-products.

Read the full report: Georgia Biomass Catchment Area Analysis.

This is part of a series of catchment area analyses around the forest biomass pellet plants supplying Drax Power Station with renewable fuel. Others in the series include: ChesapeakeEstonia, Latvia and Drax’s own, other three mills LaSalle BionergyMorehouse Bioenergy and Amite Bioenergy.

Building back better by supporting negative emissions technologies

CCUS Incubation Unit, Drax Power Station
Rt Hon Rishi Sunak MP, Chancellor of the Exchequer
Rt Hon Alok Sharma MP, Secretary of State for Business, Energy & Industrial Strategy
Rt Hon George Eustice MP, Secretary of State for Environment, Food & Rural Affairs
Rt Hon Grant Shapps MP, Secretary of State for Transport
Rt Hon Michael Gove MP, Chancellor of the Duchy of Lancaster

Dear Chancellor, Secretaries of State,

Building back better by supporting negative emissions technologies

Today our organisations have launched a new coalition with a shared vision: to build back better as part of a sustainable and resilient recovery from Covid-19, by developing pioneering projects that can remove carbon dioxide (CO2) and other pollutants from the atmosphere. Together, we represent hundreds of thousands of workers across some of the UK’s most critical industries, including aviation, energy and farming, each of which contribute billions of pounds each year to the economy.

A growing number of independent experts, including the Committee on Climate Change, Royal Society and Royal Academy of Engineering and the Electricity System Operator, have recognised the crucial role of ‘negative emissions’ or ‘greenhouse gas removal’ technologies in fighting the climate crisis. Whilst we should seek to decarbonise sectors such as aviation, heavy industry and agriculture as far as practically possible, due to technical or commercial barriers it is unlikely we will eliminate their greenhouse gas emissions completely. Negative emissions technologies are critical therefore to balancing out these residual emissions and ensuring we achieve Net Zero in a credible, cost effective and sustainable way.

As well as benefiting the environment, negative emissions technologies and projects can build back a cleaner, greener economy in the wake of Covid-19. The foundations for this are already being laid by our coalition’s members today.

For example:

  • The National Farmers Union has set out a Net Zero vision for the agricultural sector whereby UK farmers harness the ability to capture carbon to create new income streams.
  • The aviation industry through the Sustainable Aviation initiative has identified negative emissions projects, alongside other measures as sustainable jet fuel, as being crucial to greening the industry.
  • In North Yorkshire, Drax is developing plans to combine sustainable biomass with carbon capture technology (BECCS) to create the world’s first carbon negative power station – supporting thousands of jobs in the process.
  • In North East Lincolnshire, Velocys with the support of British Airways is developing the Altalto waste-to-jet fuel project that could produce negative-emission jet fuel once the Humber industrial cluster’s carbon capture and storage infrastructure is established.
  • Finally, Carbon Engineering has announced a partnership with Pale Blue Dot Energy to deploy commercial-scale Direct Air Capture projects in the UK that would remove significant volumes of carbon dioxide from the atmosphere.

With COP26 fast approaching, there is a real and compelling opportunity for the UK Government to demonstrate to the world it is taking a leadership position on negative emissions. Conversely if the UK does not act quickly, it could jeopardise the delivery of projects in the 2020s that can support innovation, learning by doing and the scale-up of negative emissions in the 2030s. It also risks Britain falling behind in the race to scale and commercialise these technologies, with a view to exporting them to other countries around the world to support their own decarbonisation efforts.

We therefore call on this Government, supported by your departments, to pursue the following ‘low regrets’ interventions to support this critical emerging industry:

  1. Adopt a clear, unambiguous commitment to supporting negative emissions in the 2020s and beyond. The last significant reference to negative emissions by Government was in the 2017 Clean Growth Strategy. Between now and the end of the year there is a window of opportunity for the Government to go further, reflecting the changed reality of a Net Zero world and the growing consensus on the need for negative emissions. A clear signal of intent would also give greater confidence to investors and developers in negative emissions projects, in the absence of a long-term strategy.
  2. Develop targeted policies to support viable negative emissions projects in the 2020s. In order to scale up in the 2030s at a pace compatible with the UK’s climate commitments, it is essential that Government works with industry to bring forward early projects in the 2020s that are viable and represent value for money. However, there is no marketplace or regulatory regime in the UK today that incentivises or rewards negative emissions, making financing projects extremely challenging. Dedicated policy frameworks and business models for solutions such as afforestation, BECCS and Direct Air Capture are therefore urgently needed.
  3. Seize the opportunity to make negative emissions a point of emphasis at COP26. The UK has already led the way at a global level by adopting Net Zero as a legally binding target. At COP26, the UK can showcase its further commitment to continuous innovation around the decarbonisation agenda by signposting the early actions it has taken to deploy negative emissions – which other countries will also need to meet their own zero carbon ambitions. This statement would be particularly powerful as it can be credibly supported by several pioneering projects already being undertaken by British businesses and research organisations in this space.

We would welcome the opportunity to meet with each of you to discuss these points in further detail.

Yours,

The Coalition for Negative Emissions

carbon engineering logo carbon removal centre cbi logo
CCSA logo climeworks logo drax logo
energy uk logo heathrow logo iag logo
nfu logo velocys logo

View/download the letter as a PDF

Could hydrogen power stations offer flexible electricity for a net zero future?

Pipework in a chemical factory

We’re familiar with using natural gas every day in heating homes, powering boilers and igniting stove tops. But this same natural gas – predominantly methane – is also one of the most important sources of electricity to the UK. In 2019 gas generation accounted for 39% of Great Britain’s electricity mix. But that could soon be changing.

Hydrogen, the super simple, super light element, can be a zero-carbon emissions source of fuel. While we’re used to seeing it in everyday in water (H2O), as a gas it has been tested as an alternative to methane in homes and as a fuel for vehicles.

Could it also replace natural gas in power stations and help keep the lights on?

The need for a new gas

Car arriving at hydrogen gas station

Hydrogen fuel station

Natural gas has been the largest single source of electricity in Great Britain since around 2000 (aside from the period 2012-14 when coal made a resurgence due to high gas prices). The dominance of gas over coal is in part thanks to the abundant supply of it in the North Sea. Along with carbon pricing, domestic supply makes gas much cheaper than coal, and much cleaner, emitting as much as 60% less CO2 than the solid fossil fuel.

Added to this is the ability of gas power stations to start up, change their output and shut down very quickly to meet sudden shifts in electricity demand. This flexibility is helpful to support the growth of weather-dependant renewable sources of power such as wind or solar. The stability gas brings has helped the country decarbonise its power supply rapidly.

Hydrogen, on the other hand, can be an even cleaner fuel as it only releases water vapour and nitrous oxide when combusted in large gas turbines. This means it could offer a low- or zero-carbon, flexible alternative to natural gas that makes use of Great Britain’s existing gas infrastructure. But it’s not as simple as just switching fuels.

Switching gases

Some thermal power stations work by combusting a fuel, such as biomass or coal, in a boiler to generate intense heat that turns water into high-pressure steam which then spins a turbine. Gas turbines, however, are different.

Engineer works on a turbine at Drax Power Station

Instead of heating water into steam, a simple gas turbine blasts a mix of gas, plus air from the surrounding atmosphere, at high pressure into a combustion chamber, where a chemical reaction takes place – oxygen from the air continuously feeding a gas-powered flame. The high-pressure and hot gasses then spin a turbine. The reaction that takes place inside the combustion chamber is dependent on the chemical mix that enters it.

“Natural gas turbines have been tailored and optimised for their working conditions,” explains Richard Armstrong, Drax Lead Engineer.

“Hydrogen is a gas that burns in the same way as natural gas, but it burns at different temperatures, at different speeds and it requires different ratios of oxygen to get the most efficient combustion.”

Switching a power station from natural gas to hydrogen would take significant testing and refining to optimise every aspect of the process and ensure everything is safe. This would no doubt continue over years, subtly developing the engines over time to improve efficiency in a similar way to how natural gas combustion has evolved. But it’s certainly possible.

What may be trickier though is providing the supply of hydrogen necessary to power and balance the country’s electricity system. 

Making hydrogen

Hydrogen is the most abundant element in the universe. But it’s very rare to find it on its own. Because it’s so atomically simple, it’s highly reactive and almost always found naturally bonded to other elements.

Water is the prime example: it’s made up of two hydrogen atoms and one oxygen atom, making it H2O. Hydrogen’s tendency to bond with everything means a pure stream of it, as would be needed in a power station, has to be produced rather than extracted from underground like natural gas.

Hydrogen as a gas at standard temperature and pressure is known by the symbol H2.

A power station would also need a lot more hydrogen than natural gas. By volume it would take three times as much hydrogen to produce the same amount of energy as would be needed with natural gas. However, because it is so light the hydrogen would still have a lower mass.

“A very large supply of hydrogen would be needed, which doesn’t exist in the UK at the moment,” says Rachel Grima, Research & Innovation Engineer at Drax. “So, at the same time as converting a power plant to hydrogen, you’d need to build a facility to produce it alongside it.”

One of the most established ways to produce hydrogen is through a process known as steam methane reforming. This applies high temperatures and pressure to natural gas to break down the methane (which makes up the majority of natural gas) into hydrogen and carbon dioxide (CO2).

The obvious problem with the process is it still emits CO2, meaning carbon capture and storage (CCS) systems are needed if it is to be carbon neutral.

“It’s almost like capturing the CO2 from natural gas before its combusted, rather than post-combustion,” explains Grima. “One of the advantages of this is that the CO2 is at a much higher concentration, which makes it much easier to capture than in flue gas when it is diluted with a lot of nitrogen.”

Using natural gas in the process produces what’s known as ‘grey hydrogen’, adding carbon capture to make the process carbon neutral is known as ‘blue hydrogen’ – but there are ways to make it with renewable energy sources too.

Electrolysis is already an established technology, where an electrical current is used to break water down into hydrogen and oxygen. This ‘green hydrogen’ cuts out the CO2 emissions that come from using natural gas. However, like charging an electric vehicle, the process is only carbon-neutral if the electricity powering it comes from zero carbon sources, such as nuclear, wind and solar.

It’s also possible to produce hydrogen from biomass. By putting biomass under high temperatures and adding a limited amount of oxygen (to prevent the biomass combusting) the biomass can be gasified, meaning it is turned into a mix of hydrogen and CO2. By using a sustainable biomass supply chain where forests absorb the equivalent of the CO2 emitted but where some fossil fuels are used within the supply chain, the process becomes low carbon.

Carbon capture use and storage (CCUS) Incubation Area, Drax Power Station

Carbon capture use and storage (CCUS) Incubation Area, Drax Power Station

CCS can then be added to make it carbon negative overall, meaning more CO2 is captured and stored at forest level and in below-ground carbon storage than is emitted throughout its lifecycle. This form of ‘green hydrogen’ is known as bioenergy with carbon capture and storage (BECCS) hydrogen or negative emissions hydrogen.

There are plenty of options for making hydrogen, but doing it at the scale needed for power generation and ensuring it’s an affordable fuel is the real challenge. Then there is the issue of transporting and working with hydrogen.

“The difficulty is less in converting the UK’s gas power stations and turbines themselves. That’s a hurdle but most turbine manufacturers already in the process of developing solutions for this,” says Armstrong.

“The challenge is establishing a stable and consistent supply of hydrogen and the transmission network to get it to site.”

Working with the lightest known element

Today hydrogen is mainly transported by truck as either a gas or cooled down to minus-253 degrees Celsius, at which point it becomes a liquid (LH2). However, there is plenty of infrastructure already in place around the UK that could make transporting hydrogen significantly more efficient.

“The UK has a very advanced and comprehensive gas grid. A conversion to hydrogen would be more economic if you could repurpose the existing gas infrastructure,” says Hannah Steedman, Innovation Engineer at Drax.

“The most feasible way to feed a power station is through pipelines and a lot of work is underway to determine if the current natural gas network could be used for hydrogen.”

Gas stove

Hydrogen is different to natural gas in that it is a very small and highly reactive molecule,  therefore it needs to be treated differently. For example, parts of the existing gas network are made of steel, a metal which hydrogen reacts with, causing what’s known as hydrogen embrittlement, which can lead to cracks and failures that could potentially allow gas to escape. There are also factors around safety and efficiency to consider.

Like natural gas, hydrogen is also odourless, meaning it would need to have an odourant added to it. Experimentation is underway to find out if mercaptan, the odourant added to natural gas to give it a sulphuric smell, is also compatible with hydrogen.

But for all the challenges that might come with switching to hydrogen, there are huge advantages.

The UK’s gas network – both power generation and domestic – must move away from fossil fuels if it is to stop emitting CO2 into the atmosphere, and for the country to reach net zero by 2050. While the process will not be as simple as switching gases, it creates an opportunity to upgrade the UK’s gas infrastructure – for power, in homes and even as a vehicle fuel.

It won’t happen overnight, but hydrogen is a proven energy fuel source. While it may take time to ramp up production to a scale which can meet demand, at a reasonable cost, transitioning to hydrogen is a chance to future-proof the gas systems that contributes so heavily to the UK’s stable power system.

What are negative emissions?

Negative emissions

What are negative emissions?

In order to meet the long-term climate goals laid out in the Paris Agreement, there is a need to not only reduce the emission of harmful greenhouse gases into the air, but actively work to remove the excess carbon dioxide (CO2) currently in the atmosphere, and the CO2 that will continue to be emitted as economies work to decarbonise.

The process of greenhouse gas removal (GGR) or CO2 removal (CDR) from the atmosphere is possible through negative emissions, where more CO2 is taken out than is being put into the atmosphere. Negative emissions can be achieved through a range of nature-based solutions or through man-made technologies designed to remove CO2 at scale.

What nature-based solutions exist to remove CO2 from the atmosphere?

One millennia-old way of achieving negative emissions is forests. Trees absorb carbon when they grow, either converting this to energy and releasing oxygen, or storing it over their lifetime. This makes forests important tools in limiting and potentially reducing the amount of CO2 in the atmosphere. Planting new forests and regenerating forests has a positive effect on the health of the world as a result.

However, this can also go beyond forests on land. Vegetation underwater has the ability to absorb and store CO2, and seagrasses can in fact store up to twice as much carbon as forests on land – an approach to negative emissions called ‘blue carbon’.

Key negative emissions facts


Did you know?

Bhutan is the only carbon negative country in the world – its thick forests absorb three times the amount of CO2 the small country emits.

What man-made technologies can deliver negative emissions?

Many scientists and experts agree one of the most promising technologies to achieve negative emissions is bioenergy with carbon capture and storage (BECCS). This approach uses biomass – sourced from sustainably managed forests – to generate electricity. As the forests used to create biomass absorb CO2 while growing, the CO2 released when it is used as fuel is already accounted for, making the whole process low carbon.

By then capturing and storing any CO2 emitted (often in safe underground deposits), the process of electricity generation becomes carbon negative, as more carbon has been removed from the atmosphere than has been added.

Direct air carbon capture and storage (DACCS) is an alternative technological solution in which CO2 is captured directly from the air and then transported to be stored or used. While this could hold huge potential, the technology is currently in its infancy, and requires substantial investment to make it a more widespread practice.

The process of removing CO2 from the atmosphere is known as negative emissions, because more CO2 is being taken out of the atmosphere than added into it.

How much negative emissions are needed?

According to the Intergovernmental Panel on Climate Change, negative emissions technologies could be required to capture 20 billion tonnes of carbon annually to help prevent catastrophic changes in the climate between now and 2050.

Negative emissions fast facts

Go deeper