

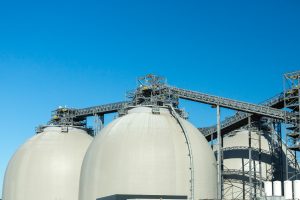


Pellet Sales
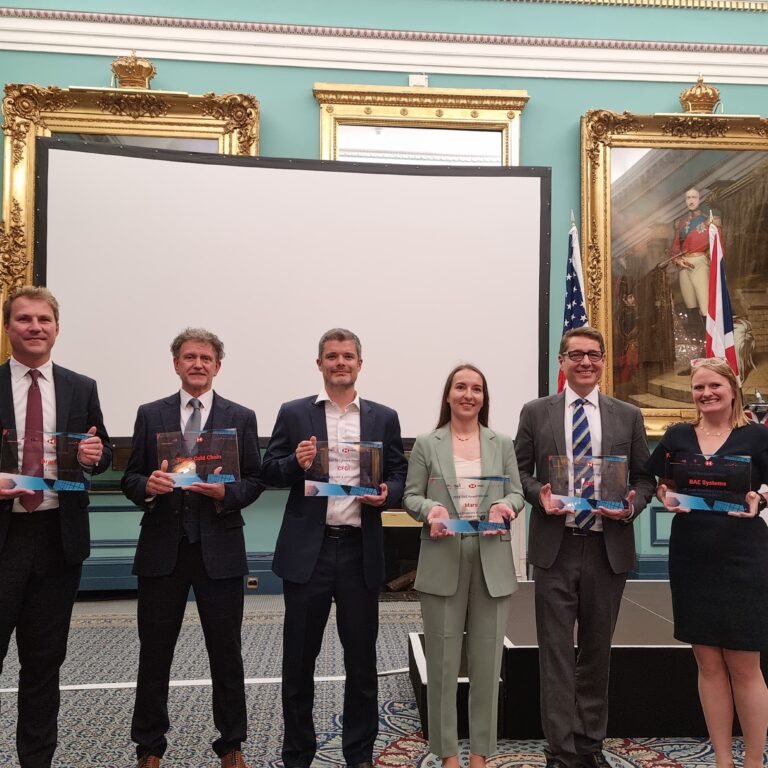
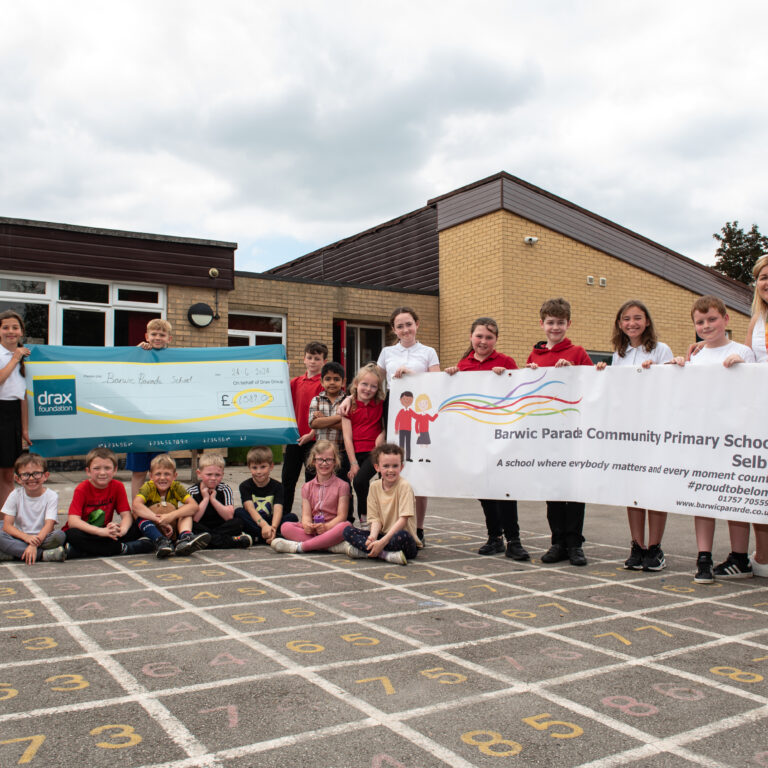
We believe investing in our people goes hand-in-hand with enabling the green energy transformation and positive future growth.
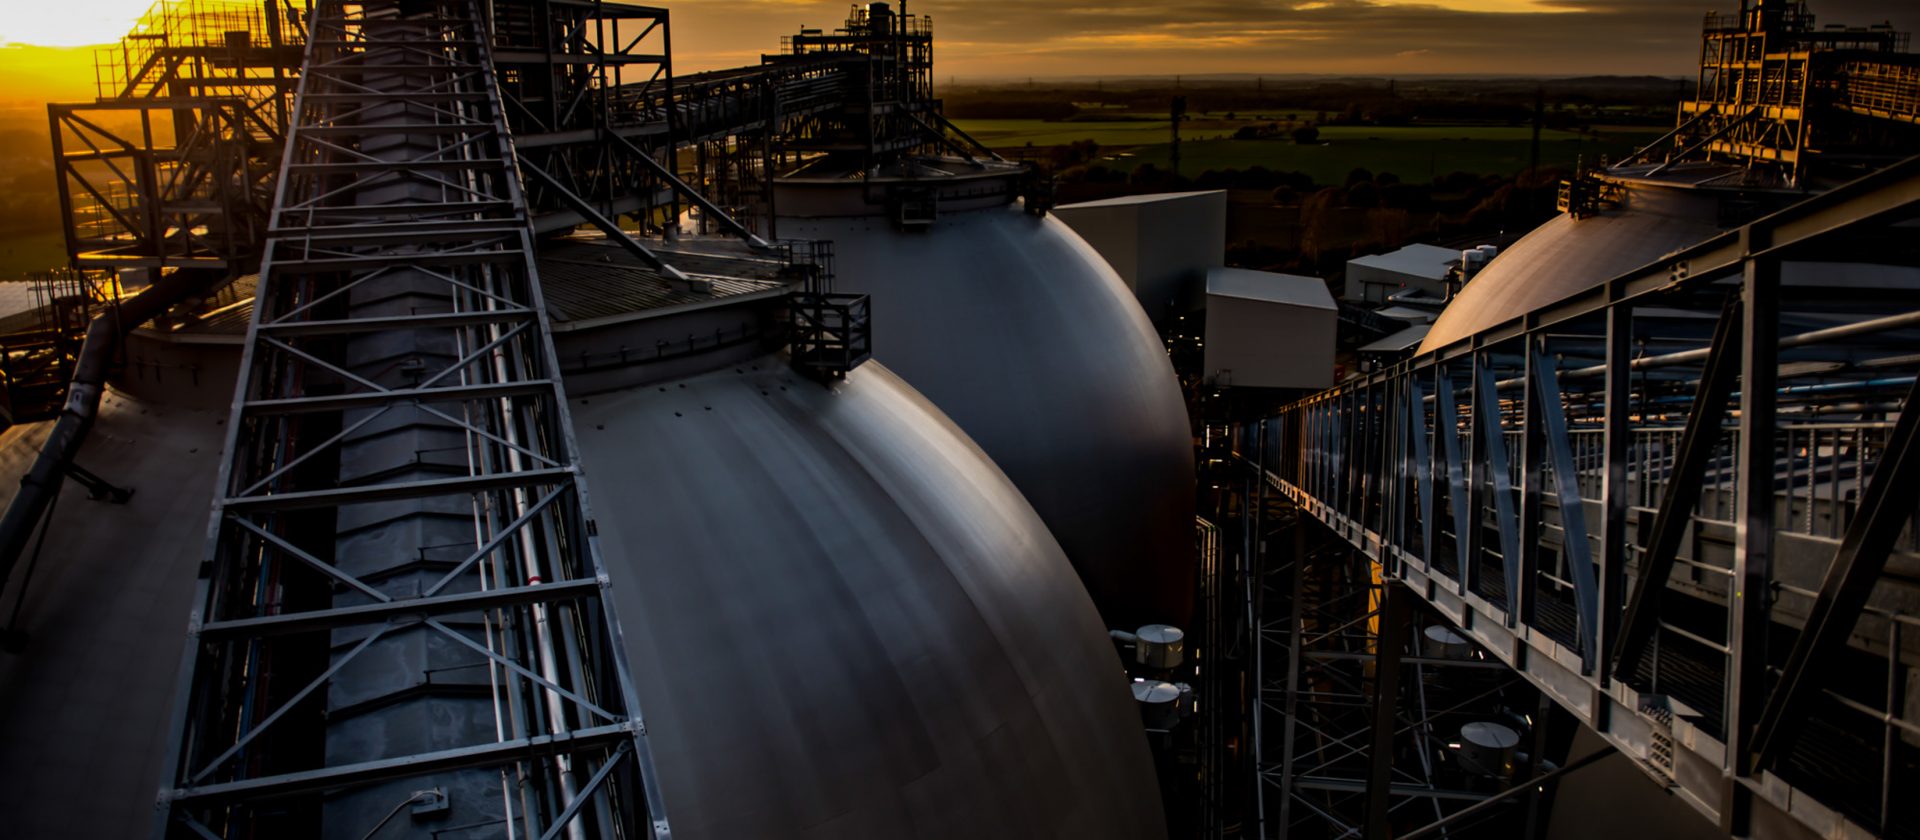
Energy Solutions
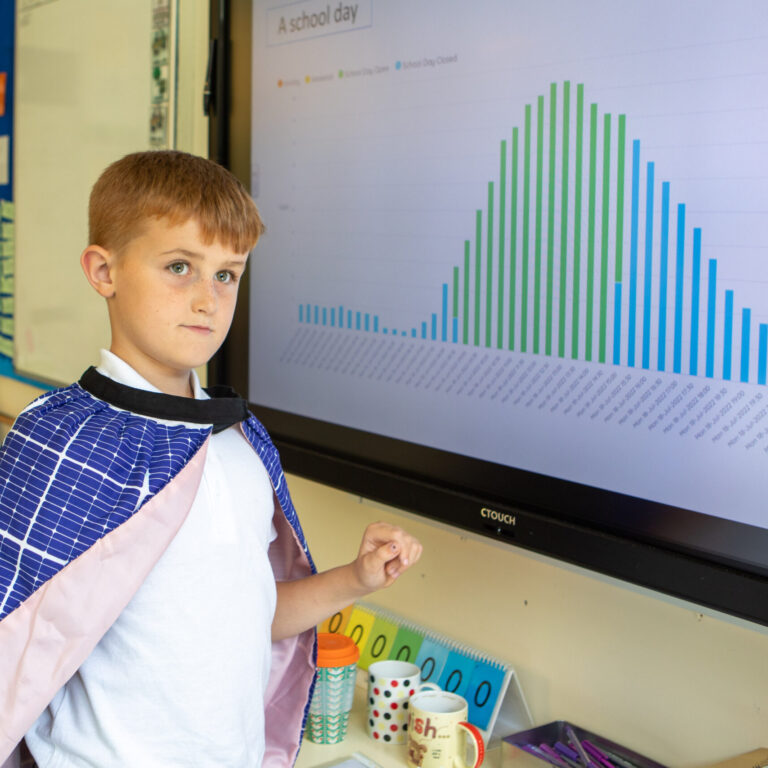
Information about our business, partnerships and campaigns, as well as photos, graphics and multimedia assets for journalists, and educational materials for schools.
Resources
Information about our business, partnerships and campaigns, as well as photos, graphics and multimedia assets for journalists, and educational materials for schools.
What We Do
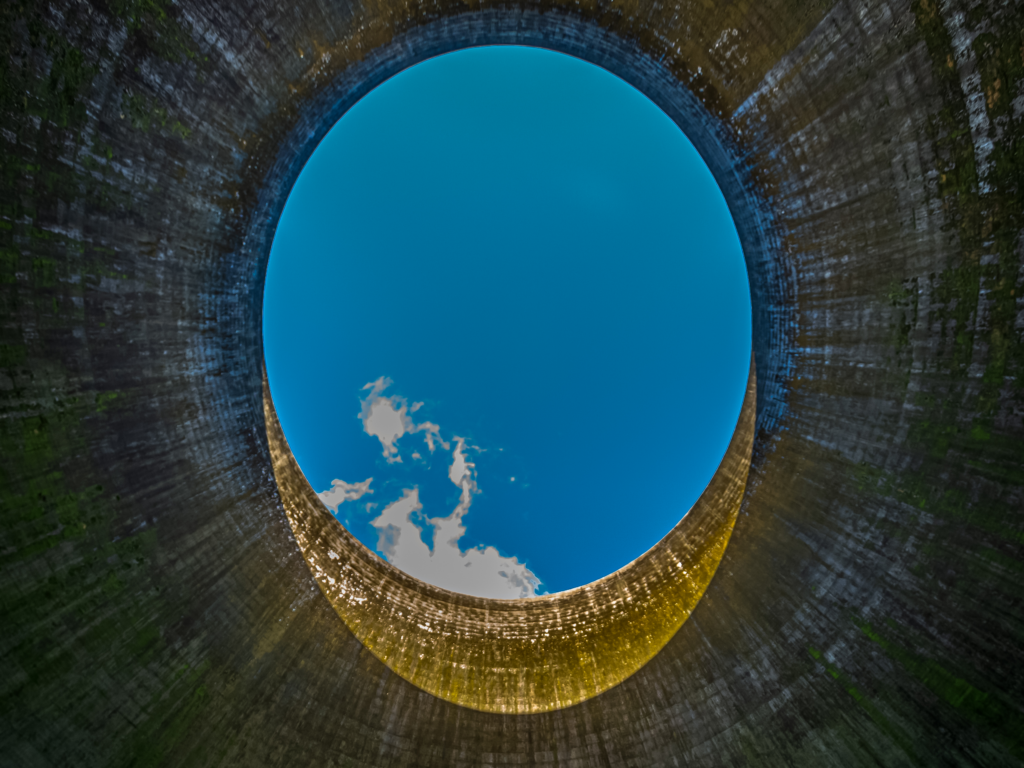
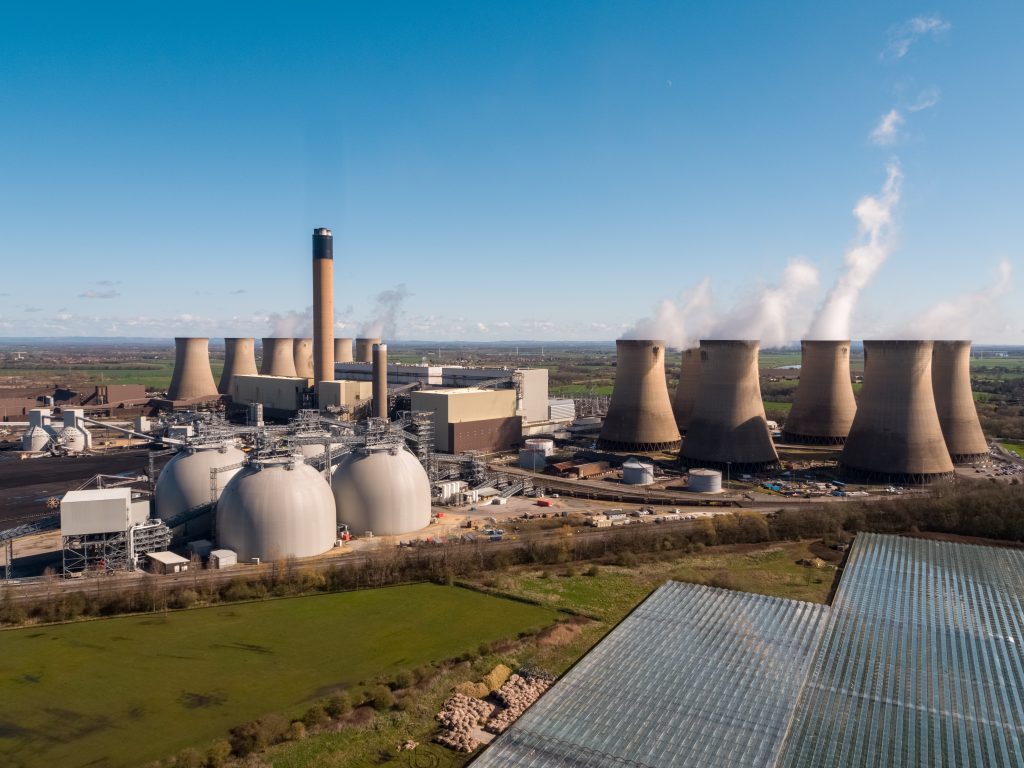
We’re committed to enabling a zero carbon, lower cost energy future through engineering, technology and innovation.
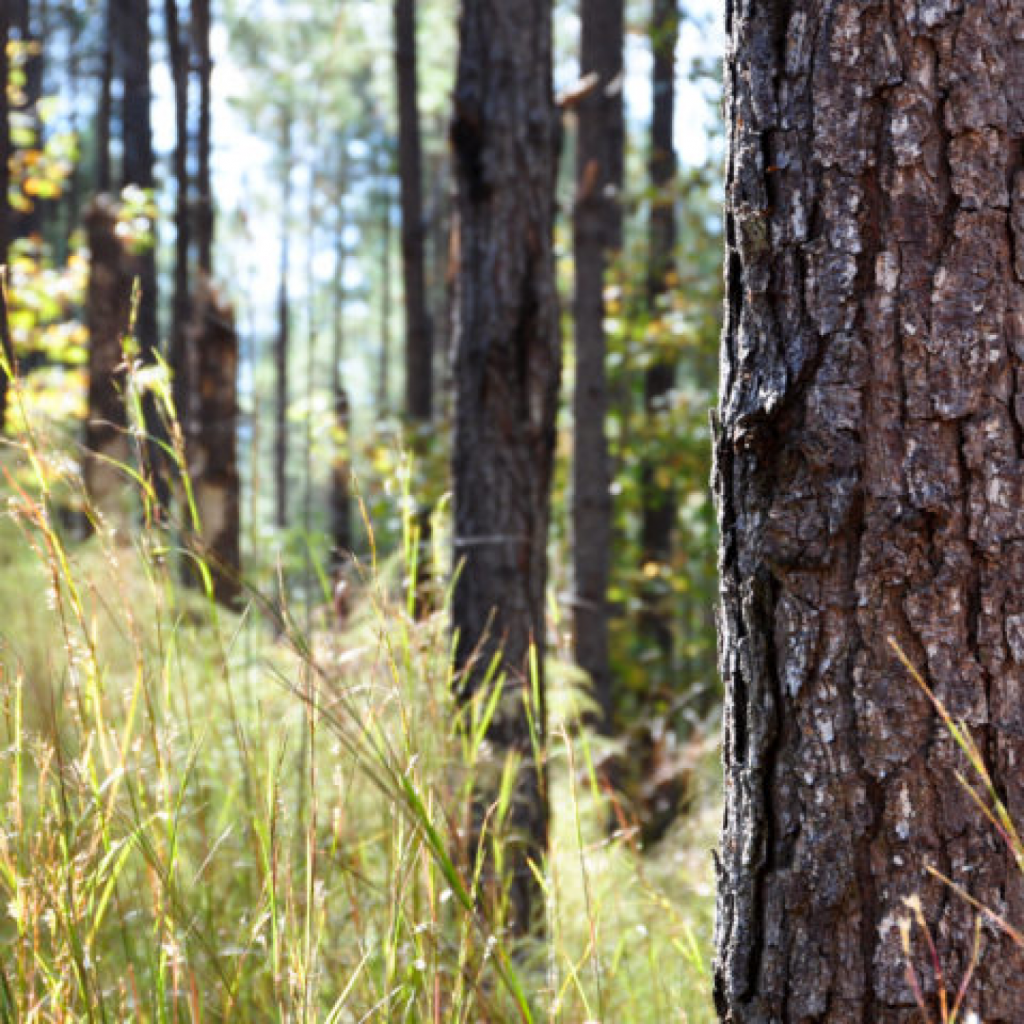
Sustainability
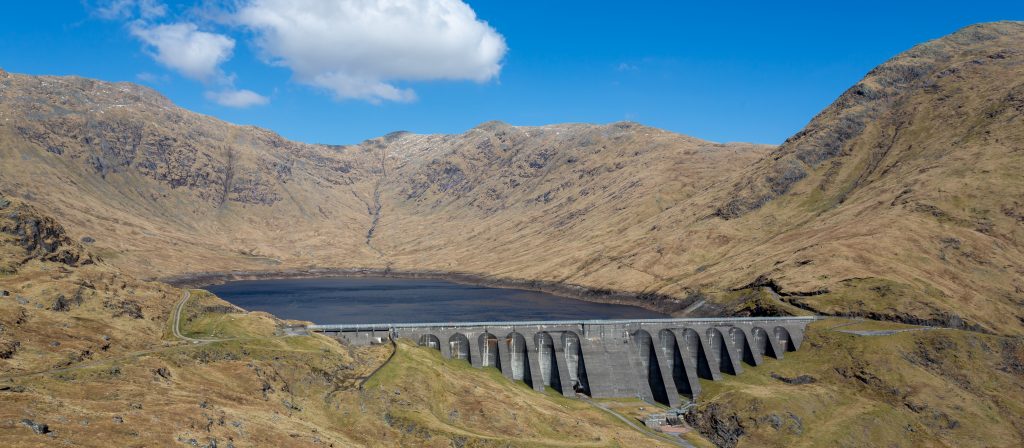
We’re building for a sustainable future in how we source our biomass, generate energy, remove carbon dioxide and function as a business.
News
Read our carbon capture, sustainable bioenergy and power generation stories, as well as thinking from Drax’s leaders and business updates.
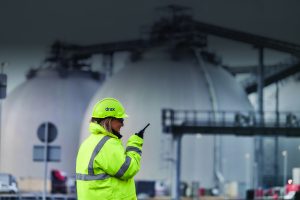
About Us
Drax Group’s ambition is to become a carbon negative business by 2030, through innovative greenhouse gas removal technology.