Tag: supply chain

Enviva Cottondale pellet plant catchment area analysis

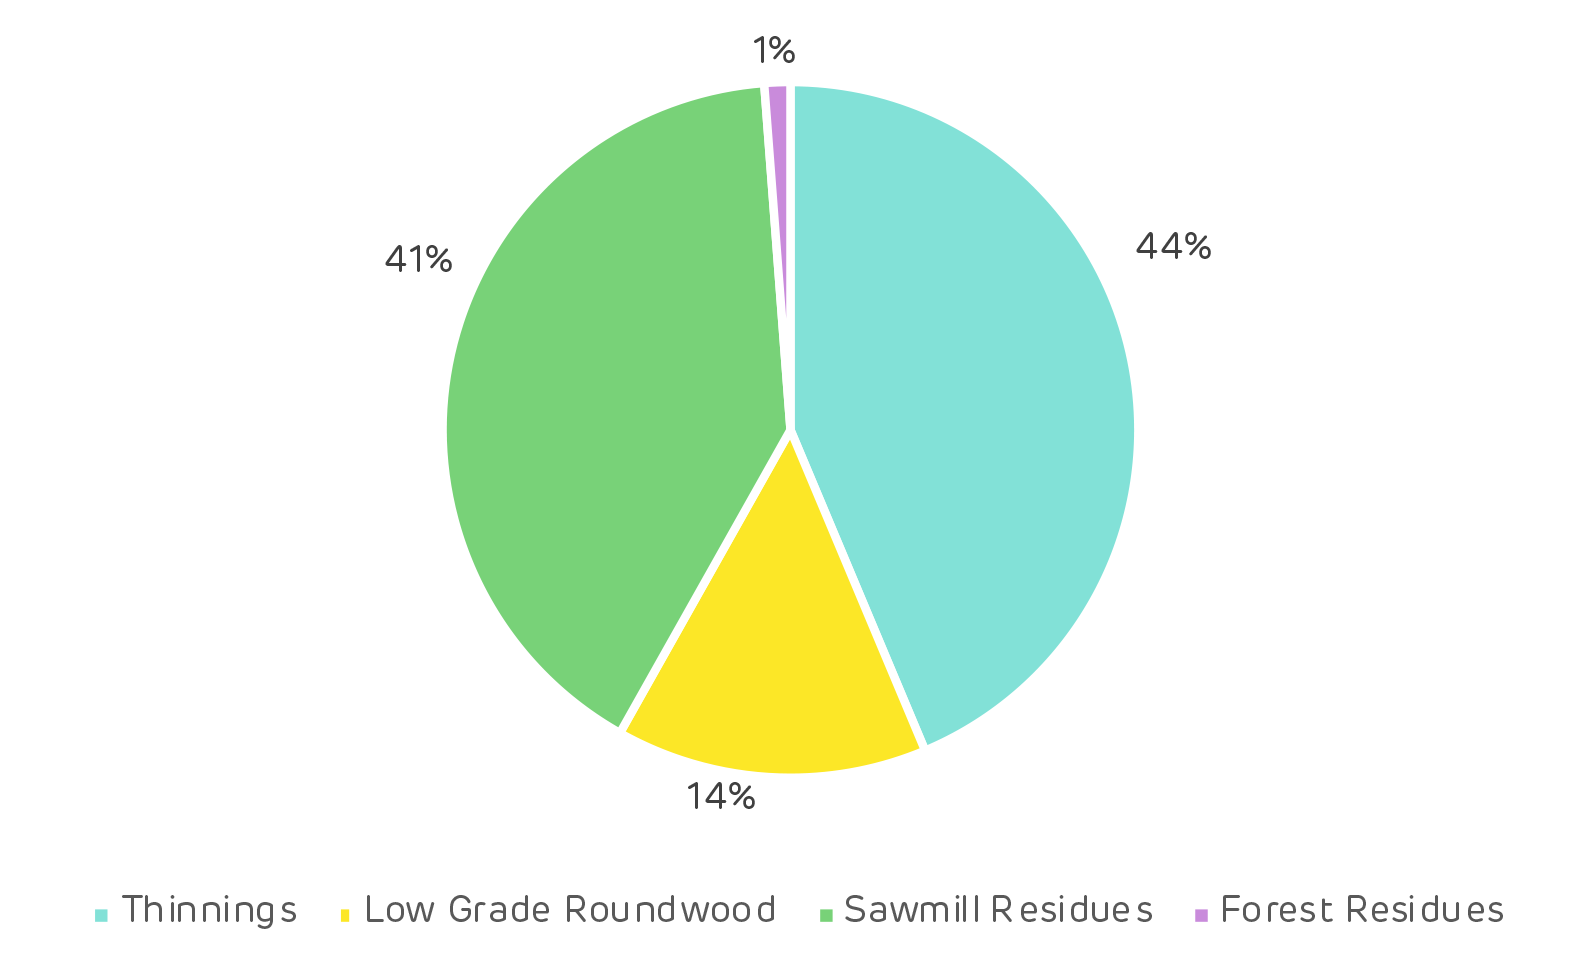
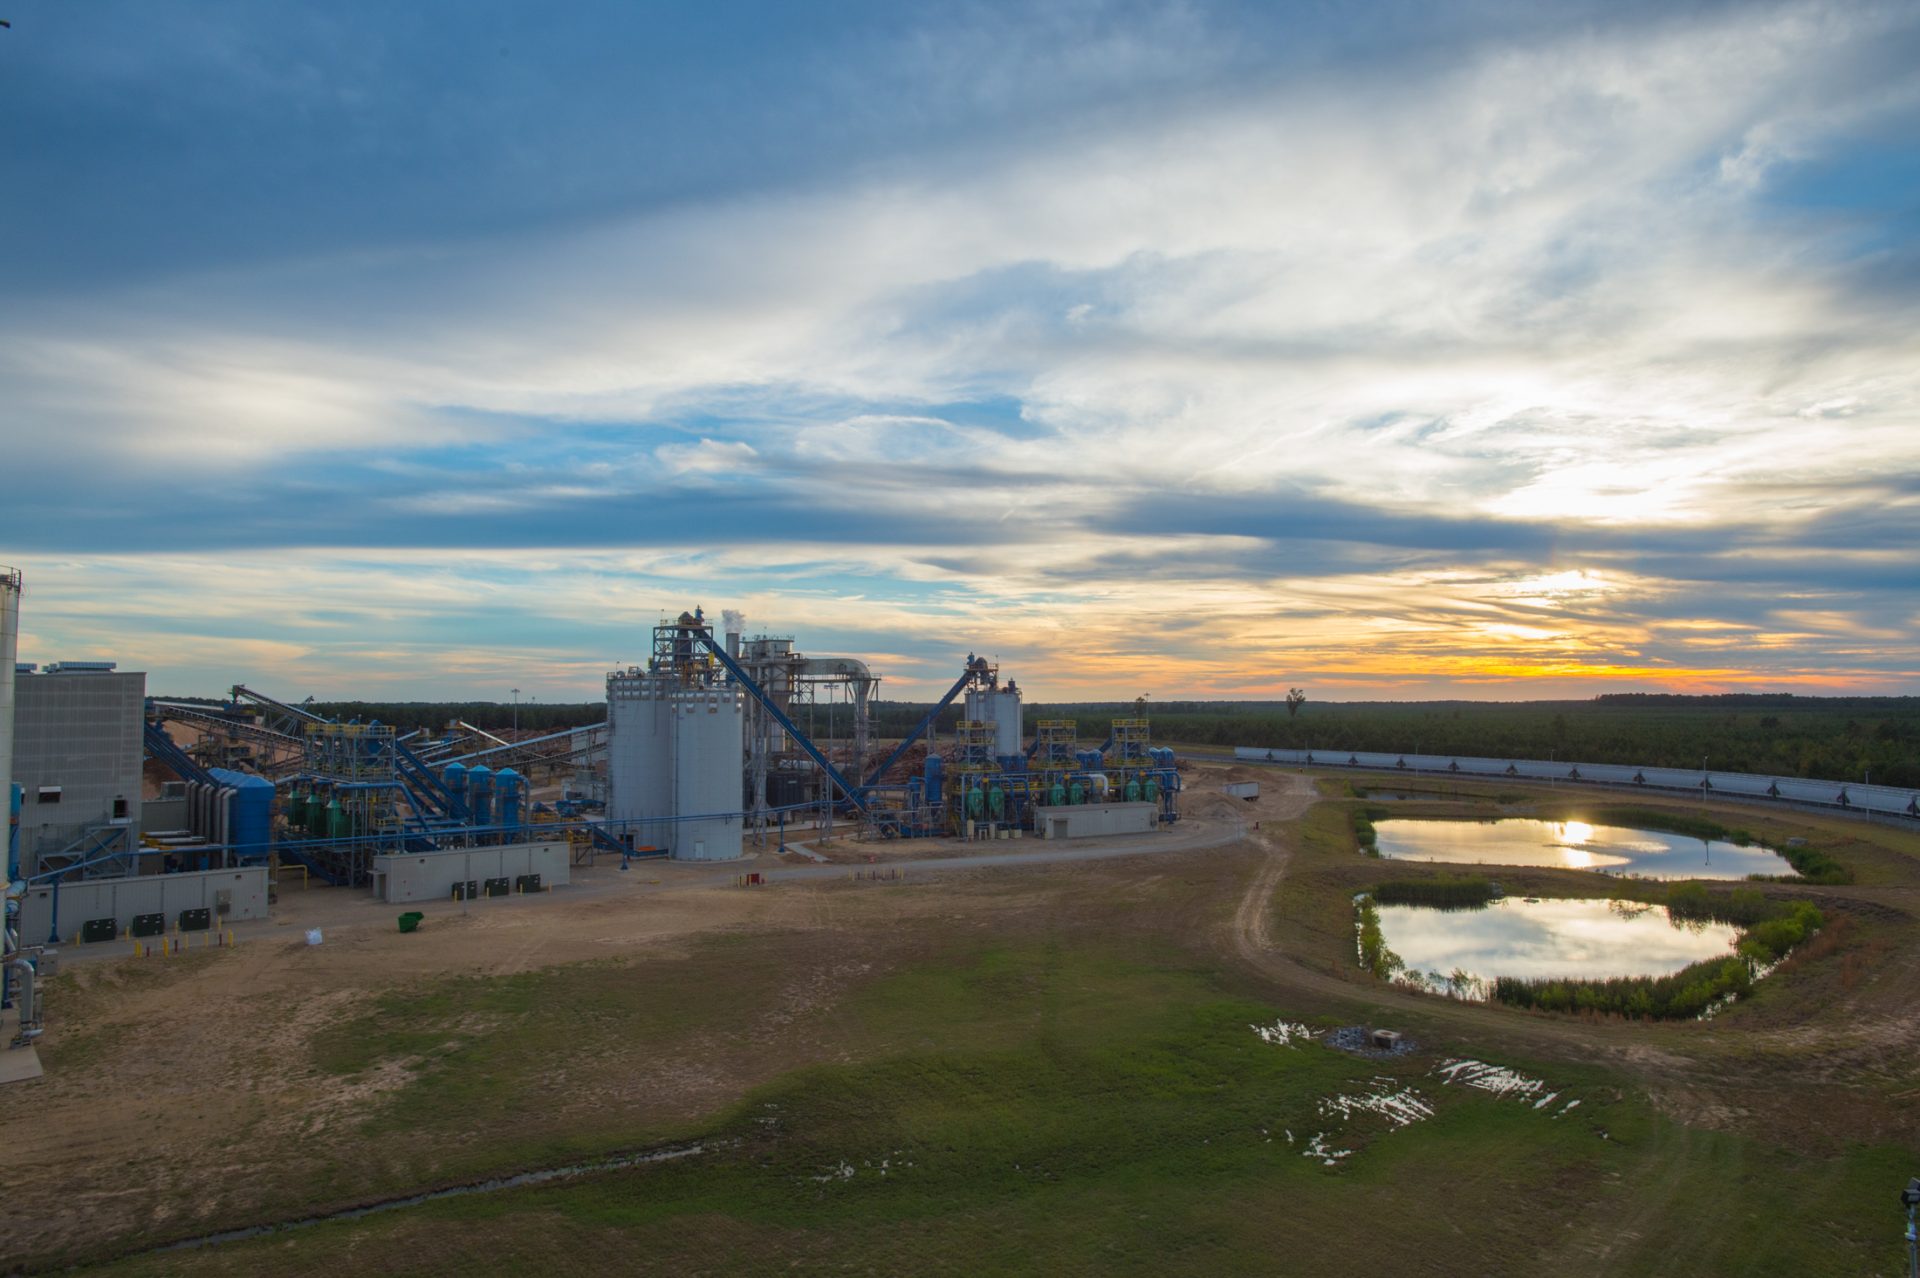
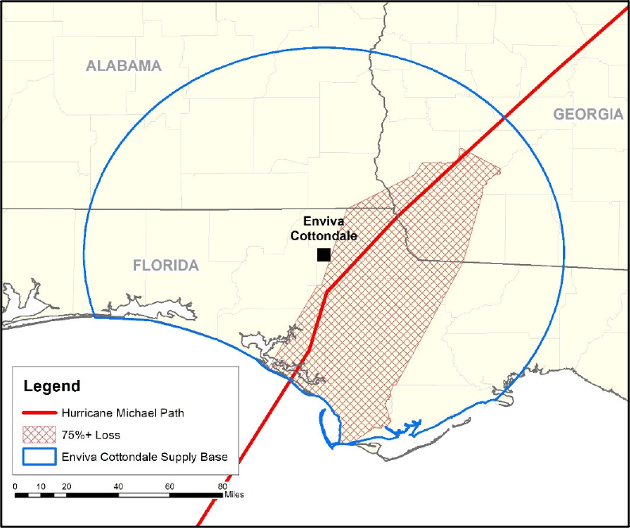
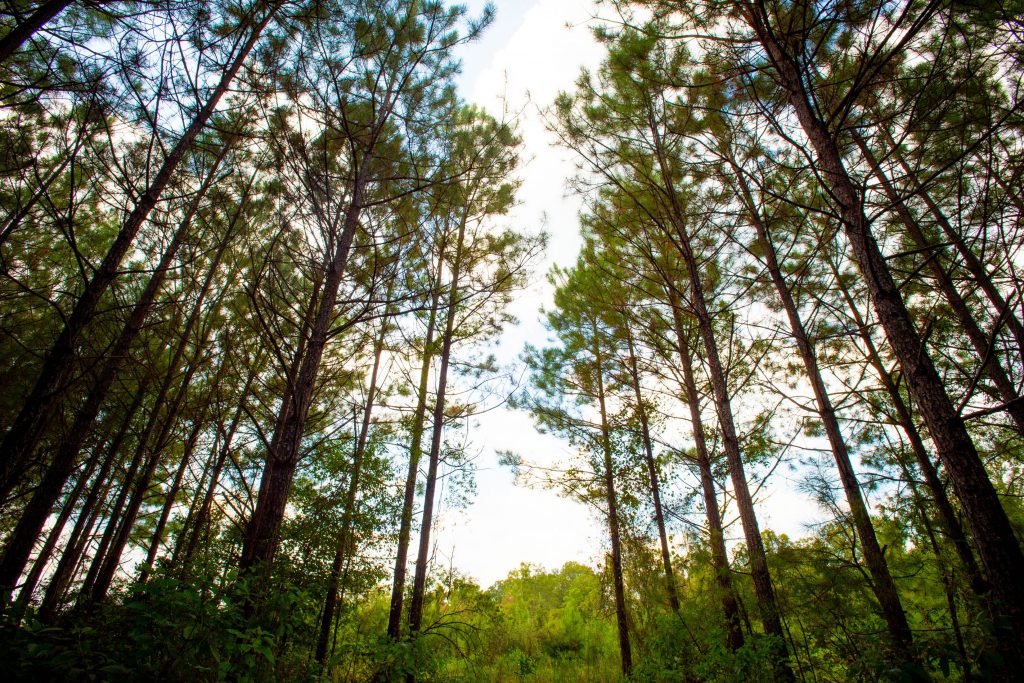
The Enviva Cottondale pellet mill has a production capacity of 760,000 metric tonnes of wood pellets annually. Raw material used by the mill includes a combination of roundwood, chips, and secondary residuals (i.e., sawdust and shavings), with pine accounting for 80‐90% of total feedstock. In October 2018, Hurricane Michael passed through the centre of the Cottondale catchment area, causing significant damage to the forest resource with more than 500,000 hectares (ha) of forestland destroyed and an estimated loss of 42 million m3of timber (equivalent to around 4 times the UK annual production of roundwood).

This event has had an impact on the data trends for forest inventory, growth and harvesting removals – as harvesting levels were increased to salvage as much timber as possible before it became unusable due to decay. This can be clearly seen in many of the charts below. However, these forest areas have been restored and now continue to grow, allowing the catchment area to return to its pre-hurricane trends in the medium term.

Forest Area 

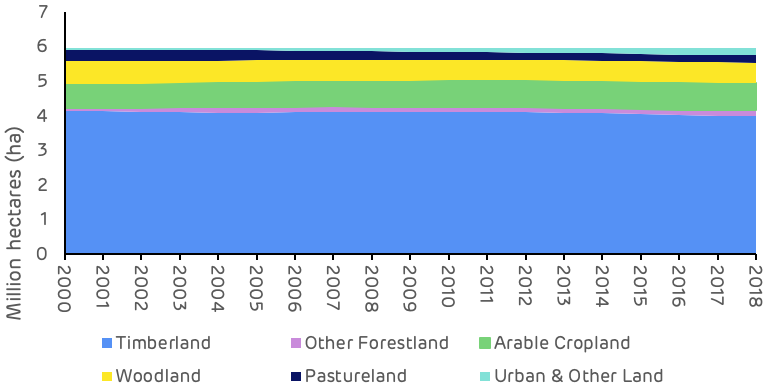
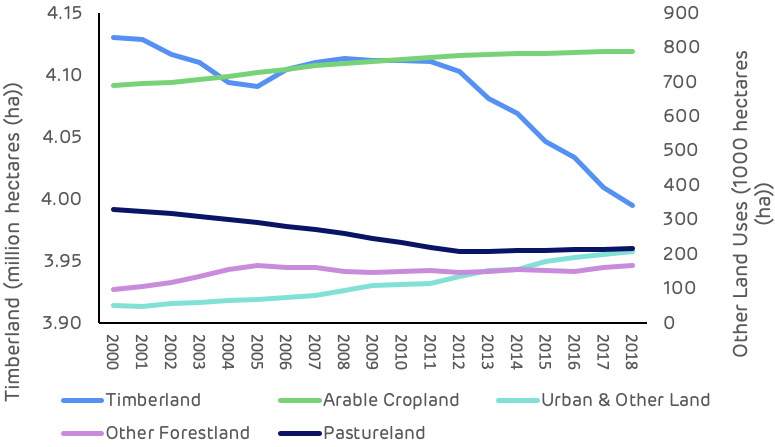
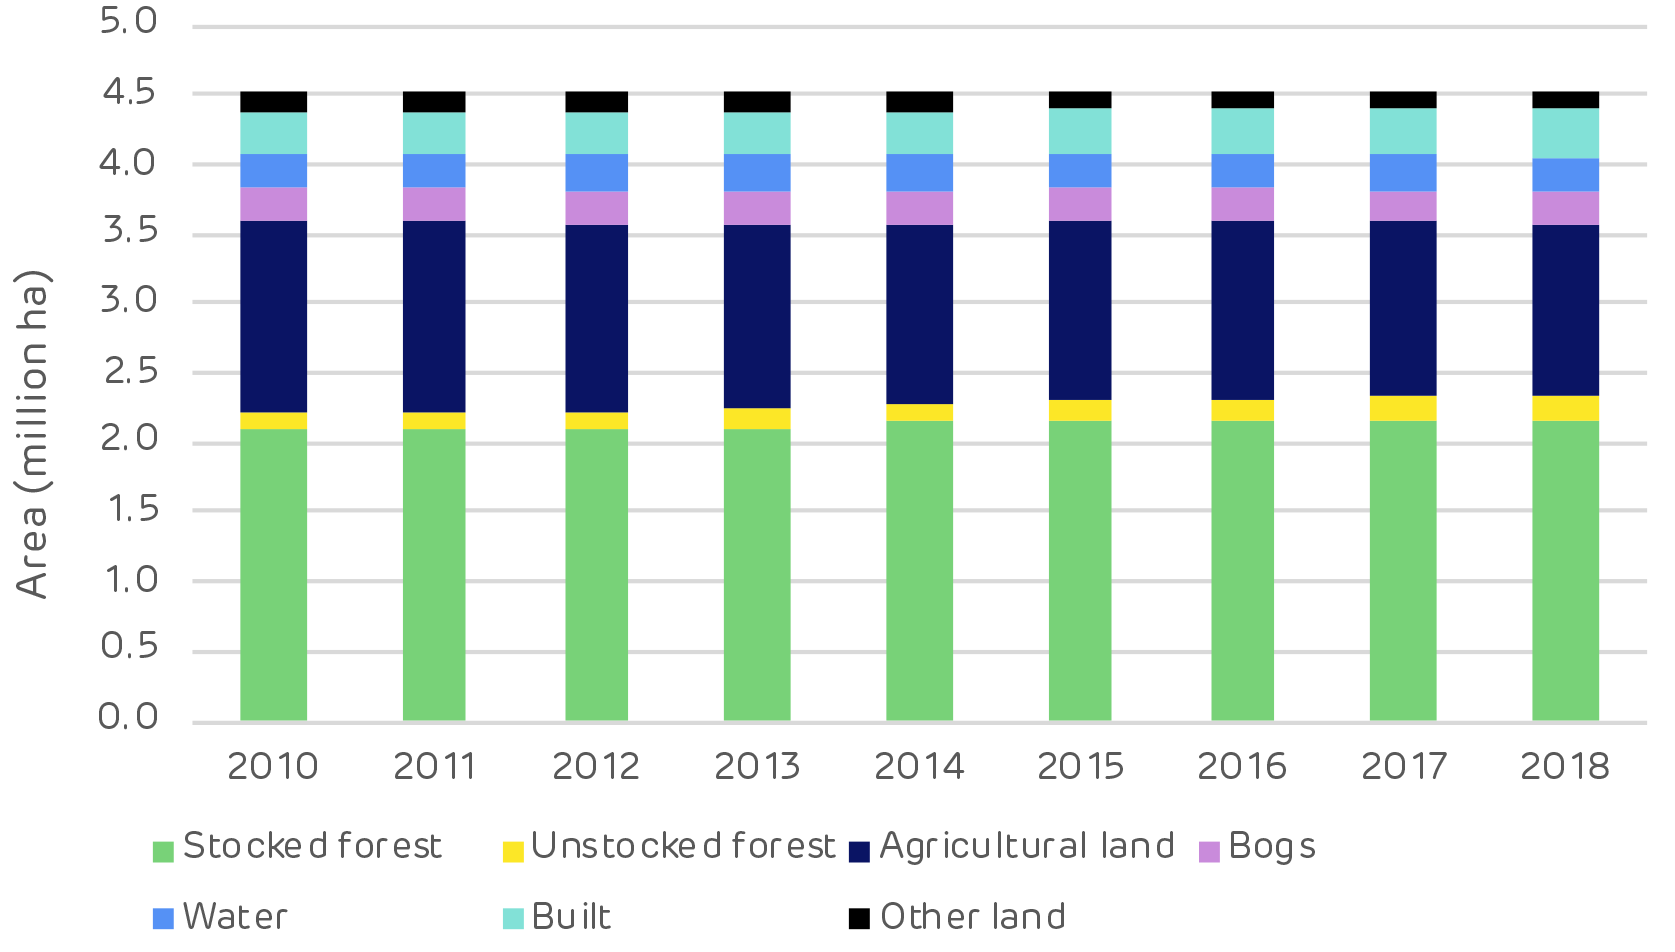
The catchment area around Enviva’s Cottondale pellet mill includes 4.3 million ha of land, based on the historical feedstock sourcing patterns of the mill. Timberland represents 68.7% (2.95 million ha) of the total land area in the Cottondale catchment area, this has increased slightly since 2000 from 67.8% and can be considered to have remained stable over this time period.  There are also around 300,000 ha of woodland (associated with agricultural land) and around 800,000 ha of cropland and pastureland.  Forestry is the dominant land use in this catchment area (Figure 1).

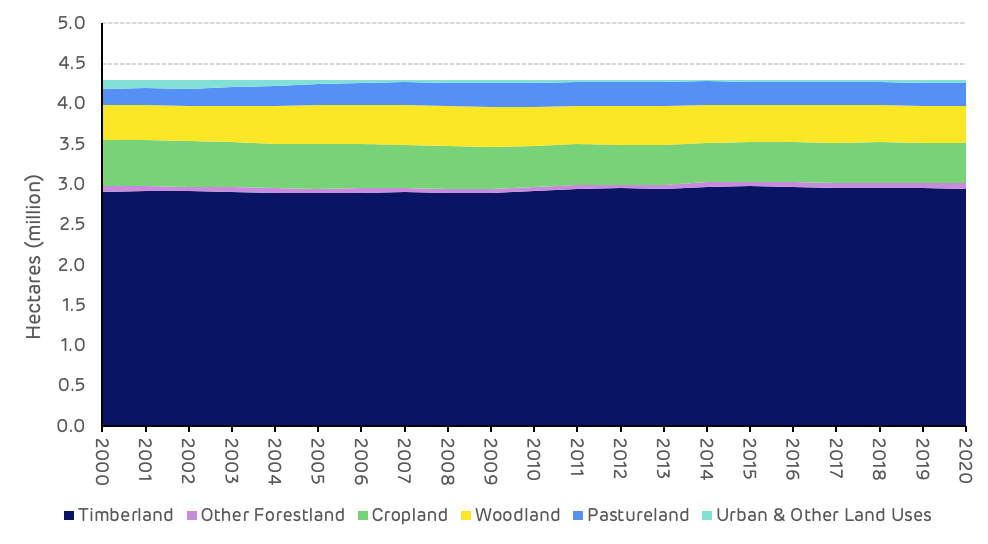
Figure 1: Land area by usage

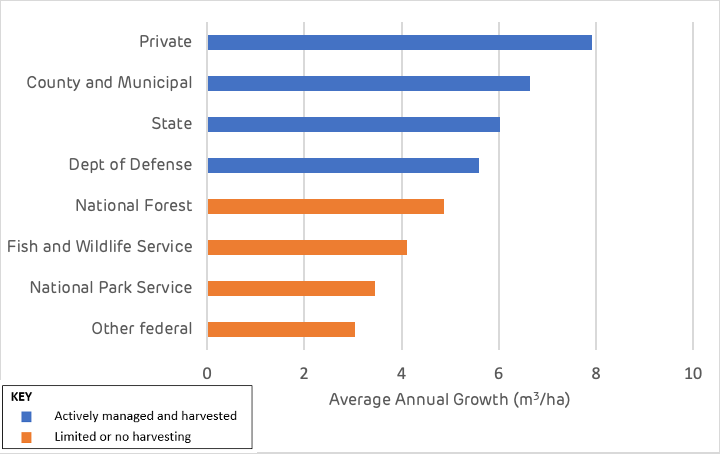
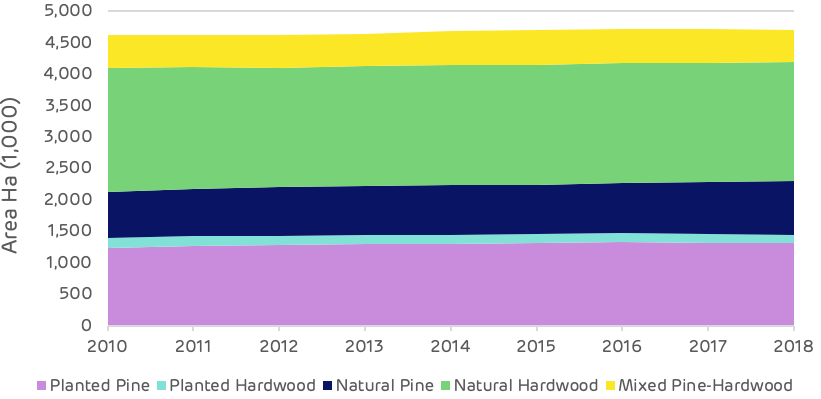
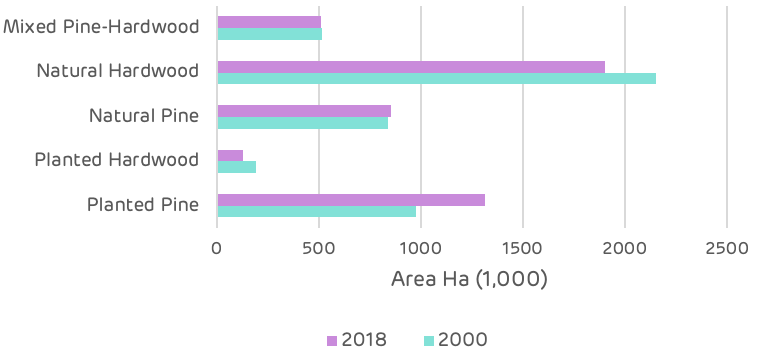
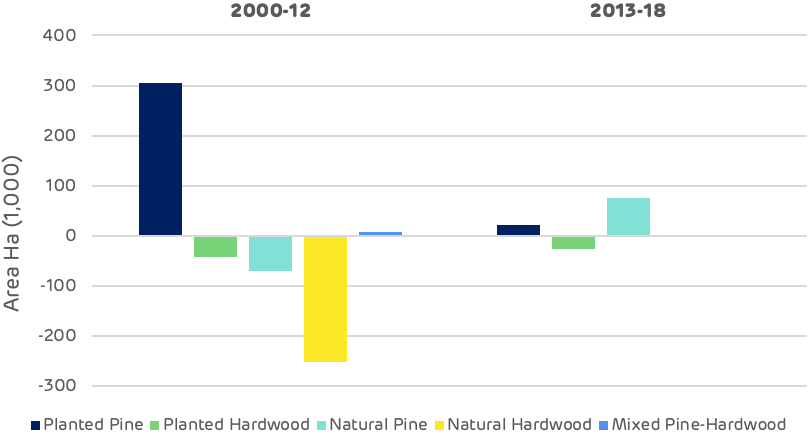
Planted pine represents 33% of the timberland area, natural pine 20%, with 10% mixed stands and the remainder being hardwood forest of which 94% is naturally regenerated (Figure 2).  The breakdown of forest type and species composition has remained relatively stable and largely unchanged over the last 20 years, in contrast to other parts of the US South where some natural pine stands have been converted to planted pine. The pine and mixed forest areas are actively managed and produce the majority of the timber harvest in the catchment area. Despite the large area of hardwood forest, management and timber production is limited. Much of this area is classified as bottomland hardwood located alongside rivers, streams, and creeks and in streamside management zones (SMZs), which restricts active management. In addition, the proportion of this catchment area located in Florida contains a large area of swampland, which is largely composed of hardwoods and cannot be actively managed for timber production and is recognised as having important ecological value.

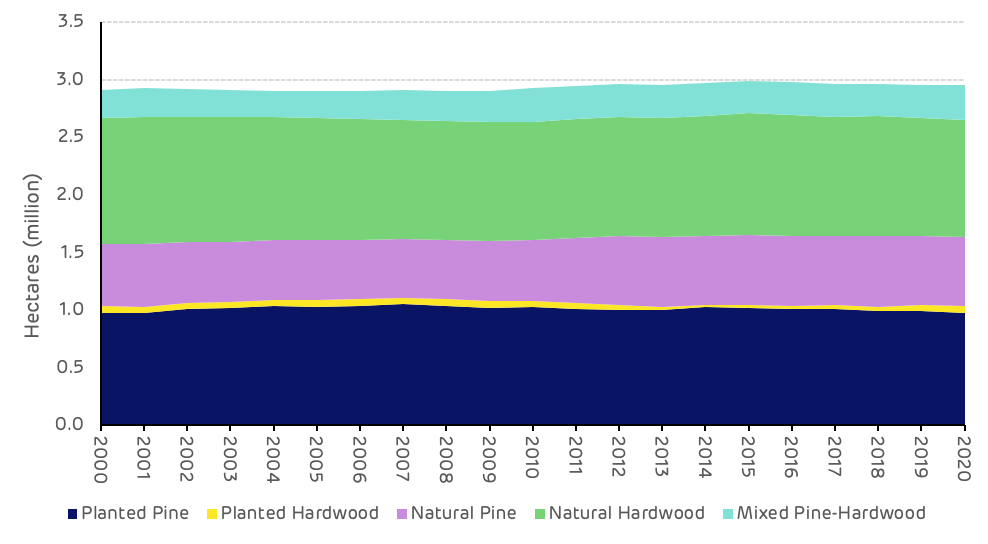
Figure 2: Breakdown of forest type

Volume and Growth

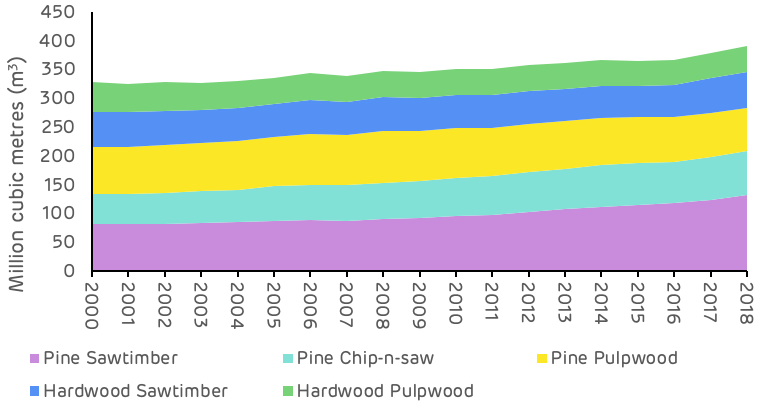
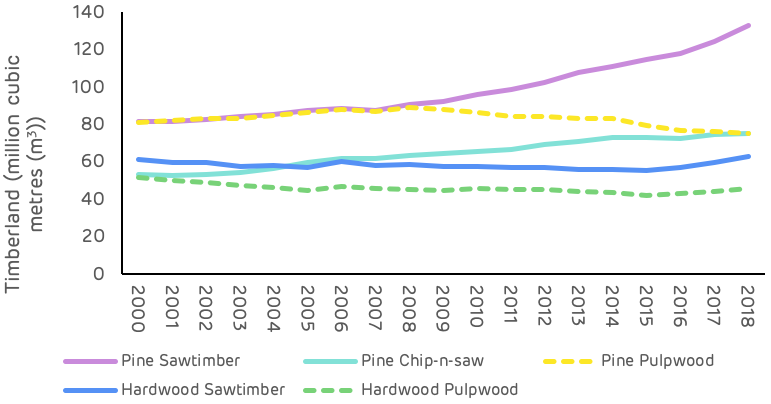
The overall trend of volume and growth in the Cottondale catchment area is of a maturing forest resource and an increasing accumulation of standing volume, particularly in the larger forest product classes (saw-timber and chip-n-saw). Figure 3 shows that total standing volume increased by 64 million m3 from 2000 to 2018, with the largest increases in the pine saw-timber and chip-n-saw categories. In 2018, the devastating impact of Hurricane Michael caused a substantial reduction in the standing volume across every product category with the total standing volume being reduced by 42 million m3. This event has had a significant impact on the forest resource and is a primary cause of recent data trends.

However, the overall long-term trend in the catchment area is of maturing forest and increasing inventory. This should continue in the long-term once the impact of the hurricane damage has been managed and replacement forest areas begin to mature.

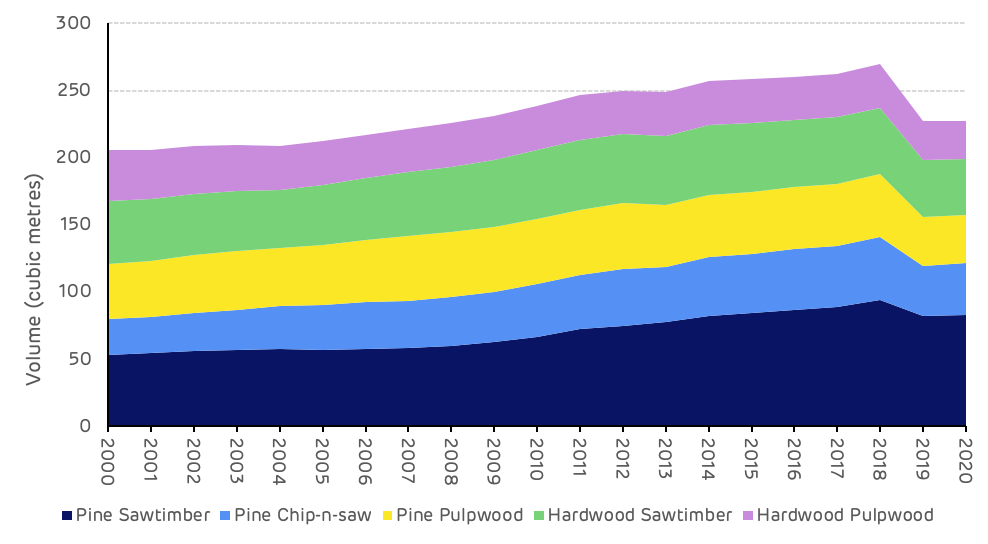
Figure 3: Standing volume by product category

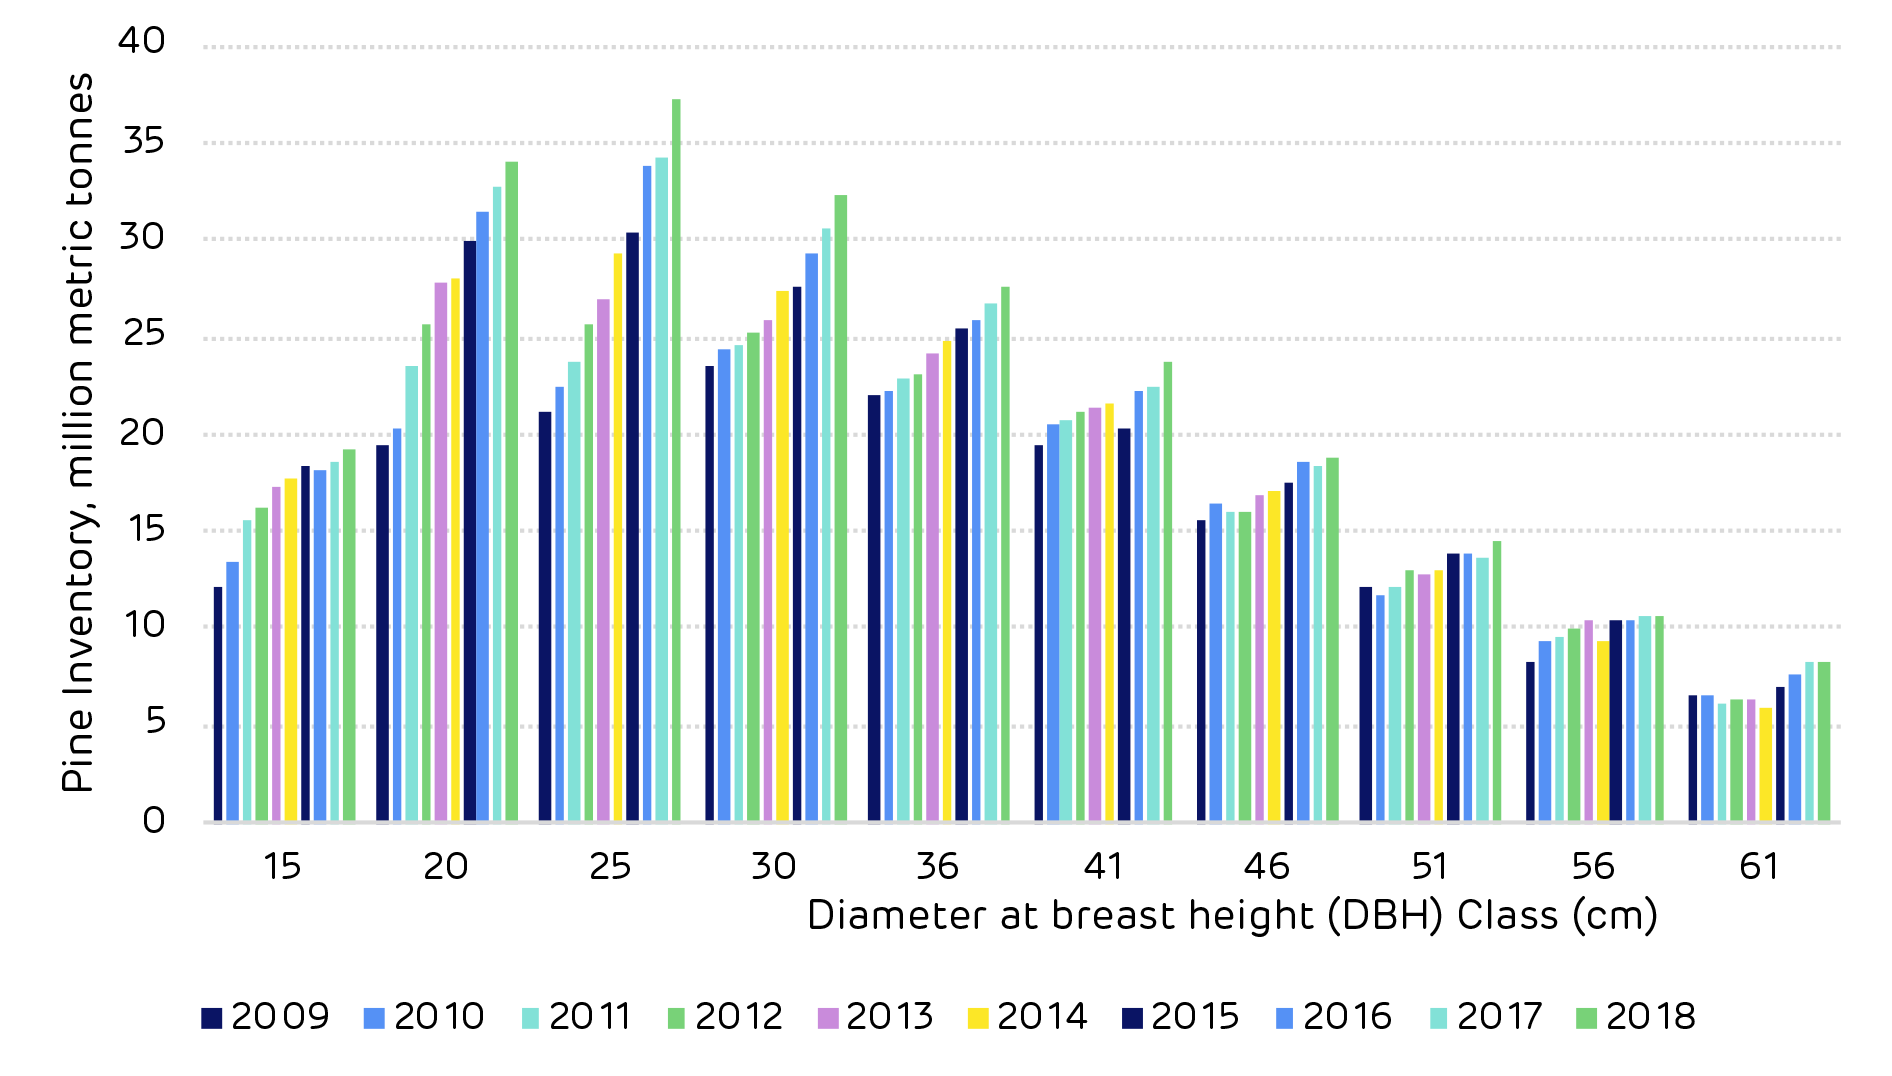
Pine pulpwood inventory increased steadily by around 8 million m3 from 2000 to 2013, reaching a peak of 49 million m3. This then declined slightly to 46 million m3 in 2018 due to the maturing age class of the forest and pulpwood forest growing into the larger size class of chip-n-saw and saw-timber forest (Figure 4), in addition to an increase in pulpwood demand as biomass markets became operational and ramped up production. Following the hurricane in 2018, the pine pulpwood inventory dropped by more than 10 million m3. 

Replanting and reforestation of damaged areas will ensure that future pine pulpwood production will increase again once these forests start to mature.

In the period from 2000 to 2018 pine sawtimber standing volume increased by 41.5 million m3 (78%) and chip-n-saw by 19.6 million m3 (73%), indicating a maturing age class and a growing forest resource. The 2018 hurricane caused a reduction in standing volume in both of these product categories of 11.6 and 8 million m3respectively (12% and 17% of the 2018 volume). However, the increasing trend is likely to continue once the forest area recovers.

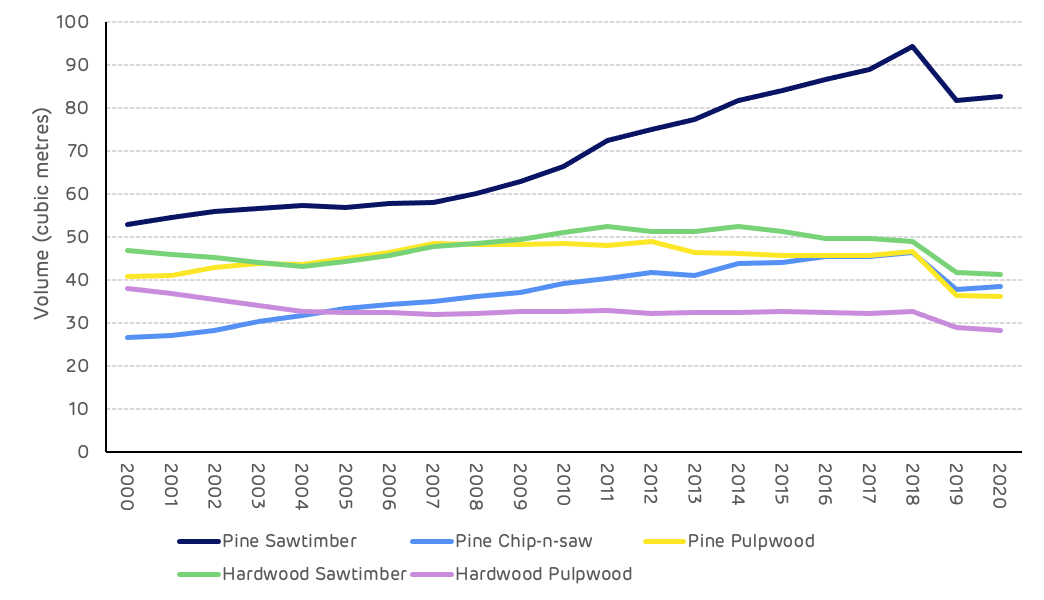
Figure 4: Standing volume by product category

The growth drain ratio (GDR) is the comparison of average annual growth to removals (typically harvesting), where the growth exceeds removals the GDR will be in excess of 1 and this is considered sustainable, where removals exceed growth then the GDR will be less than 1 and this is not sustainable if maintained in the long-term – although in the short-term this can be a factor of large areas of mature forest with low growth rates and high rates of harvesting, short periods of high demand for a particular product or salvage harvesting after a natural disturbance. The GDR should be considered over a longer time period to ensure it reflects the long-term trend. In the period from 2003 to 2020 the combined GDR for pine products averaged 1.52 with a high of 1.84 and a low of 1.08 (Figure 5).

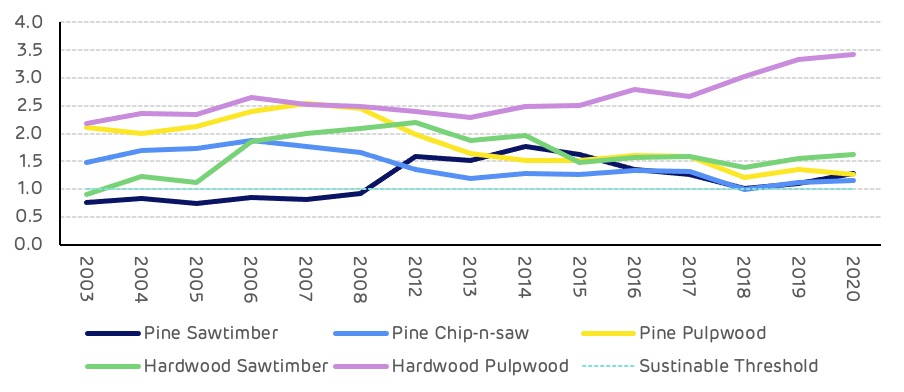
Figure 5: Growth to drain ratio by product category

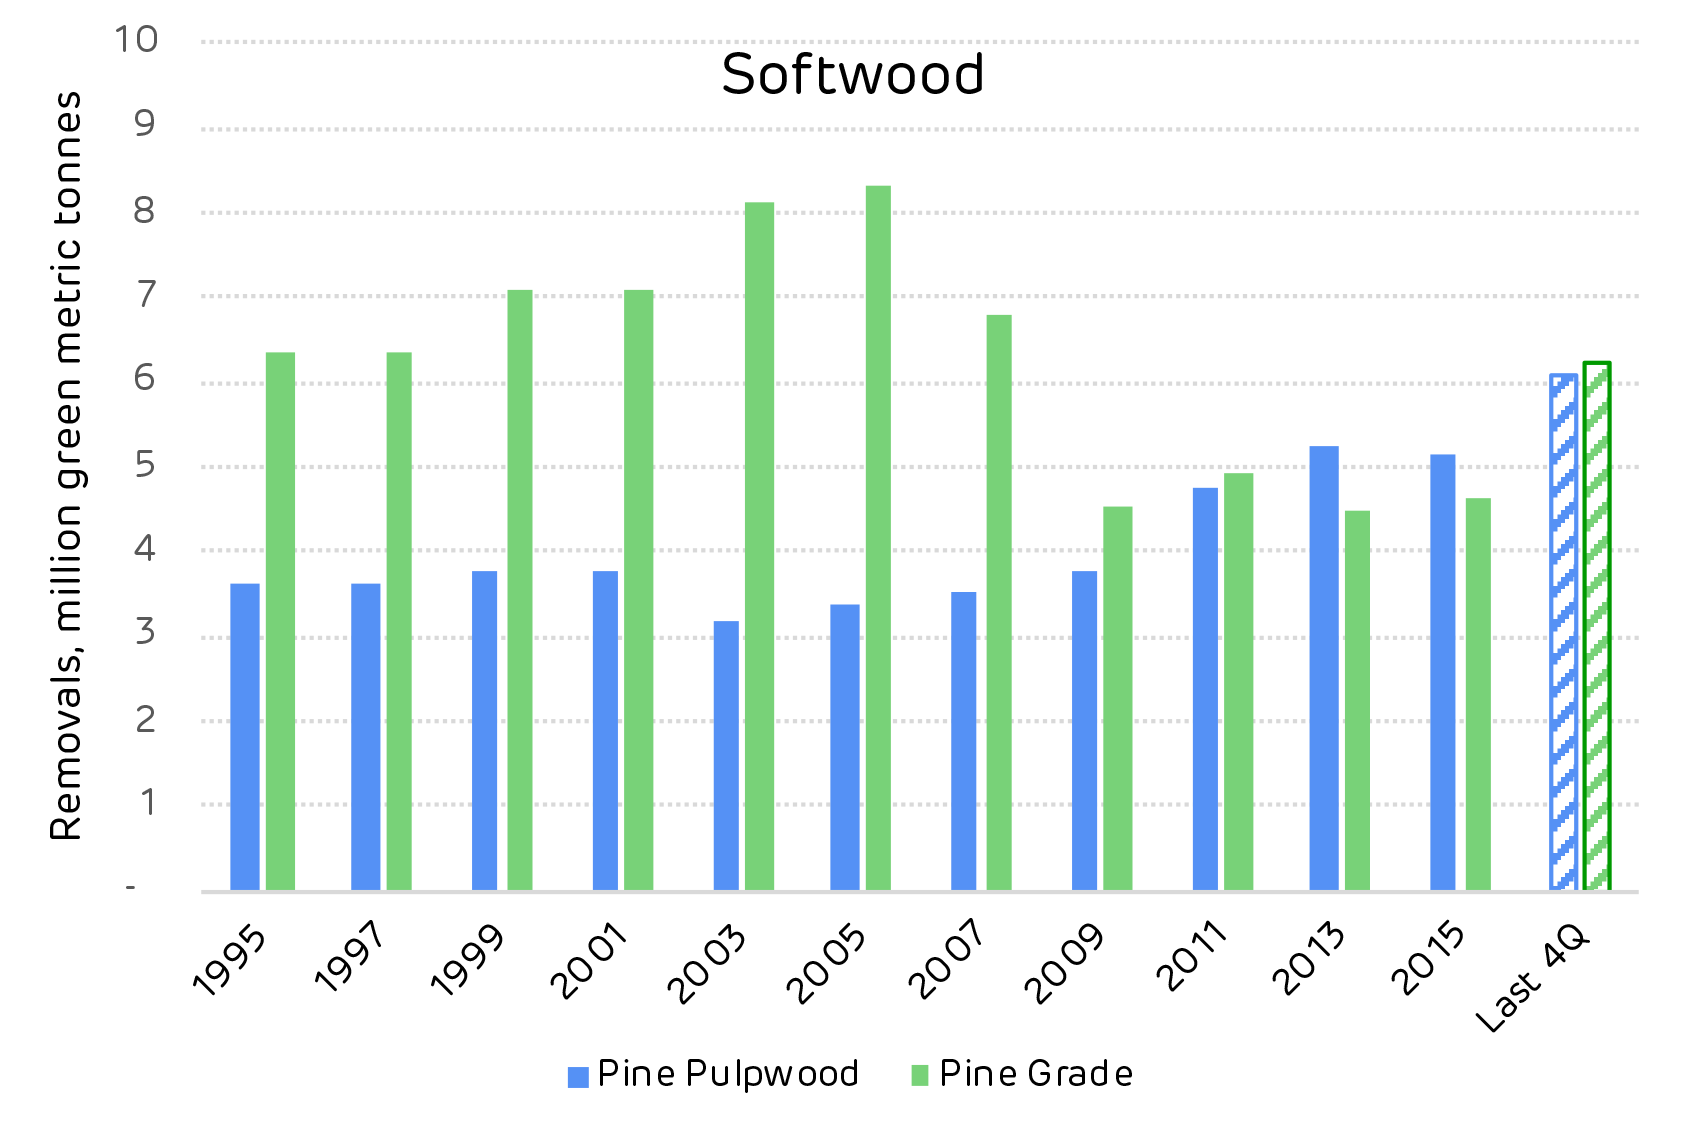
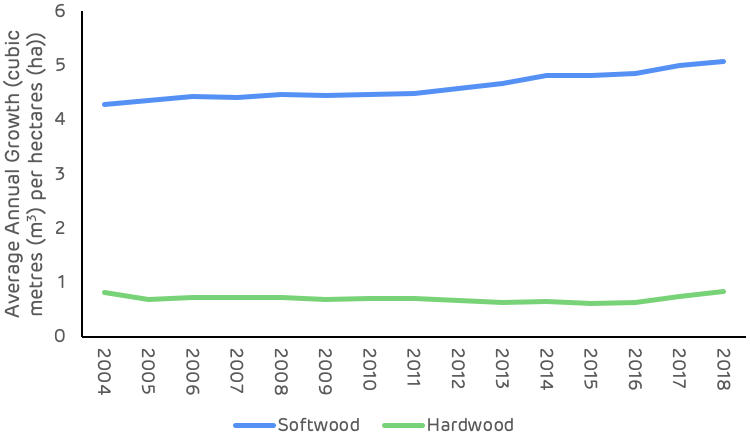
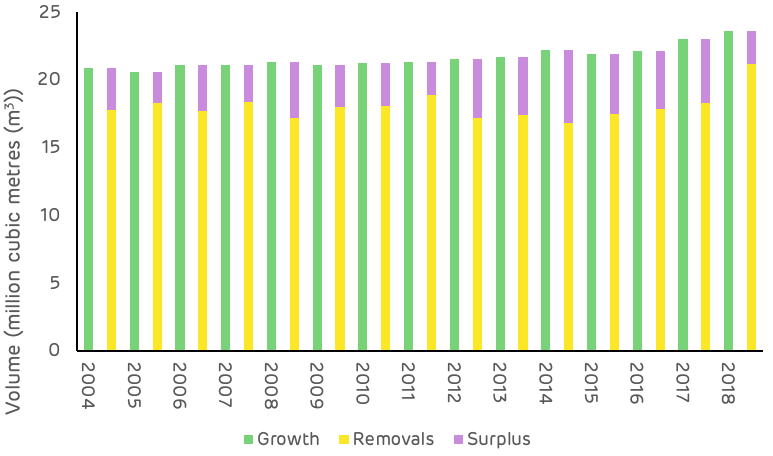
The maturing forest resources can be clearly seen from the growth to removals data for each product category. Average tree sizes getting larger and more pulpwood class stands moving into the larger saw-timber and chip-n-saw categories. This trend can be seen by comparing the data values from 2003 and 2018 where saw-timber average annual growth increased by 90% (1.6 million m3), and removals by 41% (0.98 million m3).  Chip-n-saw growth increased by 73% (1.3 million m3) whilst removals increased by 160% (1.9 million m3). Pulpwood growth decreased by 7.5% (0.4 million m3) whilst removals increased by 63% (1.6 million m3).  Over this time period the total annual surplus of pine growth compared to removals averaged 3.7 million m3 per year (Figure 6).

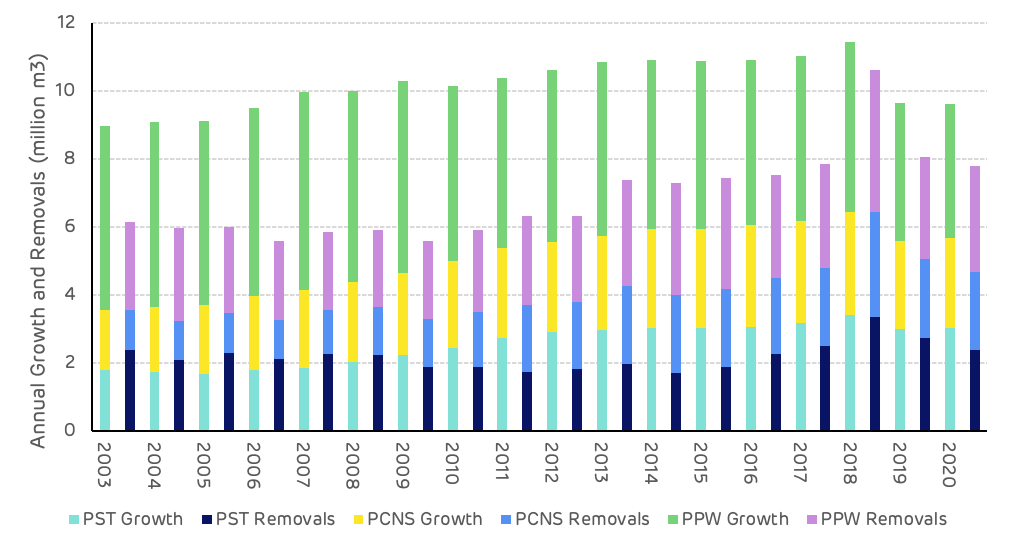
Figure 6: Pine growth and removals by product category and year

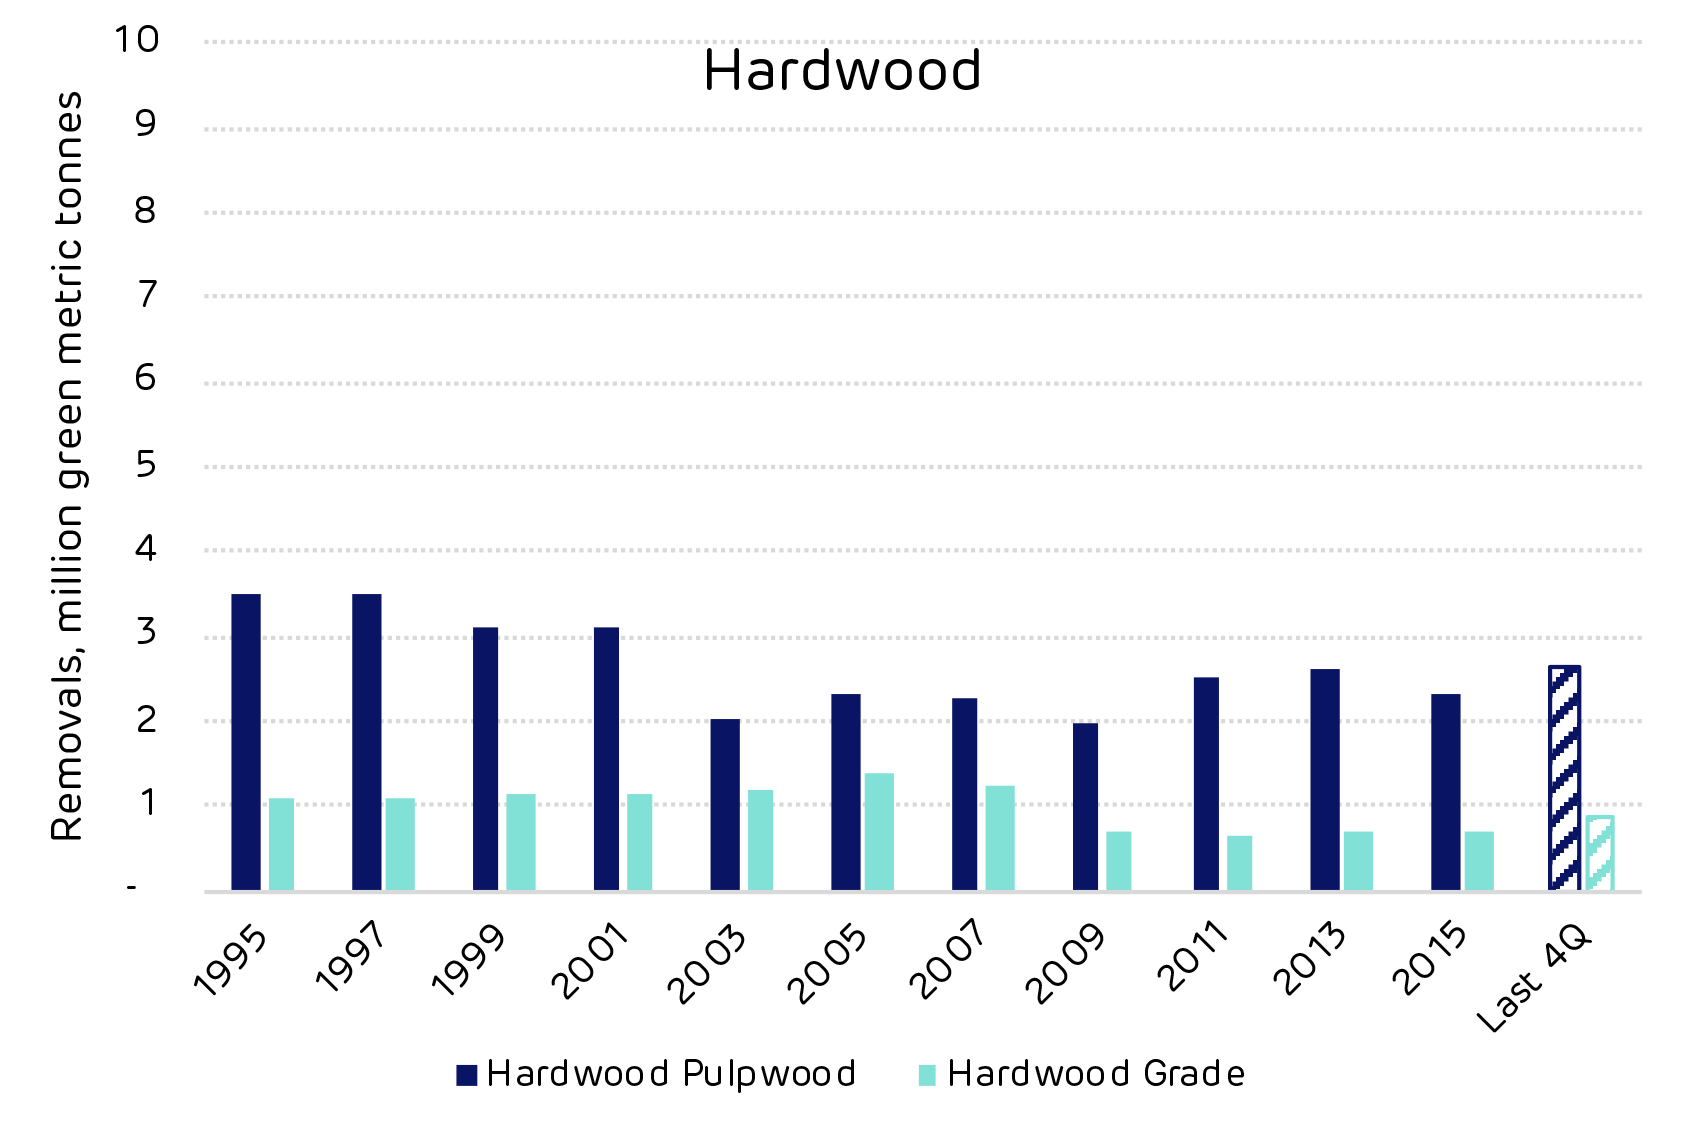
Hardwood saw-timber and pulpwood removals declined by 20% and 40% respectively between 2000 and 2018, whilst growth increased by 23% for hardwood saw-timber and declined by 16% for hardwood pulpwood. The average annual hardwood surplus over this time period was 1.5 million m3 per year (Figure 7).

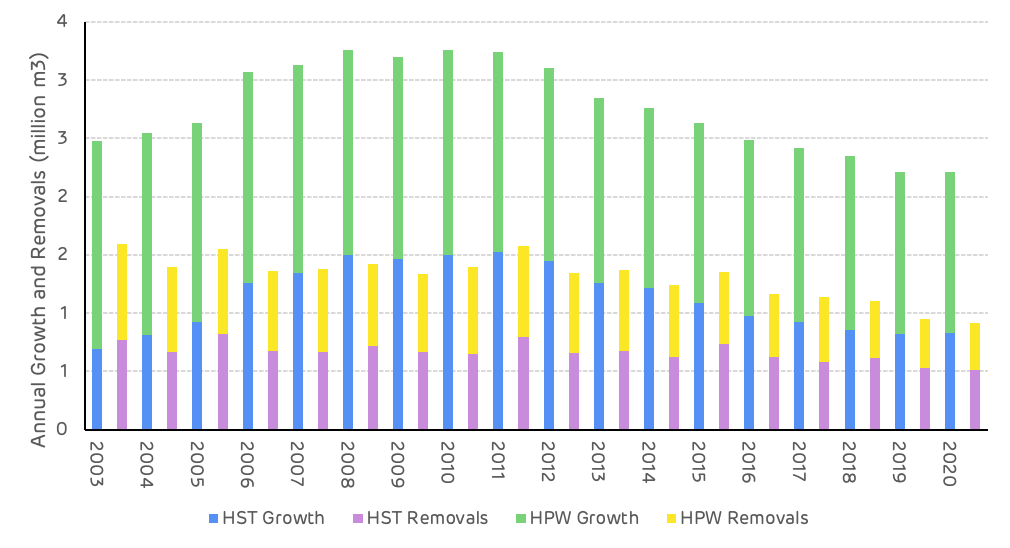
Figure 7: Hardwood growth and removals by product category and year

Despite a short-term imbalance in some product categories, the overall surplus of pine growth compared to removals has remained strong, with an average of 3.3 million m3 between 2000 and 2020, which includes the increased salvage harvesting in 2018 (Figure 8).

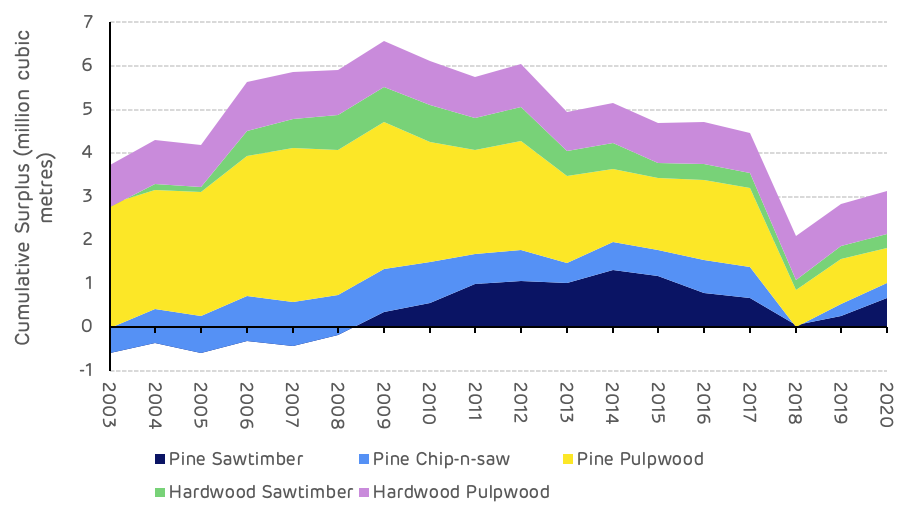
Figure 8: Cumulative annual surplus of growth compared to removals

Wood Prices

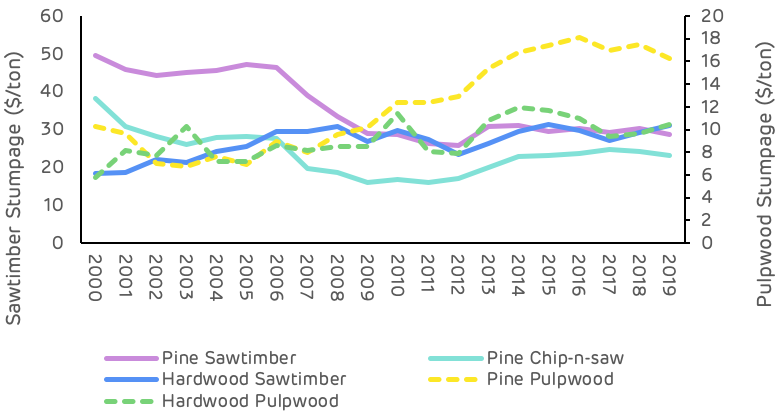
Stumpage price is the value paid to the forest owner for each category of product at the time of harvesting. The variation in prices in the Cottondale catchment area has been significant and shows some interesting trends. The higher value pine products (saw-timber and chip-n-saw) began with high stumpage values in 2000, as markets were strong for construction and furniture grade timber and supply limited at that stage due to the young age class and predominance of pulpwood stands at that time.  In 2008, following the global economic crisis and the crash in housing and construction markets, saw-timber prices declined substantially reaching a low of $23 per ton, a 47% decline from the 2000 price. This stumpage price has never recovered, despite an improvement in the economy and an increase in housing starts and demand for structural timber. The reason for the continued deflated saw-timber stumpage price is a substantial surplus of supply in this catchment area.  As the forest area has matured and more saw-timber grade stands are available, markets have been able to satisfy demand without an increase in price.

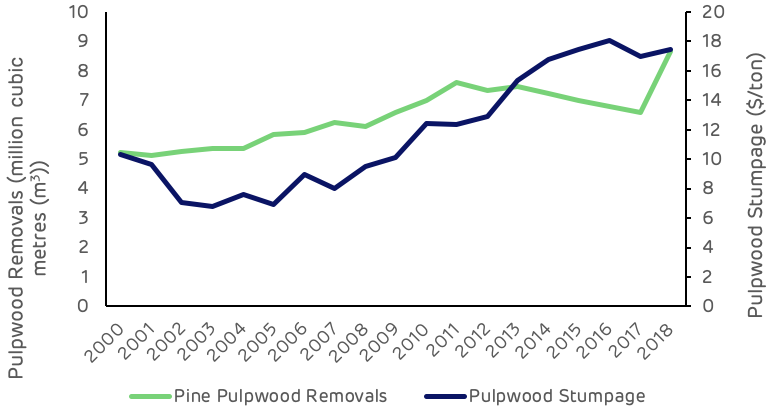
Pine pulpwood prices at Cottondale were lower than the US South-wide average in 2000 and remained relatively low until around 2013. A reduction in saw-timber production, and consequent reduction in mill residuals, due to the recession of 2008, led to a shortage of pulp mill feedstock and increased harvesting of pulpwood stands. This caused an increase in pine pulpwood stumpage values alongside an overall increase in demand as biomass and pellet markets began production around this time. The data shows a short-term spike in pine pulpwood stumpage prices in 2013-14, but this returned to a more normal trend as more saw-timber residues became available and pulpwood stumpage values have been around $10-11 per ton since 2015 (Figure 9).

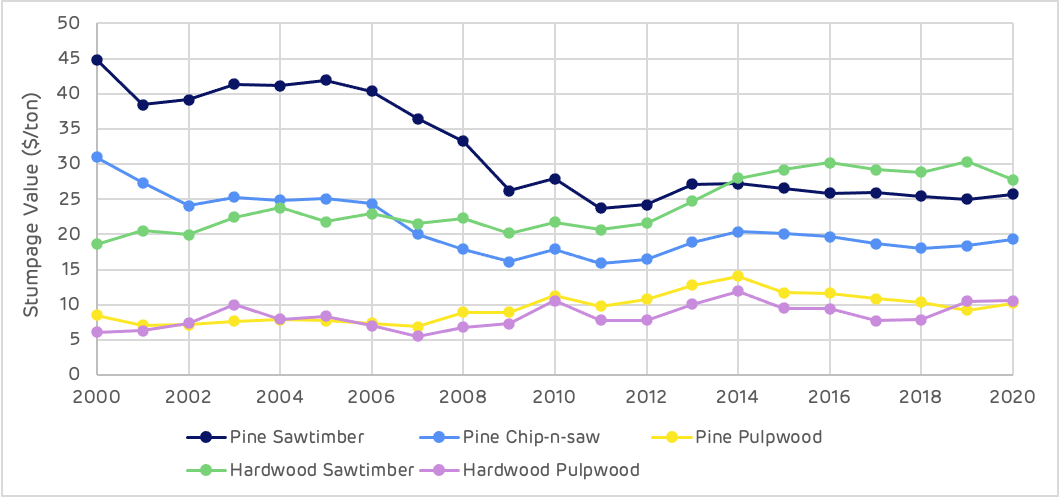
Figure 9: Variation in stumpage value over time

Biomass demand 

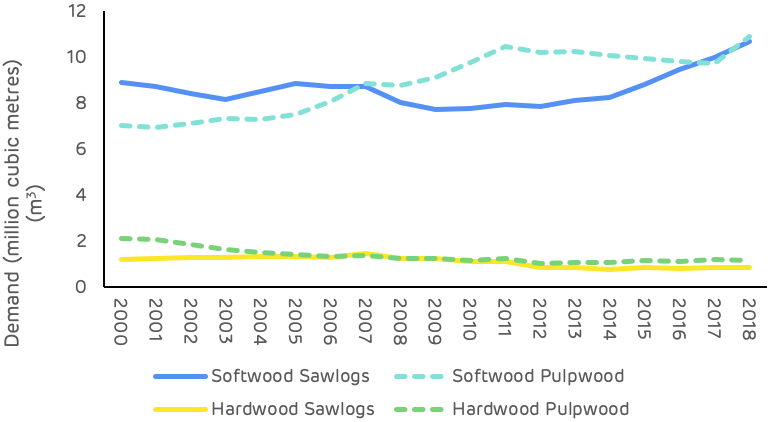
Biomass demand in the Cottondale catchment area began in 2008 and has averaged around 800 thousand m3per year since that time with a high of just over 1 million m3 in 2013 to 2015 and a low of 200 thousand m3 in 2008. Other pulpwood markets have had an average annual demand of 3.97 million m3 between 2000 and 2020 with a high of 4.76 million m3 in 2018 and a low of 3.2 million m3 in 2009.  In 2020 the biomass market represented 16% of the total pulpwood demand in the Cottondale catchment area (Figure 10).

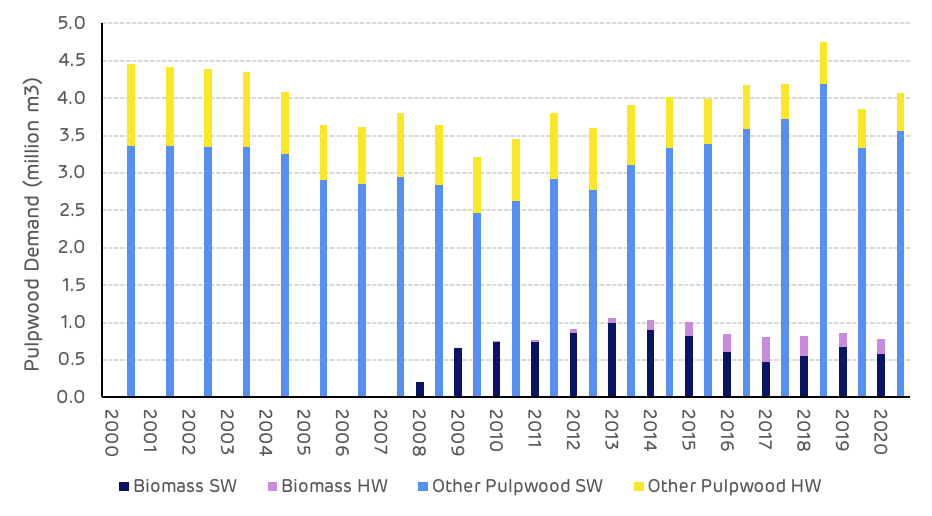
Figure 10: Total pulpwood demand

Forest Management

The average size of clear-cut harvesting sites from 2000 to 2020 has been 47 ha, ranging from 38 ha up to 56 ha. The average size of thinning sites has been 65 ha, ranging from 55 ha up to 76 ha. When isolating the period from 2000 to 2010 and 2011 to 2020, the averages and range remain very similar, suggesting that there has been no significant change in harvesting coupe size over this period.

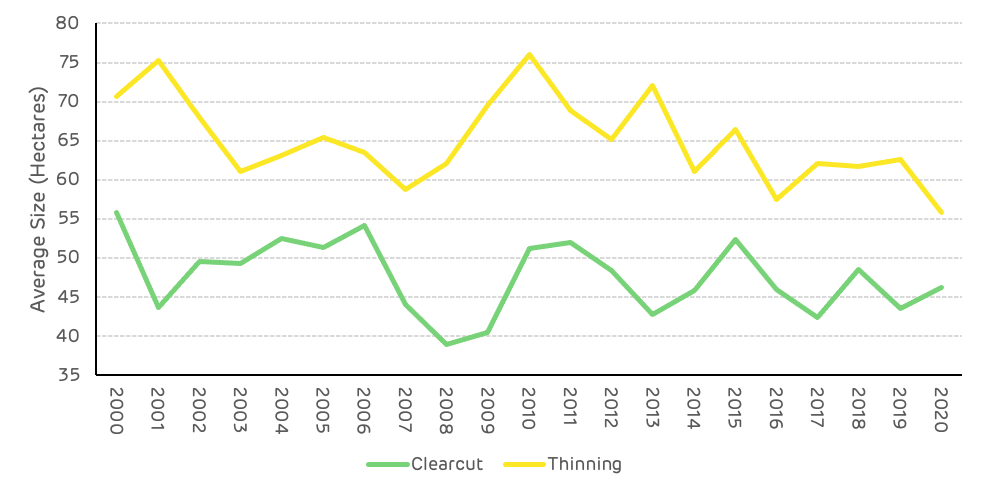
Figure 11: Average size of harvesting sites

The impact of biomass and wood pellet demand on the key metrics in this catchment area are considered below. This is a summary of Hood Consulting’s view on the trends and impacts in the Cottondale catchment area.

Is there any evidence that bioenergy demand has caused the following:

Deforestation?

No. US Forest Service (USFS) data shows a 55,166-hectare (+1.9%) increase in the total area of timberland in the Enviva Cottondale catchment area since the Enviva Cottondale pellet mill commenced production in 2008. Furthermore, a strong positive relationship was identified between biomass demand and timberland area, suggesting that the increase in timberland area since 2008 can be linked, to a degree, to increased demand attributed to bioenergy.

A change in management practices (rotation lengths, thinnings, conversion from hardwood to pine)?

Inconclusive. Changes in management practices have occurred in the catchment area over the last two decades. However, the evidence is inconclusive as to whether increased demand attributed to bioenergy has caused or is responsible for these changes.

Clearcuts and thinnings are the two major types of harvests that occur in this region, both of which are long-standing, widely used methods of harvesting timber. TimberMart-South (TMS) data shows that thinnings accounted for 63% of total reported harvest area in the Cottondale market from 2005-2011 but only 39% of total harvest area reported from 2012-2020. Specifically, the decreased prevalence of thinning since 2012 can be linked to the strengthening of pine pulpwood markets and concurrent weakening of pine sawtimber markets beginning in the mid-2000s.

Prior to the bursting of the US housing bubble in 2006, timber management in this market had been driven to a large degree by pine sawtimber production. However, challenging market conditions saw pine sawtimber stumpages prices decline more than 40% from 2006-2011. At the same time, pine pulpwood markets started to strengthen, with pine pulpwood stumpage prices increasing more than 50% from 2006-2010. So, with sawtimber markets weakening and pulpwood markets strengthening, the data suggests that many landowners decided to alter their management approach (i.e. to take advantage of strong pulpwood markets) and focus on short pulpwood rotations that typically do not utilize thinnings.

Bioenergy has had an impact on this market by adding an average of roughly 680,000 metric tons of additional pine pulpwood demand to this catchment area annually since 2008. However, bioenergy has accounted for only 17% of total softwood pulpwood demand in this market since Enviva Cottondale’s startup. Ultimately, the shift in management approach that occurred in this market can be more closely linked to other factors, such as increased softwood pulpwood demand from non-bioenergy sources (i.e. pulp/paper) as well as the weakening of pine sawtimber markets.

Diversion from other markets?

No. Demand for softwood (pine) sawlogs increased an estimated 23% in the Cottondale catchment area from 2008-2020. Also, there is no evidence that increased demand from bioenergy has caused a diversion from other softwood pulpwood markets (i.e. pulp/paper), as softwood pulpwood demand not attributed to bioenergy has increased 25% since the Cottondale mill’s startup in 2008.

An unexpected or abnormal increase in wood prices?

Inconclusive. The startup of Enviva Cottondale added more than 900,000 metric tons of softwood pulpwood demand to the catchment area from 2008-2013, and this increase in demand coincided with a 28% increase in the delivered price of pine pulpwood (PPW) – the primary roundwood product consumed by the Enviva Cottondale mill. However, since 2013, delivered PPW prices have held flat, despite biomass-related softwood pulpwood demand falling to an average of roughly 635,000 tons per year since 2016, down more than 40% compared to 2013 peak levels. (Note the decrease in roundwood consumption was due to a higher utilization of secondary residuals). It’s also important to point out that the roughly 410,000-metric ton decrease in softwood biomass demand from 2013 to 2020 was offset by a roughly 455,000-metric ton increase in softwood pulpwood demand from other sources.

Statistical analysis did identify a positive relationship between softwood biomass demand and delivered PPW price. However, that relationship was found to be relatively weak. The relationship between delivered PPW price and softwood pulpwood demand from other sources was found to be much stronger, which was not unexpected to find given that softwood pulpwood demand not attributed to bioenergy has accounted for 83% of total softwood pulpwood demand in the catchment area since 2008.

Furthermore, there is some evidence linking the increase in pine sawmill chip prices to increased consumption of secondary pine residuals by Enviva Cottondale. Specifically, consumption of secondary pine residuals by Enviva Cottondale more than doubled from roughly 213,000 metric tons in 2012 to nearly 490,000 metric tons in 2016, and this increased consumption of pine residuals coincided with a nearly 20% increase in the price of pine sawmill chips. However, increased consumption of residuals by the bioenergy sector was only one of several contributing factors that can be linked to the increase in pine sawmill chip prices. Increased consumption of pine residuals by the pulp/paper industry also contributed to higher pine sawmill chip prices. In addition, there is a strong linkage between pine sawmill chip prices and softwood lumber production. Specifically, the increase in softwood lumber production that begun in the early-to-mid-2010s consequently resulted in the increased production of secondary residuals, and the increased availability of this lower-cost material led to greater competition and ultimately higher pine residual prices.

A reduction in growing stock timber?

No. From 2008 (the year Enviva Cottondale commenced production) up until Hurricane Michael struck in late-2018, total growing stock inventory increased an average of 1.8% per year (+19% total) in the Cottondale catchment area. Specifically, inventories of pine sawtimber and pine chip-n-saw increased 58% and 28%, respectively, while pine pulpwood (PPW) inventory decreased 4% over this same period.

However, note that the decrease in pine pulpwood inventory from 2008-2018 was not due to increased demand from bioenergy or increased harvesting above the sustainable yield capacity of the forest area, as annual growth of pine pulpwood exceeded annual removals every year throughout this period. Rather, this slight decrease in PPW inventory levels is more a reflection of the aging of the catchment area forest and the movement of stands classified as pulpwood to stands classified as chip-n-saw.

A reduction in the sequestration rate of carbon?

No. US Forest Service (USFS) data shows the average annual growth rate of total growing stock timber in the Cottondale catchment area decreased from 5.9% in 2008 to 5.2% in 2020, suggesting that the sequestration rate of carbon also declined slightly over this period. However, there is little evidence to suggest that increased demand attributed to bioenergy is responsible for this change.

The reduction in overall growth rate (and therefore reduction in the sequestration rate of carbon) is more a reflection of the aging of the catchment area forest. Specifically, growth rates decline as timber ages, and this is exactly what USFS data shows in the Cottondale catchment area, with the average age of growing stock timber increasing from less than 44 years of age in 2008 to nearly 46 years of age in 2020.

An increase in harvesting above the sustainable yield capacity of the forest area?

No. Growth-to-removals (G:R) ratios, which compare annual timber growth to annual timber removals, provides a measure of market demand relative to supply as well as a gauge of market sustainability. In 2020, the latest available, the G:R ratio for pine pulpwood (PPW), the predominant timber product utilized by the bioenergy sector, equaled 1.26 (recall that a value greater than 1.0 indicates sustainable harvest levels).

Note, however, that the PPW G:R ratio averaged 1.57 in the catchment area from 2013-2017 before falling to 1.20 in 2018 and averaging 1.27 since. This notable drop in 2018 was due to a nearly 35% increase in PPW removals (due to Hurricane Michael). It’s also important to note that while annual removals have moved back in line with pre-Michael levels since 2019, this lower PPW G:R ratio is likely reflective of the new norm (at least over the midterm). Hurricane Michael destroyed an estimated 22% of total pine pulpwood inventory in the Cottondale catchment area, and this loss in inventory will be reflected in reduced growth until the destroyed forests regenerate. However, in spite of this loss, adequate PPW inventory levels still remain and sustainable market conditions are expected to persist moving forward.

Timber growing stock inventory

Neutral. According to USFS data, inventories of pine pulpwood (PPW) decreased 25% in the catchment area from 2008-2020. However, this substantial decrease was due to Hurricane Michael, which destroyed nearly 520,000 hectares of catchment area timberland when it hit the Florida panhandle in late-2018. Prior to this event occurring, PPW inventory levels had held relatively steady, decreasing slightly but averaging 47.2 million m3 in the catchment area from 2008-2018. However, the destruction caused by Hurricane Michael resulted in the immediate loss of more than 10.3 million m3 of PPW inventory, or a 22% decrease compared to pre-hurricane levels.

Moreover, the slight decrease in PPW inventory levels that did occur from 2008-2018 was not due to increased demand from bioenergy. Typically, a reduction in inventory is linked to harvest levels above the sustainable yield capacity of the forest area, but in the Cottondale catchment area, annual growth of PPW exceeded annual removals every year throughout this period. Ultimately, the decrease in PPW inventory from 2008-2018 can be more closely linked to decreased pine sawtimber production beginning in the early to mid-2000s. Specifically, annual removals of pine sawtimber decreased 28% from 2003-2014, and the reduction in harvest levels over this period translated to a reduction in newly-re-established pine stands and ultimately the slight reduction in PPW inventory levels that occurred in the mid-to-late 2010s.

Timber growth rates

Neutral. Overall, timber growth rates declined slightly in the catchment area from 2008 (the year Enviva Cottondale commenced operations) through 2020. However, this decrease in timber growth rates was not due to increased demand attributed to bioenergy but rather to the aging of the catchment area forest. Specifically, USFS data shows the average age timber inventory in the Cottondale catchment area increased from an estimated 43.6 years of age in 2008 to 45.7 years of age in 2020.

Forest area

Positive. In the Enviva Cottondale catchment area, total forest area (i.e. timberland) increased more than 55,100 hectares (+1.9%) from 2008 through 2020, and this increase can be linked to several factors, including increases in softwood pulpwood demand (from both bioenergy and other sources) as well as conversion from farmland.

Specifically, the more than 55,100-hectare increase in catchment area timberland from 2008-2020 coincided with a 1.1-million metric ton increase in annual softwood pulpwood demand (roughly half of which was attributed to bioenergy). While statistical analysis identified moderately strong positive relationships between timberland area and both softwood biomass demand and non-bioenergy-related softwood pulpwood demand, a strong positive correlation was found between timberland and total softwood pulpwood demand – suggesting that the increases in timberland since 2008 can be attributed, in part, to the increase in total softwood pulpwood demand (from both bioenergy and other sources).

The more than 55,100-hectare increase timberland from 2008-2020 also coincided with a roughly 75,000-hectare decrease in farmland (i.e. cropland, woodland, and pastureland) over this period. Specifically, the catchment area experienced a roughly 31,800-hectare loss in cropland, 8,900-hectare loss in pastureland, and 34,300-hectare loss in woodland from 2008-2020. Furthermore, statistical analysis confirmed this inverse relationship, identifying a strong negative correlation between timberland and farmland in the Cottondale catchment area.

Wood prices

Negative / Positive. Total softwood pulpwood demand attributed to bioenergy in the Cottondale catchment area increased from zero tons in 2007 (the year prior to Enviva Cottondale’s startup) to over 1.0 million metric tons in 2013. Over this same period, the price of delivered pine pulpwood (PPW) – the predominant roundwood product utilized by Enviva Cottondale for wood pellet production – increased 42% (from $21.06 per ton in 2007 to $29.82 per ton in 2013).

However, the apparent link between increased softwood biomass demand and increased delivered PPW price is only loosely supported by statistical analysis, which identified a relatively weak positive relationship between these two variables. Furthermore, delivered PPW price has remained nearly unchanged in the catchment area since 2013, despite softwood biomass demand declining and averaging roughly 577,000 metric tons per year since 2016. (Note that the roughly 410,000-metric ton decrease in softwood biomass demand from 2013-2020 was offset by a roughly 455,000-metric ton increase in softwood pulpwood demand from other sources). Ultimately, the increase in delivered PPW prices in the catchment area can be linked to increased demand for softwood pulpwood from all sources, and roughly half of the 1.2-million metric ton increase in softwood pulpwood demand since 2007 can be attributed to bioenergy.

However, it’s also important to note that the increase in bioenergy-related wood demand has been a positive for forest landowners in the Enviva Cottondale catchment area. Not only has bioenergy provided an additional outlet for pulpwood in this market, but the increase in delivered PPW price resulting from increased softwood pulpwood demand from bioenergy has transferred through to landowners in the form of higher PPW stumpage prices. Specifically, over the six years prior to Enviva Cottondale’s startup, PPW stumpage price – the price paid to landowners – averaged roughly $7.40 per ton in the Cottondale catchment area. However, since 2010, PPW stumpage prices have averaged more than $11.15 per ton, representing a more than 50% increase compared to pre-mill startup levels.

Markets for solid wood products

Positive. In the Enviva Cottondale catchment area, demand for softwood sawlogs used to produce lumber and other solid wood products increased an estimated 23% from 2008-2020. This increase in softwood lumber production has consequentially resulted in an increase in sawmill residuals (i.e. chips, sawdust, and shavings) – by-products of the sawmilling process and materials utilized by Enviva Cottondale to produce wood pellets.

Specifically, softwood sawlog demand has increased more than 16% in the catchment area since 2014, and this increase in demand has coincided with a nearly 60% increase in pine residual purchases by Enviva Cottondale. (Note that pine residuals constituted 25% of total raw material purchases by Enviva Cottondale in 2014 but 41% of total raw material purchases in 2020). So, not only has Enviva Cottondale benefited from the greater availability of this sawmill by-product, but lumber producers have also benefited, as Enviva Cottondale has provided an additional outlet for these producers and their by-products.

Read the full report: Enviva Cottondale pellet plant catchment area analysis

This is part of a series of catchment area analyses around the forest biomass pellet plants supplying Drax Power Station with renewable fuel. Others in the series can be found here

Jobs, skills, zero emissions – the economic need for carbon capture by Drax

Engineer working inside Drax Power Station

The Humber Estuary is one of the most distinctive features of the UK’s eastern coastline. Viewed from above, it is a crack in the land where the North Sea merges with England – it’s this connection to the sea that has defined it as a region and led to its rich industrial history.

But in recent years, as sectors such as heavy manufacturing move overseas, the Humber has begun to sink into economic decline. These challenges are now being exacerbated by COVID-19 – almost 60% of workers in the Yorkshire and the Humber construction industry were furloughed in August 2020.

Stimulation is needed to rejuvenate the Humber and prevent lasting economic scars on the region and its working-age population. Decarbonisation offers the opportunity to rebuild the region for the 2020s and decades ahead.

Technologies that have been identified as essential for the UK to reach its legally-binding commitment of net zero greenhouse gas emissions by 2050 include:

  • Carbon capture usage and storage (CCUS) – trapping, transporting and storing or recycling carbon dioxide (CO2) from industrial processes and energy generation
  • Bioenergy with carbon capture and storage (BECCS) – carbon removal from renewable, sustainable biomass power generation that leads to negative emissions
  • Hydrogen production – switching processes from natural gas to this zero-emissions fuel

Engineer working inside power stationThe Humber has unique capabilities that positions it as a hub for developing all three.
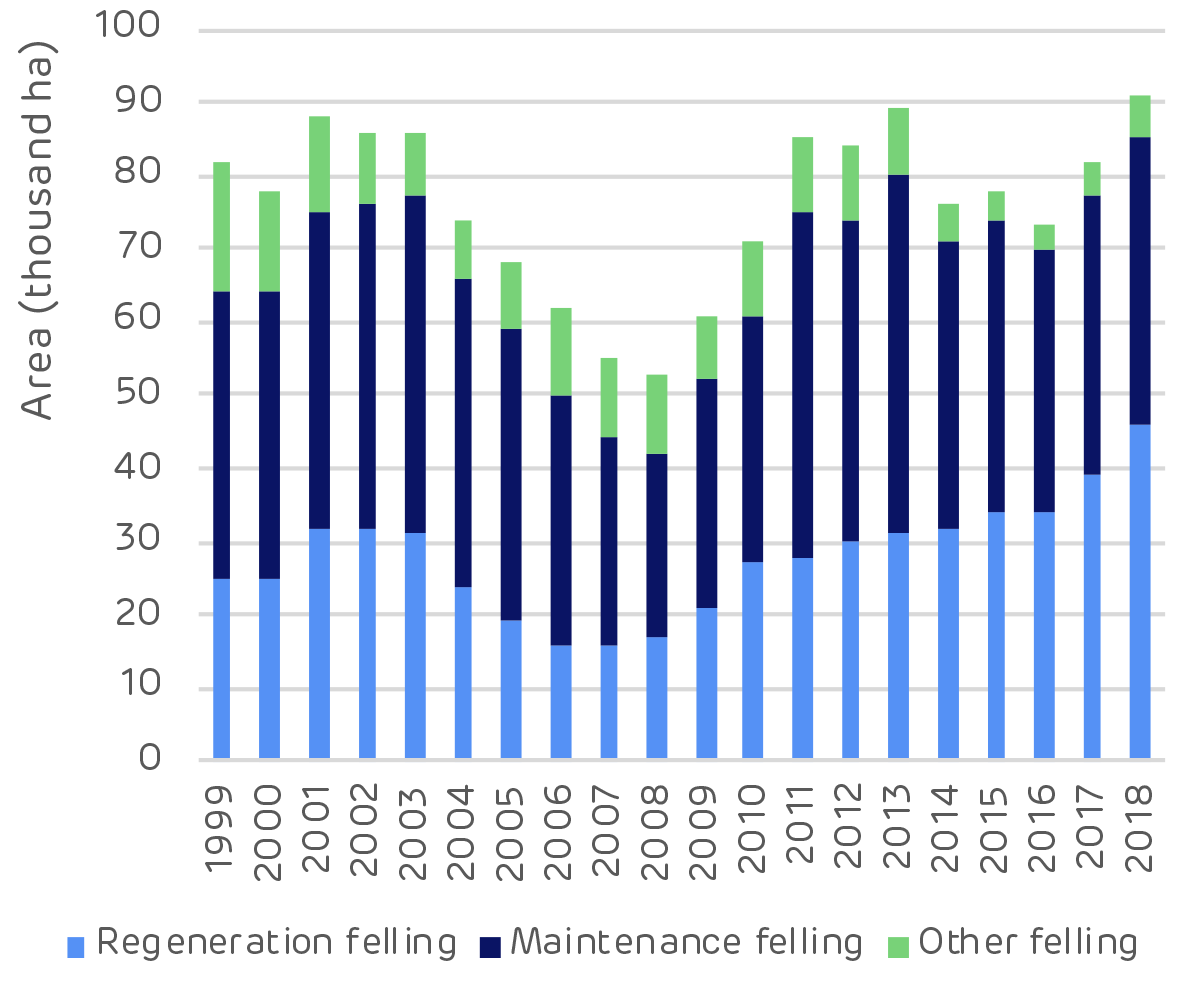
Zero Carbon Humber (ZCH), the partnership between a number of leading companies (including Drax), aims to bring together these essential technologies and create the foundations from which the region’s emissions-heavy industries can regain their competitive edge, create jobs and rejuvenate the area.

A new report by Vivid Economics for Drax investigates the potential economic impact of carbon capture and hydrogen. It concluded that nearly 48,000 jobs could be created and supported in the industrial cluster at the peak of the construction phase in 2027.

It’s a chance to not just revitalise a powerhouse of Northern England, but to collaborate with other industrial clusters and build a UK-wide green economy ready to export globally and attract international business to the region.

Rejuvenating the Humber

The North Sea has helped forge Hull’s strong industrial heritage of ship building and fishing. In the 1950s the flat lands of the south bank enabled post-war industries such as refining chemicals and steel to thrive.

“The region’s economy is built around the ports and accessibility to Europe and the North Sea,” explains Pauline Wade, Director of International Trade at the Hull and Humber Chamber of Commerce. “They are the biggest ports in the UK in terms of tonnage, and the energy and chemical industries hinge on materials coming in and going out of them.”

But these are also emissions-intensive industries, and as a result the Humber has the highest CO2 emissions of any UK industrial region – emitting 30% more than the second largest industrial cluster. Decarbonisation is vital in modernising and protecting these sectors, and the 55,000 manufacturing jobs they support.

River Humber Sunset

“Decarbonisation brings opportunities. Many businesses in this region have that target very firmly set in their business plans,” says Beckie Hart, Regional Director of the Yorkshire and the Humber CBI (Confederation of British Industry). “Many are high polluters – they know that, but they are very keen to became part of the solution.”

Developing BECCS, CCUS and hydrogen, as well as building the infrastructure needed to capture and transport CO2, offers both immediate construction jobs and long-term skilled jobs.

The main construction period of the project would run from 2024 to 2031 and support up to 47,800 new jobs at its peak in 2027, when £3.1 billion a year would be added to the regional economy. These include up to 25,200 high quality jobs in construction and operations, as well as a further 24,400 supported across the supply chain and wider economy.

These construction roles include jobs such as welders, pipe fitters, machine installers and technicians – with immediate government backing, these jobs could be available in as little as four years. Ongoing operations will also create 3,300 long term, skilled jobs in the cluster in the early 2030s.

The supply chain needed to provide the materials and parts for the region’s industrial revitalisation will also support further indirect jobs. In fact, businesses of all kinds stand to benefit – the increased spending by workers also could support further jobs across businesses ranging from cafes to professional services. These indirect jobs go on to induce further employment and spending out across more of the economy.

Overall the report suggests an annual average of more than 7,000 indirect and around 10,800 induced jobs could be supported during the construction phase, with £452 million in indirect and £581 million in induced value added to the wider economy annually on average.

However, transformation is costly and today the Humber region receives among the lowest levels of government investment in research and development in the UK. This has contributed to a pronounced skills gap in the region, as opportunities decline, and more people fall out of the workforce.

Bridging the skills gap in the Humber

Projects such as ZCH depend on availability of skilled workforces to build and operate the next generation of energy technologies. However, the Humber currently has a low proportion of school leavers with the right qualifications to take on roles with specialist technical and practical skills.

This skills gap is only expected to get worse. The Government’s Working Futures model forecasts that from 2022 key sectors such as electricity and gas, engineering and construction in the region will require higher qualifications than are currently available in the local labour market.

The skills gap is also compounded by COVID-19. As it creates economic uncertainty it pushes more people out of work and further reduces skills in the workforce. This has a particularly pronounced impact on young people who are less established in careers, threatening to create a ‘COVID-Generation’ that feel discouraged and detached from the labour market.

But this is not an inevitability.

With the right intervention from government and business, the Humber’s workforce can be upskilled and drive a green recovery.

A number of different approaches are possible: apprenticeships have historically proved a valuable means of training the next generation of workers. Companies and schools should work together to highlight the opportunities of vocational training to school leavers.

“Universities and colleges must work a lot more closely with the businesses in the region to have an honest conversation about what they need,” explains Hart. “A good example is the Ron Dearing University Technical College. It’s a business-led college that has only been open about 18 months but has had great results from the students because they offer specific courses that the region’s employers actually need.”

Engineer within Drax Power Station

For older generations of workers who have been out of the labour force for extended periods of time ‘skills vouchers’ are a timely intervention. These work by offering grants to cover the cost of flexibly retraining, meaning long-term unemployed workers of any age can ease back into new types of jobs.

Training local people for the future is key to decarbonising the Humber and creating jobs, as well as protecting industries. But a net zero industrial cluster could also have an impact beyond just the Humber.

Carbon removal in Yorkshire and the Humber

The Committee on Climate Change (CCC) has made it clear that for the UK to reach net zero by 2050 CCUS and negative emissions from BECCS are essential, as is hydrogen as a zero-carbon source of fuel. These will be needed at scale across the UK, and in the Humber. They are already underway.

Engineer at BECCS pilot project within Drax Power Station

Engineer at BECCS pilot project within Drax Power Station

Drax Power Station is piloting BECCS technology and has proven it can deliver negative emissions. Generating electricity using biomass from sustainably managed forests that absorb CO2 is a carbon neutral process. As part of the power generation process, adding CCUS and capturing the CO2 emitted, storing it permanently under the North Sea turns the process into a carbon negative one.

Deploying BECCS across four of Drax’s generating units would support 10,304 jobs and create £673 million in value at the peak of the construction phase. When operations get underway as early as 2027, 750 permanent operations and maintenance jobs could be created. Drax aims to operate as a carbon negative power station by 2030.

Of the 10,491 jobs supported by deploying BECCS (10,300 at the peak), 6,367 of these would be within the project’s supply chain and wider economy (9,073 in 2028).

Such supply chains needed across the North of England offer further potential to establish Yorkshire and the Humber as a hub for decarbonisation technology.

Facilities such as an Advanced Manufacturing Research Centre (AMRC) have been proven to make regions of the UK more competitive locations for advanced industries. By bringing together business with universities, they can focus on sector-specific challenges for technical industries. By creating a manufacturing hub dedicated to research and innovation in a specific industry, AMRCs also encourage ‘crowing-in investments.’ This is when private sectors investments enter into a region in the wake of government spending.

A zero carbon technology-focused AMRC in the Humber would also position the region to offer decarbonisation skills and products to other industrial clusters in the UK and further afield.

From the Humber to the world

Up the north coast from the Humber is Net Zero Teesside, a neighbouring industrial cluster with its own aims for decarbonisation. Through collaboration with clusters such as this, ZCH can offer even wider reaching benefits and enable UK-wide carbon capture, negative emissions and hydrogen.

However, for the entire UK to reach net zero, clusters all across the country must decarbonise – the report suggests as much as 190 million tonnes (Mt) CO2 could be captured and stored every year across the country.

Beyond just the clusters themselves 193,000 jobs could be created at the peak for UK deployment in 2039. These jobs would add £13.9 billion in value to the economy.

Under the Humber Bridge

Building a strong zero carbon economy based around the combined strengths of BECCS, CCUS and hydrogen can provide the UK with a world-leading export. At a time when countries across the globe all face the same decarbonisation challenges, successfully building clusters like ZCH will allow the UK to export knowledge, skilled labour, technology and services around the world.

“As a port city, Hull has always had an international influence. The chamber of commerce was set up in 1837 by the merchant adventurers who were seafaring traders. That history is inbuilt into the local DNA,” says Wade. “Today, we’re trying to create the environment for international companies to invest and locate in the Humber.”

It serves as a further example of how investing decisively in projects such as Carbon Capture by Drax and CCUS and hydrogen clusters such as Zero Carbon Humber today will bring long term economic benefits, taking the UK from a green recovery to a world-leading green industrial powerhouse.

“The Humber has evolved from the fishing industry to a generator of high-emissions products like steel, chemicals and power,” explains Hart. “Now it is keen to be the clean corner and teach everyone else how to decarbonise. There is a single vision of where we want to go and how they want to get there jointly.”

Read the full report (PDF), executive summary and press release.

Georgia Mill Cluster catchment area analysis

Forest in LaSalle catchment area

The seventh report in a series of catchment area analyses for Drax looks at the fibre sourcing area surrounding a number of compressed wood pellet plants operated by Georgia Biomass (now owned by Enviva) and Fram Renewable Fuels.

The evidence found in the report by Hood Consulting shows a substantial increase in forest inventory (stored carbon) and a relatively stable forest area. However, with continued pressure from urban development, future losses of timberland area are possible.  Despite this, increasing growth rates can maintain and improve wood supply and carbon stock for the foreseeable future.

Increasing forest growing stock and carbon sequestration

The overall inventory of growing stock in the catchment area has increased by 63 million cubic metres (m3) between 2000 and 2018, a growth of 19.3%.  All of this increase has been in the pine area, which increased by nearly 68 million m3, whereas the hardwood species decreased in volume by 4.5 million m3. Overall, the inventory volume split by species in 2018 was 72% to 28% softwood to hardwood. The breakdown by product category is shown in Figure 3 below.

Figure 1: Change in growing stock by major product category and species (USFS)

The pine saw-timber and chip-n-saw product categories, larger dimension and higher value material, showed the largest increase in inventory, whereas pine pulpwood decreased in total volume.  The most substantial change occurred from 2010 to 2018, where pulpwood went from an increasing trend to a decreasing trend and saw-timber increased in volume much more rapidly – this is shown in Table 1 and Figure 2 below.

Change (cubic metres (m3))Pine SawtimberPine Chip-n-sawPine PulpwoodHardwood SawtimberHardwood PulpwoodTotal
2000-201851,301,62822,277,139-5,835,2301,211,110-5,657,11463,297,533
2000-201014,722,99512,707,6745,262,192-3,740,507-5,76989923,182,455
2010-201836,578,6329,569,465-11,097,4224,951,618112,78440,115078
Table 1: Change in growing stock volume by major product category (USFS)

These changes are likely to reflect an increasing age class in the catchment area, with younger stands of pine (previously classed as pulpwood), growing into a larger size class and being reclassified as saw-timber.  This means that the volume of saw-timber availability in future will be significantly higher, but pulpwood availability will be diminished.  For pellet mill markets any loss in pulpwood availability can be compensated by an increase in sawmill residue production if market demand is maintained or increased.

Figure 2: Change in growing stock by major product category and species (USFS)

Growth rates for both softwood and hardwood species have been increasing since 2000 as shown in Figure 3 below. Softwood growth has increased by 18.5% since 2000 and hardwood by 1.4%. The improved softwood growth rate probably resulted from increased investment in the management of pine forests, the superior quality of seedlings and better management practice (ground preparation, weed control, fertilisation etc.). This is a very positive trend for the sequestration rate of carbon and also for providing landowners with the potential to increase revenue per hectare and encourage the retention and improved management of forests, rather than converting to other land uses. The Georgia catchment area is likely split between passive owners that do not actively manage, where growth rates are slower or decline and the incentive to convert land is greater, and owners that actively manage to improve growth and quality, increasing revenue and maintaining productive forest.  There is likely to be a much greater differential in growth rate between these two management approaches than reflected by the trend in Figure 3, highlighting the importance of active management for carbon abatement.

Average annual growth rate per hectare (USFS)

Figure 3: Average annual growth rate per hectare (USFS)

Stable forest area

At a macro scale, the distribution of land use categories has remained relatively stable since 2000, with no apparent major shifts in land use. The timberland area around the seven mills has decreased by around 135 thousand hectares (ha) between 2000 and 2018 (2.3% of the total land area), whilst the area of arable and urban land increased by 98 thousand (1.7% of total area) and 158 thousand (2.7% of total area) ha respectively.  In 2018, timberland represented 67% of total land area and all forest and woodland 80% of total area, down from 69% and 82% respectively in 2000 (Figure 1).

Change in land use category (USDA)

Figure 4: Change in land use category (USDA)

Looking at this change in land use more closely, the timberland area shows the most pronounced decline between 2010 and 2018, a drop of 117 thousand ha. The largest change in other land use categories over this period was an increase of 97 thousand ha in urban and other land, suggesting that a large proportion of the timberland area has been converted to urban areas.

LaSalle Bioenergy forest area

The most significant change in agricultural land occurred prior to 2010, when the timberland area remained relatively stable, this change appears to have involved the transition of pastureland to arable crops. There may also have been some reclassification of forest and woodland types, with a decrease in the area of woodland and an increase in forestland during the period between 2000 and 2010 (Table 2).

Change (hectares (ha))TimberlandOther ForestlandArable CroplandWoodlandPasturelandUrban & Other Land
2000-2018-135,19570,07398,436-77,904-113,725178,315
2000-2010-18,53953,15073,243-73,077-95,63060,852
2010-2018-116,65616,92225,193-4,827-18,09697,463
Table 2: Timing of land use change in Georgia catchment area (USDA)

These trends are also clear and apparent in Figure 3 below which shows the sharp decline in timberland area, albeit small in absolute area relative to the total catchment area size, and the steady increase in urban land.  Georgia ranks 8th in the list of US States and territories by total population with 10.6 million and 17th by population density at 184 per square mile (mi2) compared to just 63 per mi2  in Mississippi where Drax’s Amite Bioenergy (ABE) pellet plant is located and 108 per mi2 in Louisiana where the Morehouse Bioenergy (MBE) and LaSalle Bioenergy (LBE) mills are located (US Census Bureau). This population pressure and increased development can lead to more forest loss and land use change.

Trends in major land use categories (USDA)

Figure 5: Trends in major land use categories (USDA)

Drax’s suppliers in the Georgia catchment area have made a commitment not to source wood from areas where land use change is taking place. This commitment is monitored and verified through the Sustainable Biomass Program (SBP) certification process that is maintained by each mill.  Any land use change in the catchment area is likely to be a result of prevailing economic drivers in the region rather than due to actions being taken by the pellet producers.

Increasing demand and surplus forest growth

Strong markets are essential for ensuring that forests are managed and restocked to optimum benefit, sawlog markets are particularly important as this is highest revenue stream for forest owners. Figure 6 shows the trend in market demand for each major product category since 2000 and demonstrates the recent increase in softwood sawlog demand as the US economy (particularly housing starts) recovered from the global recession at the end of the last decade. Softwood pulpwood demand increased through the 2000s but has remained relatively stable since 2011, with the exception of a peak during 2018 which resulted from an increase in volume generated by salvage operations after hurricane Michael.

Figure 6: Demand for wood products (USFS, TMS)

Figure 6: Demand for wood products (USFS, TMS)

The comparison of average annual growth and removals in the Georgia catchment area is much more tightly balance than in Drax’s other supply regions, as shown in Figure 7. Since 2000 the average annual surplus of growth has been around 3.6 million m3 with both demand and growth increasing in recent years.

Figure 7: Average annual growth, removals and surplus (USFS)

Figure 7: Average annual growth, removals and surplus (USFS)

As shown in Figures 2 & 3, growth rates are strong and inventory is increasing, this is not a problem in the Georgia area.  The relatively small surplus, as compared to other catchment areas in the US South, is due to the higher concentration of wood fibre markets and the more intense forest industry activity in this region.  As of July 2020, there were over 50 major wood-consuming mills operating within the Georgia catchment area and an additional 80+ mills operating within close proximity, overlapping the catchment area.  Total pulpwood demand in 2019 was 12.9 million tons, of which approximately 87% was attributed to non‐bioenergy‐related sources (predominantly pulp/paper) and 13% was attributed to the bioenergy sector.  Given the bio-energy sector’s low ranking position in the market (with the lowest ability to pay for fibre), combined with the relatively small scale in demand compared to the pulp and paper industry, the influence of biomass markets can be considered to be minimal in this region, particular when it comes to impacts on wood prices and forest management practice.

Wood price trends

Pine sawtimber prices suffered a significant decline between 2000 and 2010, dropping almost $21 per ton as a result of the global financial crisis and the decline in demand due to the collapse in housing markets and construction (Table 3).  Since 2010 pine sawtimber has remained relatively stable, with some minor fluctuations shown in Figure 8 below.

Change ($/ton)Pine SawtimberPine Chip-n-sawPine PulpwoodHardwood SawtimberHardwood Pulpwood
2000-2019-$20.92$15.14$5.95$12.55$4.70
2000-2010-$20.92-$21.41$2.11$11.25$5.67
2010-2019$0.00$6.27$3.84$1.30-$0.97
Table 3: Stumpage price trends (TMS)

Pine pulpwood prices have been on a generally increasing trend since 2000, with a more significant increase since 2011.  This increase does not reflect an increase in demand or total volume, which has remained relatively stable over this period, but a shifting of the geographic distribution of the market with some new mills opening and old mills closing, resulting in increased competition in some localised fibre baskets and leading to an overall increase in stumpage price.

Figure 8: Stumpage price trends (TMS)

Figure 8: Stumpage price trends (TMS)

Figure 9 below shows that, with the exception of the hurricane salvage volume in 2018, pulpwood removals have declined or remained relatively stable since 2010, whereas pulpwood stumpage prices increased by 41% from 2010 to 2018.

Figure 9: Pulpwood demand and stumpage price (USFS, TMS)

Figure 9: Pulpwood demand and stumpage price (USFS, TMS)

Comparing this stumpage price trend with other catchment areas of the US South (Figure 10), where Drax sources wood pellets, the Georgia area is on average 35% higher than the next highest area (Chesapeake) and 87% higher than the lowest cost area (Amite Bioenergy in Mississippi).  This price differential is predominantly due to the scale of demand and availability of surplus low-grade fibre.

Figure 10: Comparison of pine pulpwood stumpage prices in Drax supply areas US South (TMS)

Figure 10: Comparison of pine pulpwood stumpage prices in Drax supply areas US South (TMS)

Hood Consulting summary of the impact of the seven pellet plants on key trends and metrics in this catchment area.

Is there any evidence that bioenergy demand has caused the following…

Deforestation?

No. US Forest Service (USFS) data shows a 108,130-hectare (-2.6%) decrease in total timberland in the Georgia catchment area since Georgia Biomass’ first full year of production in 2012. Specifically, this loss in total area of timberland coincided with a more than 21,000-hectare increase in cropland/pastureland and a more than 73,000-hectare increase in urban land and land classified as having other uses.

However, there is little evidence to suggest that increased wood demand from the bioenergy sector has caused this decrease in total timberland. Furthermore, pine timberland – the primary source of roundwood utilized by the bioenergy industry – has increased more than 17,000 hectares in the catchment area since 2016.

A change in management practices (rotation lengths, thinnings, conversion from hardwood to pine)?

No. Changes in management practices have occurred in the catchment area over the last two decades. However, there is little evidence to suggest that bioenergy demand, which accounts for roughly 10-14% of total pulpwood demand (and only 5-7% of total wood demand in the catchment area), has caused or is responsible for these changes.

Clearcuts and thinnings are the two major types of harvests that occur in this region, both of which are long-standing, widely used methods of harvesting timber. TimberMart-South (TMS) data shows that thinnings accounted for 67% of total reported harvest area in the southeast Georgia market from 2000-2010, but only 43% of total harvest area reported from 2012-2019. Specifically, this downward shift was initiated by the bursting of the US housing bubble in the mid-2000s and had been completed by the early 2010s. We’d like to note that this shift coincided with a nearly 50% decrease in pine sawtimber stumpage price from 2006-2012. This is important because the strength of pine sawtimber markets had been a driving force behind timber management decisions in this region in the early and mid-2000s.

Also, contributing to the decreased prevalence of thinnings was the strengthening of pine pulpwood markets in the mid-2000s, as pine pulpwood stumpage prices increased more than 40% in the Georgia catchment area from 2003-2008. So, with sawtimber markets continuing to weaken and pulpwood markets doing just the opposite, the data suggests that many landowners decided to alter their management approach (to take advantage of strong pulpwood markets) and focus on short pulpwood rotations that typically do not utilize thinnings.

Ultimately, the shift in management approach that occurred in this market can be linked to the weakening of one type of timber market and the strengthening of another. In the early and mid-2000s, timber management was focused on sawtimber production – a type of management that utilizes thinnings. However, for more than a decade now, this market has been driven to a large degree by the pulp/paper industry, with a significant portion of the timber management in this area focused on short pulpwood rotations.

Diversion from other markets?

No. Demand for softwood (pine) sawlogs increased an estimated 39% in the Georgia catchment area from 2011-2019. Also, increased bioenergy demand has caused no diversion from other pulpwood markets (i.e. pulp/paper), as pulpwood demand not attributed to bioenergy held steady and remained nearly unchanged from 2012-2017 before increasing in 2018 and 2019 due to the influx of salvage wood brought about by Hurricane Michael.

We’d like to make special note that increased demand for softwood sawlogs since 2011 has not resulted in a full pine sawtimber (PST) stumpage price recovery in this market. Reduced demand for softwood sawlogs in the late 2000s and early 2010s resulted in oversupply, and this oversupply has remained, despite increased demand the last 6-8 years. As a result, PST stumpage prices have held steady and averaged roughly $30 per ton in the catchment area since 2013 – down approximately 35% from the 2000-2006 average of more than $46 per ton, but up roughly 15% from the 2011-2012 average of approximately $26 per ton.

An unexpected or abnormal increase in wood prices?

No / Inconclusive. The delivered price of pine pulpwood (PPW) – the primary roundwood product consumed by both Georgia Biomass and Fram – increased 26% in the Georgia catchment area over the six years directly following the startup of Georgia Biomass, increasing from $29.16 per ton in 2011 to $36.63 per ton in 2017. And while this 26% increase in delivered PPW price coincided with a roughly 1.1 million metric ton increase in annual pine pulpwood demand from Georgia Biomass and Fram, total demand for pine pulpwood (from both bioenergy and other sources) actually decreased 7% over this period. Moreover, evidence suggest that this increase in PPW price is more closely linked to changes in wood supply, specifically, the 9% decrease in PPW inventory from 2011-2017.

However, there is evidence that links increased demand from the bioenergy sector to an increase in secondary residual (i.e. sawmill chips, sawdust, and shavings) prices. Specifically, the price of pine sawmill chips – a residual feedstock utilized by the bioenergy industry for wood pellet production – held steady and averaged approximately $26 per ton in the Georgia catchment area from 2008-2012. However, from 2012-2016, pine sawmill chip prices increased more than 15% (to $29.55 per ton in 2016). This increase in price coincided with annual pine residual feedstock purchases by Georgia Biomass and Fram increasing from roughly 325,000 metric tons to nearly 1.0 million metric tons over this period. However, note that pine sawmill chip prices have held steady and averaged roughly $29.50 per ton in the catchment area since 2016, despite further increases in pine secondary residual purchases by Georgia Biomass and Fram (to more than 1.2 million metric tons in 2019).

Ultimately, the data suggests that any excess supply of pine secondary residuals in the catchment area was absorbed by the bioenergy sector in the early and mid-2010s, and the additional demand/competition placed on this market led to increased residual prices. However, the plateauing of residual prices since 2015 along with the continued increase in secondary residual purchases by Georgia Biomass and Fram further suggest that an increasing percentage of secondary residual purchases by the bioenergy sector is sourced from outside the catchment area. Specifically, Fram confirmed this notion, noting that 35-40% of its secondary residual purchases come from outside the Georgia catchment area (from six different states in the US South).

A reduction in growing stock timber?

No. Total growing stock inventory in the catchment area increased 11% from 2011 through 2018, the latest available. Specifically, over this period, inventories of pine sawtimber and chip-n-saw increased 35% and 13%, respectively. However, pine pulpwood inventory decreased 11% from 2011-2018.

Note that the decrease in pine pulpwood inventory was not due to increased demand from bioenergy (or other sources) or increased harvesting above the sustainable yield capacity of the forest area – as annual growth of pine pulpwood has exceeded annual removals every year since 2011. Rather, this decrease can be linked to the 24% decline in pine sawtimber removals that occurred from 2005-2014 (due to the bursting of the US housing bubble and Great Recession that followed). In this region, timber is typically harvested via clearcut once it reaches maturity (i.e. sawtimber grade), after which the stand is reestablished, and the cycle repeated. However, with the reduced harvest levels during this period also came a reduction in newly reestablished timber stands – the source of pine pulpwood. So, with less replantings occurring during this period, inventories of pine pulpwood were not replenished to the same degree they had been previously, and therefore this catchment area saw a reduction in pine pulpwood inventory levels.

However, according to the US Forest Service, annual removals of pine sawtimber have increased 50% in the Georgia catchment area since 2014, which would suggest higher clearcut levels and increased stand reestablishment. TimberMart-South data also supports this assertion, as clearcut harvests have constituted approximately 60% of the total harvest area reported to TimberMart-South in this region since 2014, compared to 40% from 2005-2014. Ultimately, these increases in clearcut (and stand reestablishment) levels may not be reflected in increased pine pulpwood inventory levels in the short term – as it can take more than 10 years for a pine seedling to become merchantable and reach the minimum diameter requirements to be classified as pulpwood. However, adequate supply levels are expected to remain in the meantime. Furthermore, pine pulpwood inventory levels are expected to increase in the mid-to-long terms as a result of the increased harvest levels and stand reestablishment levels that have occurred in the catchment area since 2014.

A reduction in the sequestration rate of carbon?

No / Inconclusive. US Forest Service data shows the average annual growth rate of total growing stock timber has remained nearly unchanged (holding between 6.0% and 6.1%) in the catchment area since 2011, which would suggest that the sequestration rate of carbon has also changed very little in the catchment area the last 8-10 years. However, the 11% increase in total growing stock inventory since 2011 does indicate that total carbon storage levels have increased in the Georgia catchment area since Georgia Biomass commenced operations in this market.

An increase in harvesting above the sustainable yield capacity of the forest area?

No. Growth-to-removals (G:R) ratios, which compare annual timber growth to annual harvests, provides a measure of market demand relative to supply as well as a gauge of market sustainability. In 2018, the latest available, the G:R ratio for pine pulpwood, the predominant timber product utilized by the bioenergy sector, equaled 1.06 (a value greater than 1.0 indicates sustainable harvest levels). Note, however, that the pine pulpwood G:R ratio averaged 1.44 from 2012-2017. The significant drop in 2018 was due to a 31% increase in removals (due to Hurricane Michael) and is not reflective of the new norm. Specifically, pine pulpwood removals are projected to be more in line with pre-2018 levels in 2019 and 2020, and so too is the pine pulpwood G:R ratio.

Timber growing stock inventory

Neutral. According to USFS data, inventories of pine pulpwood decreased 11% in the catchment area from 2011-2018. However, that decrease was not due to increased demand from bioenergy. Typically, a reduction in inventory is linked to harvest levels above the sustainable yield capacity of the forest area, but in this case, annual growth of pine pulpwood exceeded annual removals every year during this period.

Ultimately, the decrease in pine pulpwood inventory from 2011-2018 can be linked to decreased pine sawtimber production beginning in the mid-2000s. Specifically, annual removals of pine sawtimber decreased 24% from 2005-2014, and the reduction in harvest levels during this period meant fewer new pine stands were reestablished, and that has led to the current reduction in pine pulpwood inventory. (Note that the decrease in pine sawtimber removals from 2005-2014 was mirrored by a 27% increase in pine sawtimber inventory over this same period). However, USFS data shows that annual removals of pine sawtimber have increased 50% in the Georgia catchment area since 2014, which suggests that pine pulpwood inventory levels will start to increase in the catchment area due to increased harvest levels and the subsequent increase in stand reestablishment levels.

Timber growth rates

Neutral. Timber growth rates have increased for both pine sawtimber and pine chip-n-saw but decreased slightly for pine pulpwood in the catchment area since 2011. Evidence suggests that this decrease in pine pulpwood growth rate is not due to increases in bioenergy demand, but rather linked to changes in diameter class distribution and indicative of a forest in a state of transition, where timber is moving up in product class (i.e. pine pulpwood is moving up in classification to pine chip-n-saw).

Forest area

Neutral. In the Georgia catchment area, total forest area (timberland) decreased more than 115,000 hectares (-2.8%) from 2011 through 2018. Note that this decrease coincided with a roughly 19,000-hectare increase in cropland and 93,000-hectare increase in urban land and land classified as having other uses.

Specifically, pine timberland, the primary source of roundwood utilized by the bioenergy industry, decreased over 34,000 hectares from 2011-2016. However, from 2016-2018, pine timberland stabilized and rather increased more than 17,000 hectares in the catchment area (or a net decrease of roughly 17,000 hectares from 2011-2018). Ultimately, there is little evidence that the decrease in pine timberland from 2011-2016 or increase since 2016 is linked to increased bioenergy demand. Rather, the overall decrease in pine timberland since 2011 appears to be more closely linked to the relative weakness of pine sawtimber markets in the Georgia catchment area and the lack of return from sawtimber.

Wood prices

Positive / Negative. Intuitively, an increase in demand should result in an increase in price, and this is what the data shows in the Georgia catchment area as it relates to increased biomass demand from Georgia Biomass and Fram and the prices of the various raw materials consumed by these mills. Specifically, the 1.4-million metric ton increase in softwood pulpwood demand attributed to Georgia Biomass and Fram coincided with a 20% increase in delivered pine pulpwood price and a 10-15% increase in pine chip prices from 2011-2015. Since 2015, biomass demand has held relatively steady, and, overall, so too have delivered pine pulpwood and pine chip prices. The apparent link between increased bioenergy demand and increased pine raw material prices is supported further by statistical analysis, as strong positive correlations were found between softwood biomass demand and both delivered pine pulpwood and pine chip prices. However, note that biomass demand alone is not responsible for these changes in prices, as softwood biomass demand accounts for only 10-15% of total softwood pulpwood demand in the catchment area. Rather, the prices of these raw materials are impacted to a larger degree by demand from other sources (i.e. pulp/paper), which accounts for 85-90% of total softwood pulpwood demand in the Georgia catchment area.

On the other hand, it’s also important to note that the increase in bioenergy-related wood demand has been a positive for forest landowners in the Georgia catchment area. Not only has bioenergy provided an additional outlet for pulpwood in this market, but the increase in pulpwood prices as a result of increased pulpwood demand has transferred through to landowners (improved compensation). Specifically, since 2015, pine pulpwood (PPW) stumpage price – the price paid to landowners – has averaged more than $17 per ton in the Georgia catchment area. This represents a 70% increase over the approximately $10 per ton averaged by PPW stumpage in the catchment area over the last five years prior to Georgia Biomass’ startup in 2Q 2011.

(Note: Pine pulpwood stumpage prices are notably higher in the Georgia catchment area due to a much tighter balance in supply and demand (in comparison to most other markets across the US South). For instance, in all other areas across the US South2, PPW stumpage prices have averaged less than $9 per ton since 2015, or roughly half that of prices in the Georgia catchment area).

Markets for solid wood products

Positive. In the Georgia catchment area, demand for softwood sawlogs used to produce lumber and other solid wood products increased an estimated 39% from 2011-2019, and by-products of the sawmilling process are sawmill residuals – materials utilized by Georgia Biomass and the Fram mills to produce wood pellets. With the increased production of softwood lumber, so too has come an increase in sawmill residuals, some of which have been purchased/consumed by Georgia Biomass and Fram. Not only have these pellet producers benefited from the greater availability of this by-product, but lumber producers have also benefited, as the Georgia Biomass and Fram mills have provided an additional outlet for these producers and their by-products.

Read the full report: Georgia Biomass Catchment Area Analysis.

This is part of a series of catchment area analyses around the forest biomass pellet plants supplying Drax Power Station with renewable fuel. Others in the series include: ChesapeakeEstonia, Latvia and Drax’s own, other three mills LaSalle BionergyMorehouse Bioenergy and Amite Bioenergy.

Plant more forests and better manage them

Working forests in the US South

There is an ongoing debate about forests’ contribution to fighting the climate crisis.

Forests can act as substantial and effective tools for carbon sequestration during a high growth phase. They can also function as significant and extensive carbon storage areas during maturity and throughout multiple stages of the age class cycle, if managed effectively at a landscape level. Or, they can be emitters of carbon if over-harvested, subject to fire, storm, pest or disease damage.

Different age class forest stands in Louisiana

In a natural state, forests will go through each of these life phases: rapid early growth; maturity and senescence; damage, decay and destruction through natural causes. Then they begin the cycle again, absorbing and then emitting carbon dioxide (CO2) in a continual succession.

Recently, loud voices have argued against forest management per se; against harvesting for wood products in particular, suggesting that this reduces both forest carbon stocks and sequestration capacity.

Pine cut in into wood for different wood products markets in Louisiana. Big, thick, straight higher value sections go to sawmills and smaller and misshapen low-grade wood not suitable for timber production is sold to pulp, paper or wood pellet mills.

Many foresters consider that this is just not correct. In fact, the opposite is true. Research and evidence clearly support the foresters’ view. Active forest management, when carried out appropriately, actually increases the amount of carbon sequestered, ensures that carbon is stored in solid wood products, and provides substantial savings of fossil fuels by displacing other high carbon materials (e.g. concrete, steel, brick, plastic and coal).

Oliver et al.(2014)[1] compared the impact of forest harvesting and the use of wood products to substitute other high-carbon materials, concluding that: ‘More CO2 can be sequestered synergistically in the products or wood energy and landscape together than in the unharvested landscape. Harvesting sustainably at an optimum stand age will sequester more carbon in the combined products, wood energy, and forest than harvesting sustainably at other ages.’

This research demonstrated that an increase in the use of structural timber to displace concrete and steel could lead to substantial emissions savings compared to unharvested forest. The use of wood for energy is an essential component of this displacement process, although it is important to use appropriate feedstocks. Burning wood that could be used for structural timber will not lead to a positive climate impact.

The message here is to manage working forests for optimum sawlog production for long-life solid wood products and utilise the by-products for energy where this is the most viable market, this provides the best all-round climate benefit.

What happens when you close the gate

Closing the forest gate and stopping all harvesting and management is one option being championed by some climate change campaigners. There is certainly a vital role for the preservation and protection of forests globally: primary and virgin forests, intact landscapes, high biodiversity and high conservation value areas all need to be protected.

That doesn’t necessarily mean that there is no forest management. It should mean careful and appropriate management to maintain and ensure the future of the resource. In these cases, management is with an objective to reduce the risk of fire, pests and disease, rather than for timber production.

Globally, we need better governance, understanding and implementation of best practice to achieve this. Forest certification and timber tracing systems are a good start. This can equally apply to the many hundreds of millions of hectares of ‘working forest’ that do not fall into the protection categories; forests that have been managed for many hundreds of years for timber production and other purposes. Harvesting in these forests can be more active, but governance, controls and the development of best practice are required. Better management not less management.

During the 1970s there was a significant change of policy in the US, aimed at removing massive areas of publicly owned forest from active management – effectively closing the gate. The drivers behind this policy were well meaning; it was intended to protect and preserve the habitat of endangered species, but the unintended consequences have also had a substantial impact. In the 1970s little thought was given to the carbon sequestration and storage potential of forests and climate change was not at the top of the agenda.

The west coast of the US was most substantially affected by these changes, more than in the US South, but the data below looks at the example of Mississippi which is primarily ‘working forest’ and 88% in private ownership.

Pine trees in Mississippi working forest

This is the location of Drax’s Amite pellet mill. The charts below show an interesting comparison of forest ownership in Mississippi where limited or no harvesting takes place and where active management for timber production occurs. In the short term the total volume of timber stored per hectare is higher where no harvesting occurs. This makes sense since the forest will keep growing until it reaches its climax point and succumbs to fire, pest or disease.

Average standing volume per unit area in the private sector, where active management occurs, is the lowest as timber is periodically removed for use in solid wood products. Remember that the Oliver et al. analysis (which does not include re-growth), showed that despite a short-term reduction in forest carbon, the total displacement of high-carbon materials with wood for structural timber and energy leads to a far higher emissions saving. It is better to have a lower stock of carbon in a working forest and to be continually sequestering new carbon for storage in solid wood products.

Average standing volume per acre by ownership class, Mississippi[2]

Comparing the average annual growth rates across all forest types in Mississippi, annual growth in the private sector is almost double that in the unharvested public forest. This differential is increased even further if only commercial species like pine are considered and a comparison is made between planted, well managed forests and those that are left to naturally regenerate.

Average growth rates per acre by ownership class, Mississippi[3]

The managed forest area is continually growing and storing more carbon at a materially higher rate than less actively managed forest. As harvesting removes some forest carbon, these products displace high carbon materials in construction and energy and new young forests are replacing the old ones.

We know that forests are not being ‘lost’ and that the overall storage of carbon is increasing. For example, the Drax catchment area analysis for the Amite biomass wood pellet plant showed an increase in forest area of 5,200 ha and an increase in volume of 11 million m3 – just in the area around the pellet mill. But what happens to protected forest area, the forest reserve with limited or no harvesting?

Over the last 20 years the average annual loss of forest to wildfire in the US has been 2.78 million ha per year (the same as the UK’s total area of productive forest). According to the USFS FIA database the average standing volume of forests in the US is 145 m3 per ha (although in the National Park land this is 365 m3 per ha). Therefore, wildfires are responsible for the average annual combustion of 403 million m3 of wood p.a. (equal to the total annual wood harvest of the US) or 2.5 billion m3 if entirely in National Parks.

One cubic metre equates to a similar quantity of CO2 released into the atmosphere each year, therefore wildfires are responsible for between 407 million and 2.5 billion tonnes of CO2 emissions in the US each year[4].

Wildfires in the US

Starrs et al. (2018)[5] demonstrated that the risk of wildfire was significantly higher in federally owned reserved forest (where harvesting and management were restricted), compared to privately owned forests with active management.

In California, the risk of wildfire in federal forest (2000-15) was almost double the risk in private forests where both had State firefighting resources. The risk of fires in federal lands had increased by 93% since 1950-66, compared to only 33% in non-federal forests, due to the change in forest management practice in the 1970s.

Forest fire in California

Closing the gate means that the carbon stock is maintained and grows in the short term, but there is no opportunity for carbon to be stored in solid wood products, no high-carbon materials are displaced (concrete, steel and fossil fuels) and the rate of sequestration declines as the forest ages. Eventually the forest will reach its natural climax and die, releasing all of that carbon back into the atmosphere. The managed forest, by contrast, will have a lower standing volume at a certain point in time, but will be in a continual cycle of sequestration, storage and regrowth – with a much lower risk of fire and disease. If managed correctly, the rate of growth and standing volume will also increase over time.

How should we manage the forest

Forests are extremely variable, there are a vast variety of tree species, soil, geological features, water regimes, temperature, climate and many other factors that combine to make unique ecosystems and forest landscapes. Some of these are rare and valuable for the exceptional assemblages they contain, some are commonplace and widespread. Some are natural, some man-made or influenced by human activity.

Forests have many important roles to play and careful management is required. In some cases that management may be protection, preservation and monitoring. In other cases, it may be active harvesting and planting to optimise growth and carbon storage.

Cypress forests in the Atchafalaya Basin in Louisiana are an example of a forest landscape where the suitable management practice is protection, preservation and monitoring

For each forest type and area, we need to recognise the highest or best purpose(s) for that land in the objectives set and carefully plan the management to optimise and sustain that value. The primary value could be in species and habitat diversity or rarity; provision of recreation and aesthetic value; production of timber, forest products and revenue generation; carbon sequestration and storage; water management and other ecosystem benefits.

Most likely it will be a combination of several of these benefits. Therefore, best management practice usually involves optimising each piece of forest land to provide the most effective combination of values. Forests can deliver many benefits if we are sensible about how we manage them.

In a recent study Favero et al. (2020)[6] concluded that: Increased bioenergy demand increases forest carbon stocks thanks to afforestation activities and more intensive management relative to a no-bioenergy case. Some natural forests, however, are converted to more intensive management, with potential biodiversity losses…the expanded use of wood for bioenergy will result in net carbon benefits, but an efficient policy also needs to regulate forest carbon sequestration.

[1] CHADWICK DEARING OLIVER, NEDAL T. NASSAR, BRUCE R. LIPPKE, and JAMES B. McCARTER, 2014. Carbon, Fossil Fuel, and Biodiversity Mitigation with Wood and Forests.
[2] US Forest Service, FIA Database, 2020.
[3] US Forest Service, FIA Database, 2020.
[4] Assumes an average basic density of 570kg/m3 and 50:25:25 ratio of cellulose, lignin and hemicellulose.
[5] Carlin Frances Starrs, Van Butsic, Connor Stephens and William Stewart, 2018. The impact of land ownership, firefighting, and reserve status on fire probability in California.
[6] Alice Favero, Adam Daigneault, Brent Sohngen, 2020. Forests: Carbon sequestration, biomass energy, or both?

Changing forest structure in Virginia and North Carolina

Photos: Roanoke Rapids area near the North Carolina, Virginia border, courtesy of Enviva.

Forest owners have responded to the recovery in pine saw-timber markets, since the global financial crisis of 2008, by planting more forest and investing more in the management of their land. The same period has witnessed increased demand from the biomass sector which has replaced declining need for wood from pulp and paper markets.

The area of timberland (actively managed productive forest) has increase by around 89,000 hectares (ha) since 2010. This change is due to three important factors: new planting on agricultural land; the planting of low-grade self-seeded areas with more productive improved pine; and the re-classification by the US Forest Service (USFS) of some areas of naturally regenerated pine from woodland to timberland.

The 2018 data shows that pine forest makes up 46% of the timberland area, of which 61% is planted and the remainder naturally regenerated. Hardwoods cover 43% of the timberland area, with 93% of this naturally regenerated. The remaining area is mixed stands.

Composition of timberland area

Since 2000 there have been some significant changes in the composition of the timberland area with a transition from hardwood to softwood. Pine has increased from 39% of the total area in 2000 to 46% in 2018 and hardwood has decreased from 50% to 43% over the same period.

All pine areas have increased since 2000 with naturally regenerated pine increasing by 13,000 ha and planted pine by 340,000 ha since 2000. Mixed stands have declined by 6,500 ha as some of these sites have been replanted with improved pine to increase growth and saw-timber production.

The biggest change has been in the hardwood areas where there has been a decline of around 314,000 ha, despite the total area of timberland increasing by 31,000 ha.

Change in forest type

This change has been driven by private forest owners (representing 91% of the total timberland area), seeking to gain a better return on investment from their forest land.

Hardwood markets have declined since the 2008 recession and demand for hardwood saw-timber has not recovered. Demand for pine saw-timber has rebounded and is now as strong as pre-crisis.

Pine also offers much faster growth rates and higher total volumes in a much shorter time frame (typically 25-35 years compared to 75-80 years for hardwoods).

The decision to change species is similar to a farmer changing their agricultural crops based on market demand and prices for each product. Where forests are managed for revenue generation then it is reasonable to optimise the land and crop for this objective. This can be a significant positive, from a carbon perspective more carbon is sequestered in a shorter time frame and more carbon is stored in long term wood products, if the quantity if saw-timber is increased.

Increased revenue generation also helps to maintain the forest area (rather than conversion to urban development, agriculture or other uses).

A potential negative is the change in habitat from a pure hardwood stand to a pure pine stand, each providing a different ecosystem and supporting a different range of flora and fauna. There is no conclusive evidence that one forest type is better or worse than the other; there is a great deal of variety of each type.

Some hardwood forests are rich in species and biodiversity, others can be unremarkable. The key is not to endanger or risk losing any species or sensitive habitat and to ensure that any conversion only occurs where there is no loss of biodiversity and no negative impact to the ecosystem.

It is not clear whether all of the lost hardwood stands have been directly converted to pine forests, some hardwood stands may have been lost to other land uses (urban and other land has increased by 400,000 ha). Some may have been directly converted to pine by forest owners encouraged by the increase in pine saw-timber demand and prices.

Whatever the primary driver of this change it is clearly not being driven by the biomass sector.

Change in forest type – timing

The chart above demonstrates that the biggest change, loss of hardwood and increase in planted pine, occurred between 2000 and 2012, prior to the operation of the pellet mills. Since 2012, there has been no significant loss of natural hardwood and only a small decline in planted hardwood.

Read the full report: Catchment Area Analysis of Forest Management and Market Trends: Enviva Pellets Ahoskie, Enviva Pellets Northampton, Enviva Pellets Southampton (UK metric version). Explore Enviva’s supply chain via Track & Trace. This is part of a series of catchment area analyses around the forest biomass pellet plants supplying Drax Power Station with renewable fuel. The series includes: Estonia, Morehouse Bioenergy, Amite Bioenergy, and the Drax forestry team’s review of the Chesapeake report on Enviva’s area of operations.

Responsibility, wellbeing and trust during the COVID-19 outbreak

Engineers in PPE working at Drax Power Station

We are living through unprecedented times. Coronavirus is having far reaching effects on all industries not just here in the UK, but around the world. At Drax, we take our responsibilities as a member of critical national infrastructure and as an essential service provider very seriously. We are committed to maintaining a continuous, stable and reliable electricity supply for millions of homes and businesses in the UK.

The wellbeing of our people

Firstly, I’d like to thank our employees, contractors, supply chain workers and their families as well as the communities in the UK and US in which we operate, for their fantastic support and continued hard work during these difficult and uncertain times. Our employees’ health and wellbeing are vital, and we’re working hard to ensure we are supporting them with both their physical and mental health, whether working at home or at one of our sites.

Engineer maintaining equipment in Drax Power Station

Engineer maintaining equipment in Drax Power Station [Click to view/download]

Across all our sites we are have implemented strategies to reduce the chances of people spreading the virus and have operational plans in place to ensure continued delivery of power into the grid.

Power station resilience

At Drax Power Station, the UK’s largest power station, largest decarbonisation project in Europe and biggest source of renewable power into the national grid, we have arranged for the separation of key operational teams and employees so that they are physically distanced from each other. We have moved as many employees as possible to work from home, so that there are fewer people in our workplaces reducing the risk of the spread of infection, should it arise. We have strict controls on visitors to the site and on our contractors and suppliers. Our resilience teams are working well and we have contingency plans in place to manage risks associated with colleague absences.

We have closed the visitor centres at Cruachan pumped storage hydro power station and Tongland hydro power station in Scotland, as well as at Drax Power Station in North Yorkshire. We have also stopped all but critically important travel between our sites.

Our supply chain

Sustainable biomass wood pellets destined for Drax Power Station unloaded from the Zheng Zhi bulk carrier at ABP Immingham [Click to view/download]

It is vital we maintain a resilient supply chain for the sustainably sourced biomass wood pellets required to produce electricity at Drax Power Station, the country’s largest power station. We’re working closely with our suppliers in the US and Europe to maintain biomass supplies as well as with rail and port infrastructure in the US and UK to ensure continuity of supply.

Just last week Associated British Ports (ABP) and Drax received and unloaded the largest ever shipment of sustainable biomass to arrive at the Port of Immingham in the UK’s Humber region. The vessel transported 63,907 tonnes of Drax’s wood pellets from the US Port of Greater Baton Rouge in Louisiana. The consignment supplies Drax Power Station with enough renewable fuel to generate electricity for 1.3 million homes.

Our three wood pellet manufacturing plants are running well, with US authorities classifying our employees as key workers. The same is the case for our rail freight partners on both sides of the Atlantic. In the UK, GB Railfreight recognises the strategic importance of biomass deliveries to Drax Power Station.

Our customers

Businesses – both large and small – are feeling the economic effects of this virus. Our employees involved with the supply of electricity, gas and energy services to organisations are working hard to support them. More information can be found via these links:

We are working closely with BEIS, HM Treasury and our trade associations to explore how government and industry can further support business through this challenging time. Organisations facing financial difficultly can access the unprecedented level of support already announced by the Chancellor, Rishi Sunak via:

Drax employee in high visibility clothing on the telephone

Drax employee in high visibility clothing on the telephone [Click to view/download]

Leadership

Our Executive Committee is meeting regularly via video conference to discuss our contingency planning as the situation changes. We are working closely with the UK, US state and Canadian governments, National Grid and Ofgem to ensure that we remain up to date with the latest advice and that we are prepared for any further escalation.

This is an unprecedented time for the UK and the world. Rest assured that Drax’s critical national infrastructure and essential service operations, as well as its employees, are working hard 24/7 to make sure individuals, families, businesses and organisations are supplied with the vital electricity needed to keep the country running.

Estonia catchment area analysis

View from Suur Munamagi over forest landscape in South Estonia.

Estonia is a heavily forested country with a mature forest resource that has been neglected over many years due to political and ownership changes. Management of state and corporate owned forests is now good, but some small privately-owned areas of forest are still poorly managed.

Despite this, both the forest area and the growing stock have been increasing, largely due to new planting and the maturing age class of existing forest.

Forest area has increased from 49% to 52% of the total land, increasing by more than 118 thousand hectares since 2010.

Land use in Estonia

Land use in Estonia [click to view/download]

Over the same period the growing stock increased by 52 million m3, with 60% of this growth in softwood and 40% in hardwood species. The data shows a slight decline in 2018 but this is due to a sampling error and the growing stock is thought to have been maintained at 2017 levels (this should be rectified in the 2019 data when available).

Change in forest growing stock – Estonia

Change in forest growing stock – Estonia [click to view/download]

The forests of Estonia have been going through a period of restitution since the 1990s. Land that had been taken into state ownership during Soviet rule has been given back to private owners. This process was complex and lengthy and limited active management in the forest during this time.

Since 2008, harvesting and management has increased. Private and corporate forest owners have been harvesting forest that had been mature and ready for clear felling. The longer-term harvesting trend has been considerably lower than annual growth (increment) and the maximum sustainable harvesting level, as shown on the chart below.

Annual increment and harvesting levels

Annual increment and harvesting levels [click to view/download]

In 2018 harvesting reached an all time high at just over 14 million m3 and just under the maximum threshold. It is expected to remain at this level as more forest matures and enters the cycle of harvest and regeneration.

Clear cutting (regeneration felling) is the largest operation by volume but thinning (maintenance felling) is the largest by area.

This indicates a forest landscape in balance, with widespread thinning to produce more sawlog trees and a large volume of clear cuts in the mature stands to make way for the next generation of forests.

Reforestation in Estonia. * Note: Since 2014 it has not been compulsory for private and other forest owners to submit reforestation data. [Click to view/download]

Reforestation in Estonia. * Note: Since 2014 it has not been compulsory for private and other forest owners to submit reforestation data. [Click to view/download]

Planting of seedlings is the most common form of regeneration. However, some native hardwood species are strong pioneers and naturally regenerate among the spruce and pine stands. This has led to a change in the species composition of some forests with an increase in hardwoods, although this is relatively small scale and only prevalent among some small private owners that do not invest in clearing unwanted regeneration.

Species mix in Estonian forests [Click to view/download]

Species mix in Estonian forests [Click to view/download]

Markets and prices for forest products

Sunrise and fog over forest landscape in Estonia

Sunrise and fog over forest landscape in Estonia

Pulpwood markets are limited in Estonia and this material has been historically exported to neighbouring Finland and Sweden. Export demand has had a significant impact on prices as can be seen in a spike in 2018 when demand was at its strongest.

The forest industry has been dominated by sawmills and panel board mills. Demand and production in this sector has been increasing and this has kept prices high. There is a substantial differential between sawlog and pulpwood pricing.

Comparison of sawlog and pulpwood prices [click to view/download]

Comparison of sawlog and pulpwood prices [click to view/download]

The pellet industry developed due to the abundance of low-grade fibre available domestically. This included sawmill and forest residues, as well as low grade roundwood from thinnings and clear cuts. Drax’s suppliers use a combination of these feedstock sources as shown below.

Drax feedstocks from Estonia 2018 [click to view download]

Sunrise through forest in Estonia

Sunrise through forest in Estonia

Summary of key questions addressed in the analysis:

Impacts of wood-based bioenergy demand to forest resources:

Forest area / forest cover

No negative impact. Regardless of increasing domestic biomass utilisation for energy and exports, forest area has increased due to afforestation programmes. Forest cover is not as high as forest area, due to temporarily un-stocked area after clear-cut. Despite this, forest cover has continuously increased from 2010–2018.

Growing stock

No negative impact. The total forest growing stock has been increasing for the last two decades. In 2018 the growth slowed or halted (official statistics show a decrease, but this is due to sampling error). In 2018 there was record-high wood demand from Finland, which was driven by high global pulp prices motivating maximal pulp production. This increased harvests to a previously unseen level.

Harvesting levels

Slight increasing impact. During 2004–2011, harvesting levels in Estonia were less than half of the estimated maximum sustainable level. This resulted in an increase in the maximum sustainable harvesting level for the 2011–2020 period. In 2018, the harvesting volumes were at the maximum sustainable level. The main drivers increasing the harvesting volumes have been increased sawmill capacity and production, high demand for pulpwood in Finland and Sweden and improved demand for energy wood. This was a temporary peak and demand has already slowed. Softwood lumber prices have decreased significantly in Europe due to an abundance of wood supply from Central Europe, which has been created by widespread bark beetle and other forest damages. Global pulp prices have also decreased to below 2017 prices.

Forest growth / carbon sequestration potential

Ambivalent impact. The annual increment has grown throughout the 2000–2018 period. Increased fuelwood price has enabled forest management in some of the alder forests that were completely unutilised in the past. Thinnings, both commercial and pre-commercial, accelerate long-term volume growth in forests, leading to increased carbon sequestration. Removal of harvesting residues decreases carbon sequestration since the residues are input to the soil carbon pool. However, the majority of the harvesting residues’ carbon is released to the atmosphere when the biomass decays, so the ultimate impact of harvesting residue collection is minimal if the collection is done on a sustainable level. The sustainability of the collection is determined by how the soil nutrient balance is impacted by collection. This is not accounting for the substitution effect that the harvesting residues may have, by e.g. reducing the need to burn fossil fuels. Utilisation of sawmill by-products does not directly impact forests’ carbon sequestration potential, but it can increase harvesting through improved sawmill overall profitability.

Impacts of wood-based bioenergy demand to forest management practices:

Rotation lengths

Neutral. Forest law regulates minimum forest age for clear-cuts. According to interviews, Riigimetsa Majandamise Keskus (RMK – the Estonian state forest company), often conducts the final felling at the minimum age. Due to the regulation, an increase of wood-based bioenergy demand has not shortened rotations at least in state-managed forests. In forests that are older than the minimum final felling age, sawlog price is a more important driver for final-felling decisions than wood-based bioenergy demand.

Thinning

Increasing impact. The increase of bioenergy demand has increased the demand for small-diameter hardwood, which in turn has increased thinnings in previously unmanaged forest stands. This will increase the availability of good quality sawlogs and will also accelerate the carbon sequestration (tonnes/ha/year) of the forests. However, the total forest carbon stock (tonnes/ha) will be reduced; in unmanaged (e.g. no thinnings) mature stands, the carbon stock is larger than in managed stands of similar age. The carbon stock of a thinned stand will remain below that of an unthinned stand regardless of post-thinning accelerated growth.

Conversion from hardwood to softwood

Neutral. No indication of hardwood conversion to softwood was found.

Impacts of wood-based bioenergy demand to solid wood product (SWP) markets:

Diversion from other wood product markets

Neutral. Production of sawnwood, wood-based panels, pulp and paper products have increased or remained steady, i.e. no evidence of diversion.

Wood prices

Slight increasing impact. During 2017–2018, the price of all roundwood assortments increased notably. The increase was strongest in pulpwood assortments, especially those that are not further processed domestically but are exported to mainly Finland and Sweden. Finnish demand for pulpwood was at a very high level in 2018. This was a temporary trend, however, and prices and demand have since decreased. The price increase for fuelwood was less dramatic, no sharp increases are observed. According to interviews, pellet production was the most important driver of fuelwood prices.

Read the full report: Catchment Area Analysis in Estonia. A 2017 interview with Raul Kirjanen, CEO of Graanul Invest, a wood pellet supplier of Drax operating in Estonia, can be read here. Read how Drax and Graanul work with NGOs when concerns are raised within our supply chain here.

Read more about how bioenergy has no negative impact on Estonia’s forest resources here.

This is part of a series of catchment area analyses around the forest biomass pellet plants supplying Drax Power Station with renewable fuel. Others in the series include: Georgia Mill, Latvia, Chesapeake and Drax’s own, other three mills LaSalle BionergyMorehouse Bioenergy and Amite Bioenergy.

Morehouse catchment area analysis

Working forest in southern Arkansas within the Morehouse catchment area

The forest area around the Drax Morehouse BioEnergy plant has a long history of active management for timber production. 96% of the forest owners are private and around half of these are corporate investors seeking a financial return from forest management. The pulp and paper (p&p) sector dominates the market for low grade roundwood with over 75% of the total demand. The wood pellet markets use only 6% of the roundwood, of which 4% is used by Morehouse.

Given the small scale of demand in the pellet sector, the extent of influence is limited. However, the new pellet markets have had a positive impact, replacing some of the declining demand in the p&p sector and providing a market for thinnings for some forest owners and a new off-take for sawmill residues.

Pine forest is dominant in this area with an increasing inventory (growing stock) despite a stable forest area. Active management of pine forests has increased the amount of timber stored in the standing trees by 68 million tonnes from 2006 to 2018.  Over the same period the hardwood inventory remained static.

Chart showing historic inventory and timberland area in Morehouse catchment

Historic inventory and timberland area in Morehouse catchment; click to view/download.

US Forest Service FIA data shows that the pine resource in this catchment area has been maturing, the volume of timber has been increasing in each size class year on year. This means that the volume available for harvesting is increasing and that more markets will be required to utilise this surplus volume and ensure that the long-term future of the forest area can be maintained.

Chart showing historic pine inventory by DBH Class

Historic pine inventory by DBH Class in Morehouse catchment; click to view/download.

This is reflected in the growth drain ratio – the comparison of annual growth versus harvesting. A ratio of one shows a forest area in balance, less than one shows that harvesting is greater than growth. This can be the case when the forest area is predominantly mature and at the age when clear cutting is necessary.

A growth drain ratio of more than one shows that growth exceeds harvesting, this is typically the case in younger forests that are not yet ready for harvesting and are in the peak growing phase, but it can also occur when insufficient market demand exists and owners are forced to retain stands for longer in the absence of a viable market.

Drax Morehouse plant

Drax’s Morehouse BioEnergy compressed wood pellet plant in northern Louisiana

This can have a negative impact on the future growth of the forest; limiting the financial return to forest owners and reducing the cumulative sequestration of carbon by enforcing sub-optimal rotation lengths.

The current growth drain ratio of pine around Morehouse is 1.67 with an average annual surplus of around 7 million metric tonnes. This surplus of growth is partly due to a decline in saw-timber demand due to the global financial crisis but also due to the maturing age class of the forest resource and the increasing quantity of timber available for harvesting.

Historic growth and removals of pine in Morehouse catchment (million metric tonnes)

YearGrowthRemovalsNet GrowthGrowth-to-Drain
200914.112960762411.1860124622.92694830041.26166145535
201014.580331100610.91819493463.662136166021.33541589869
201115.129903273610.72162297824.408280295451.41115792865
201215.357258404710.30755904395.049699360811.48990254039
201315.63898206189.701617808065.93736425371.61199733603
201415.91041518229.376564771556.533850410651.69682773701
201515.94235364499.669133266476.273220378431.64878828387
201616.43527840789.579357241816.855921165961.71569740985
201716.838075354610.1594737396.678601615681.65737672908
201817.770968348910.65938820047.111580148561.66716588371

The chart below shows the decline in pine saw-timber demand in the catchment area following the financial crisis in 2008. It also shows the recent increase in pulpwood demand driven by the new pellet mill markets that have supplemented the declining p&p mills.

Sawmills are a vital component of the forest industry around Morehouse, with most private owners seeking to maximise revenue through saw-timber production from pine forests.

As detailed in the table below, there are 70 markets for higher value timber products around this catchment area. These mills also need an off-taker for their residues and the pellet mills can provide a valuable market for this material, increasing the viability of the saw-timber market.

Operating grade-using facilities near Morehouse timber market

TypeNumber of MillsCapacityCapacity UnitsHardwood Roundwood At Mill From MarketSoftwood Roundwood At Mill From Market
Consumption, million green metric tonnes
Lumber6810538.8235294M m³1.737194320550.88604623042613.06745552335.69986977638
Plywood/Veneer2904M m³000.9617438725360.506109617373
Total701.737194320550.88604623042614.02919939586.20597939376

Pulp and paper mills dominate the low grade roundwood market for both hardwood and softwood. The pellet mill market is small with just 3 mills and therefore does not influence forest management decisions or macro trends in the catchment area. However, demand for wood pellet feedstock exceeds 1.5 million tonnes p.a. and this can provide a valuable market for thinnings and sawmill residues. A healthy forest landscape requires a combination of diverse markets co-existing to utilise the full range of forest products.

Operating pulpwood-using facilities near Morehouse timber market

TypeNumber of MillsCapacityCapacity UnitsHardwood Roundwood At Mill From MarketSoftwood Roundwood At Mill From Market
Consumption, million green metric tons
Pulp/Paper117634.86896M metric tons3.489826926741.192570970097.557287050371.66598821268
OSB/Panel62412.55M m³002.567325398621.19890681942
Chips178395.08999M metric tons2.938909722111.46484421365.287607151192.18745126814
Pellets31573.965975M metric tons002.078219858451.01128896402
Total346.428736648862.6574151836917.49043945866.06363526426

In its analysis, Forisk Consulting considered the impact that the new pellet mills including Morehouse BioEnergy have had on the significant trends in the local forest industry. The tables below summarise the Forisk view on the key issues. In its opinion, the Morehouse plant has had no negative impact.

Bioenergy impacts on markets and forest supplies in the Morehouse market

ActivityIs there evidence that bioenergy demand has caused the following?Explanation
DeforestationNo
Change in forest management practiceNo
Diversion from other marketsPossiblyBioenergy plants compete with pulp/paper and OSB mills for pulpwood and residual feedstocks. There is no evidence that these facilities reduced production as a result of bioenergy markets, however.
Increase in wood priceNoThere is no evidence that bioenergy demand increased stumpage prices in the market.
Reduction in growing stocking timberNo
Reduction in sequestration of carbon / growth rateNo
Increasing harvesting above the sustainable yieldNo

Bioenergy impacts on forests markets in the Morehouse market

Forest metric Bioenergy impact
Growing Stock Neutral
Growth Rates Neutral
Forest Area Neutral
Wood Prices Neutral
Markets for Solid Wood Neutral to Positive*
*Access to viable residual markets benefits users of solid wood (i.e. lumber producers).

Read the full report: Morehouse, Louisiana Catchment Area Analysis. An interview with the co-author, Amanda Hamsley Lang, COO and partner at Forisk Consulting, can be read here. Explore every delivery of wood to Morehouse BioEnergy using our ForestScope data transparency tool.

This is part of a series of catchment area analyses around the forest biomass pellet plants supplying Drax Power Station with renewable fuel. Others in the series include: ,

Others in the series include: Georgia MillEstonia, Latvia, Chesapeake and Drax’s own, other three mills LaSalle BionergyMorehouse Bioenergy and Amite Bioenergy.