Tag: forestry and forest management and arboriculture

Latvia catchment area analysis

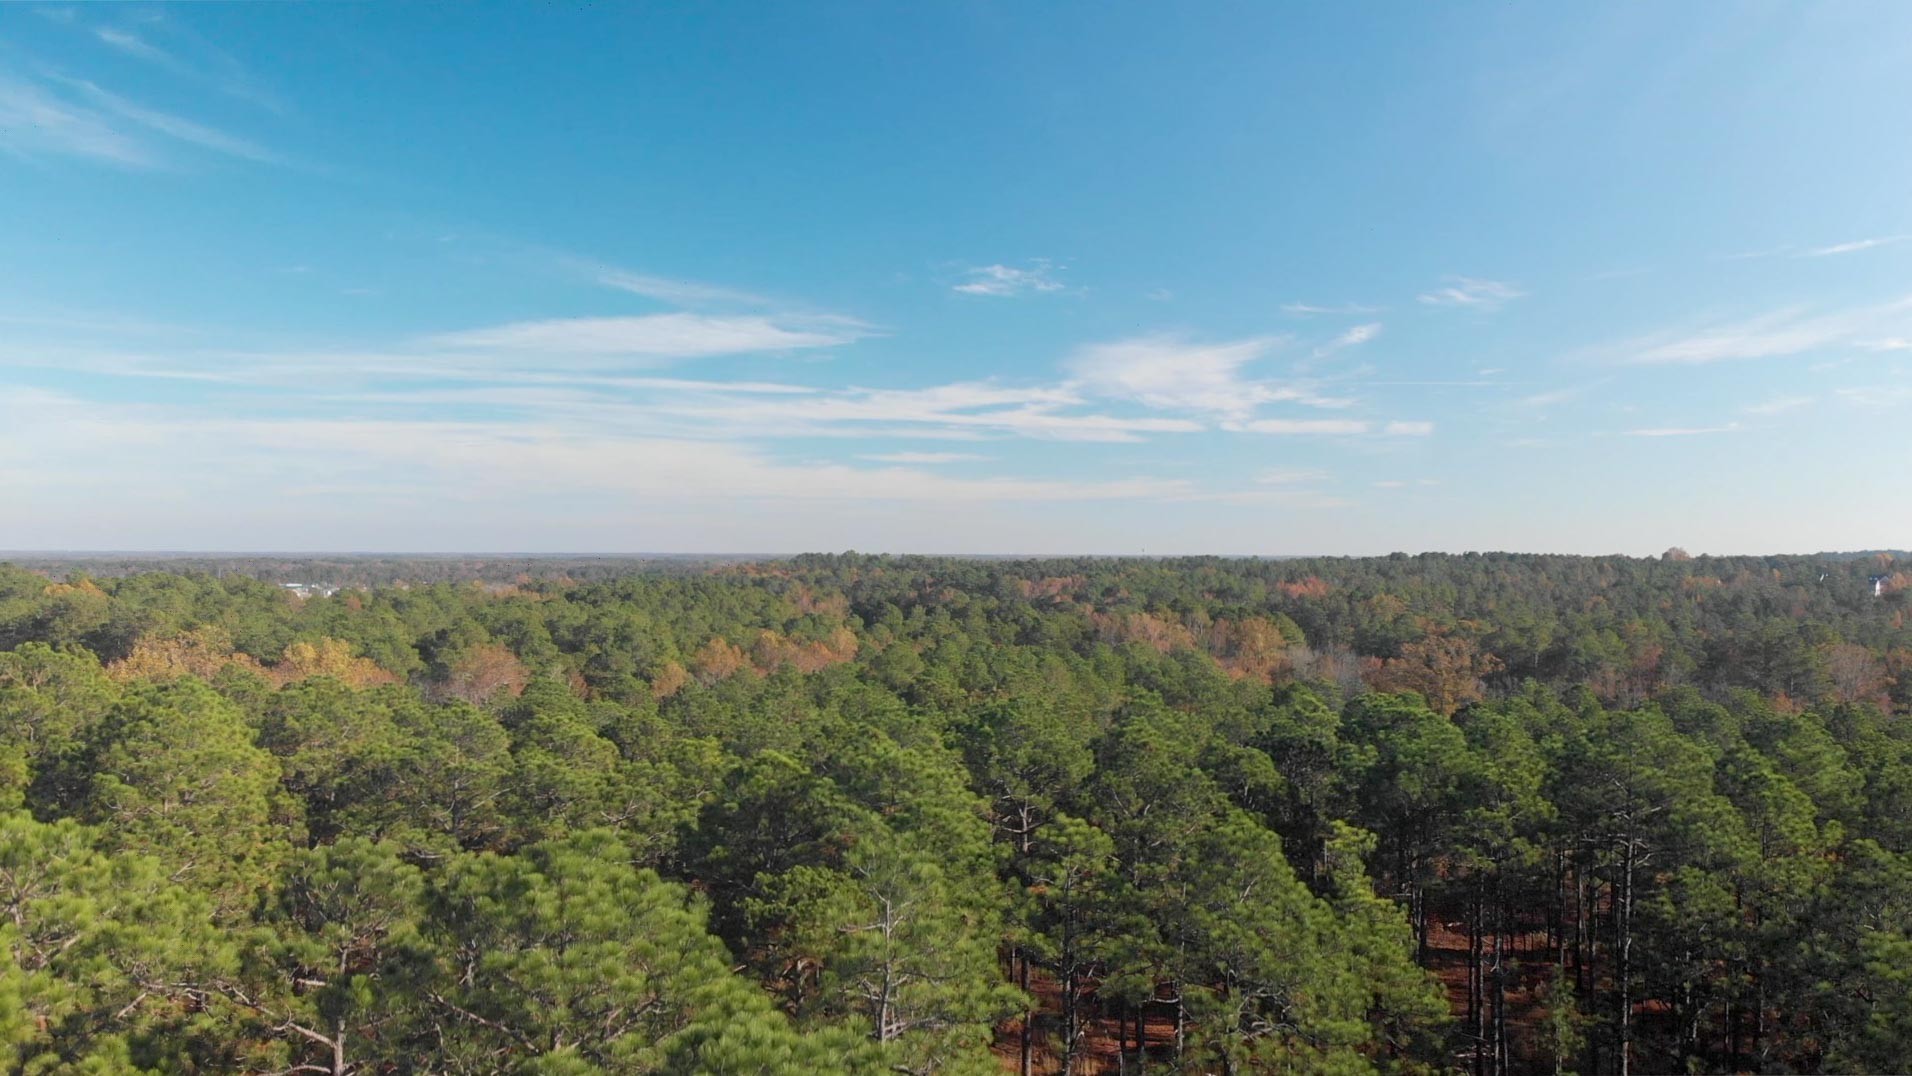
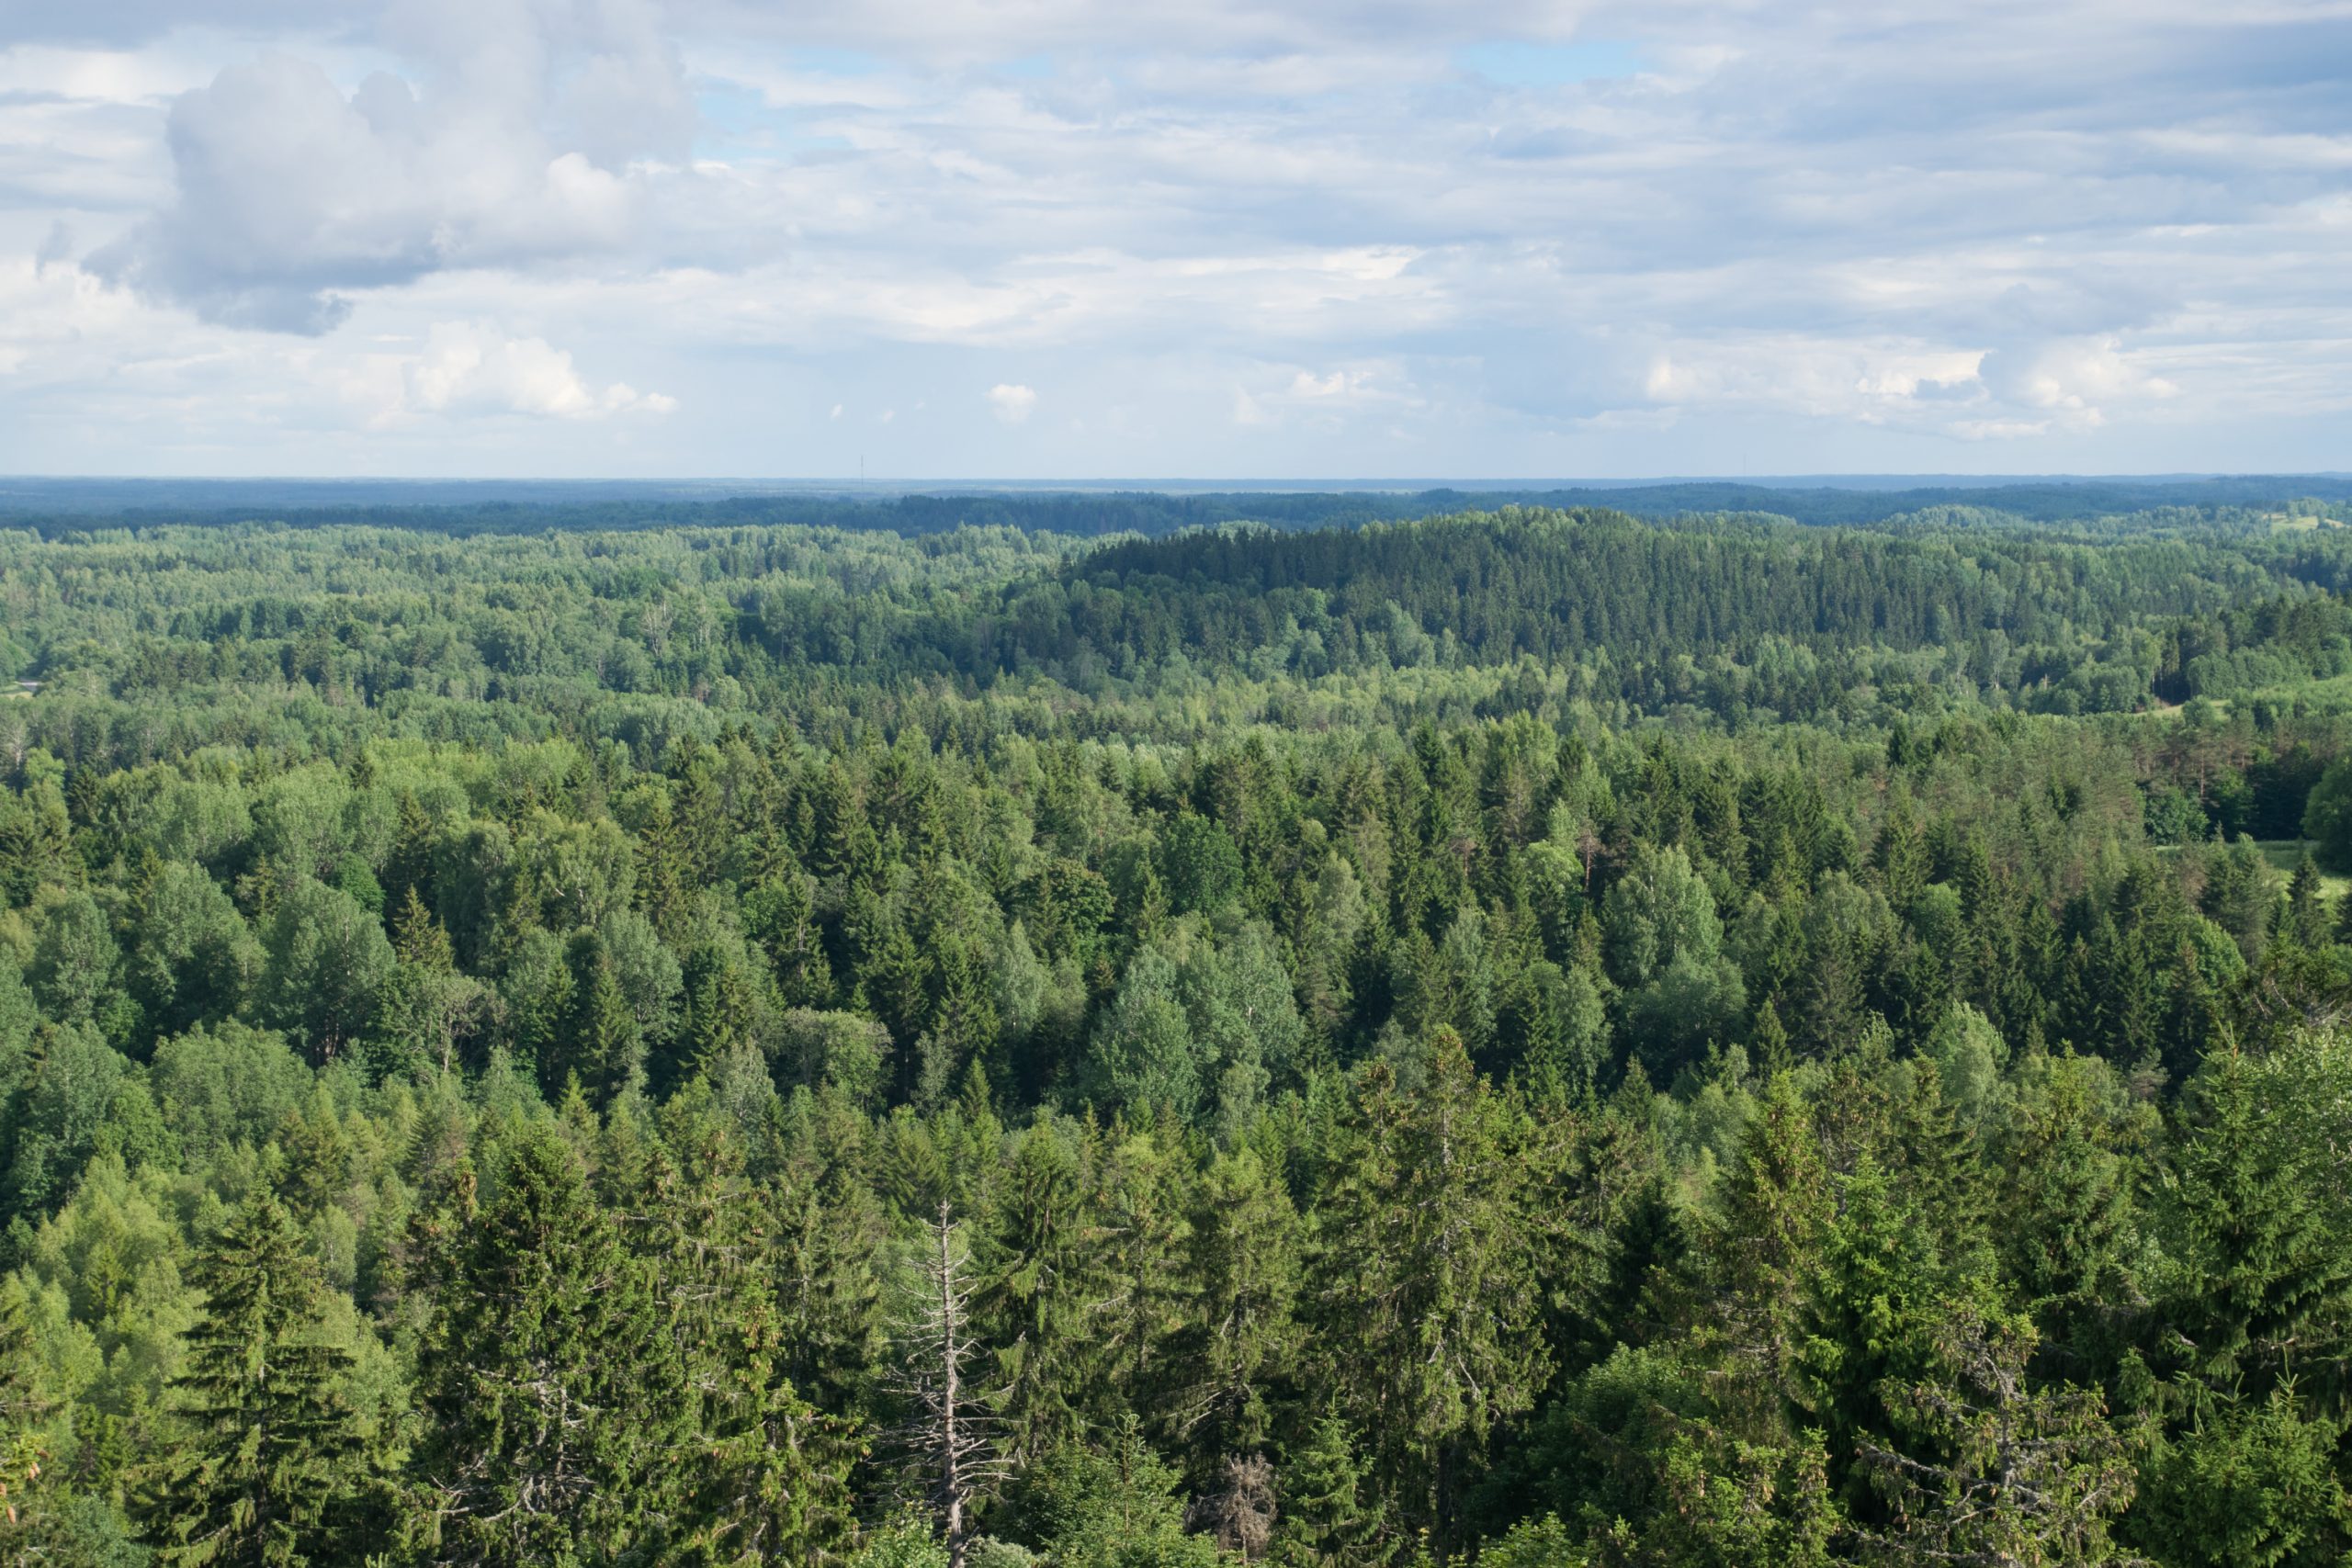
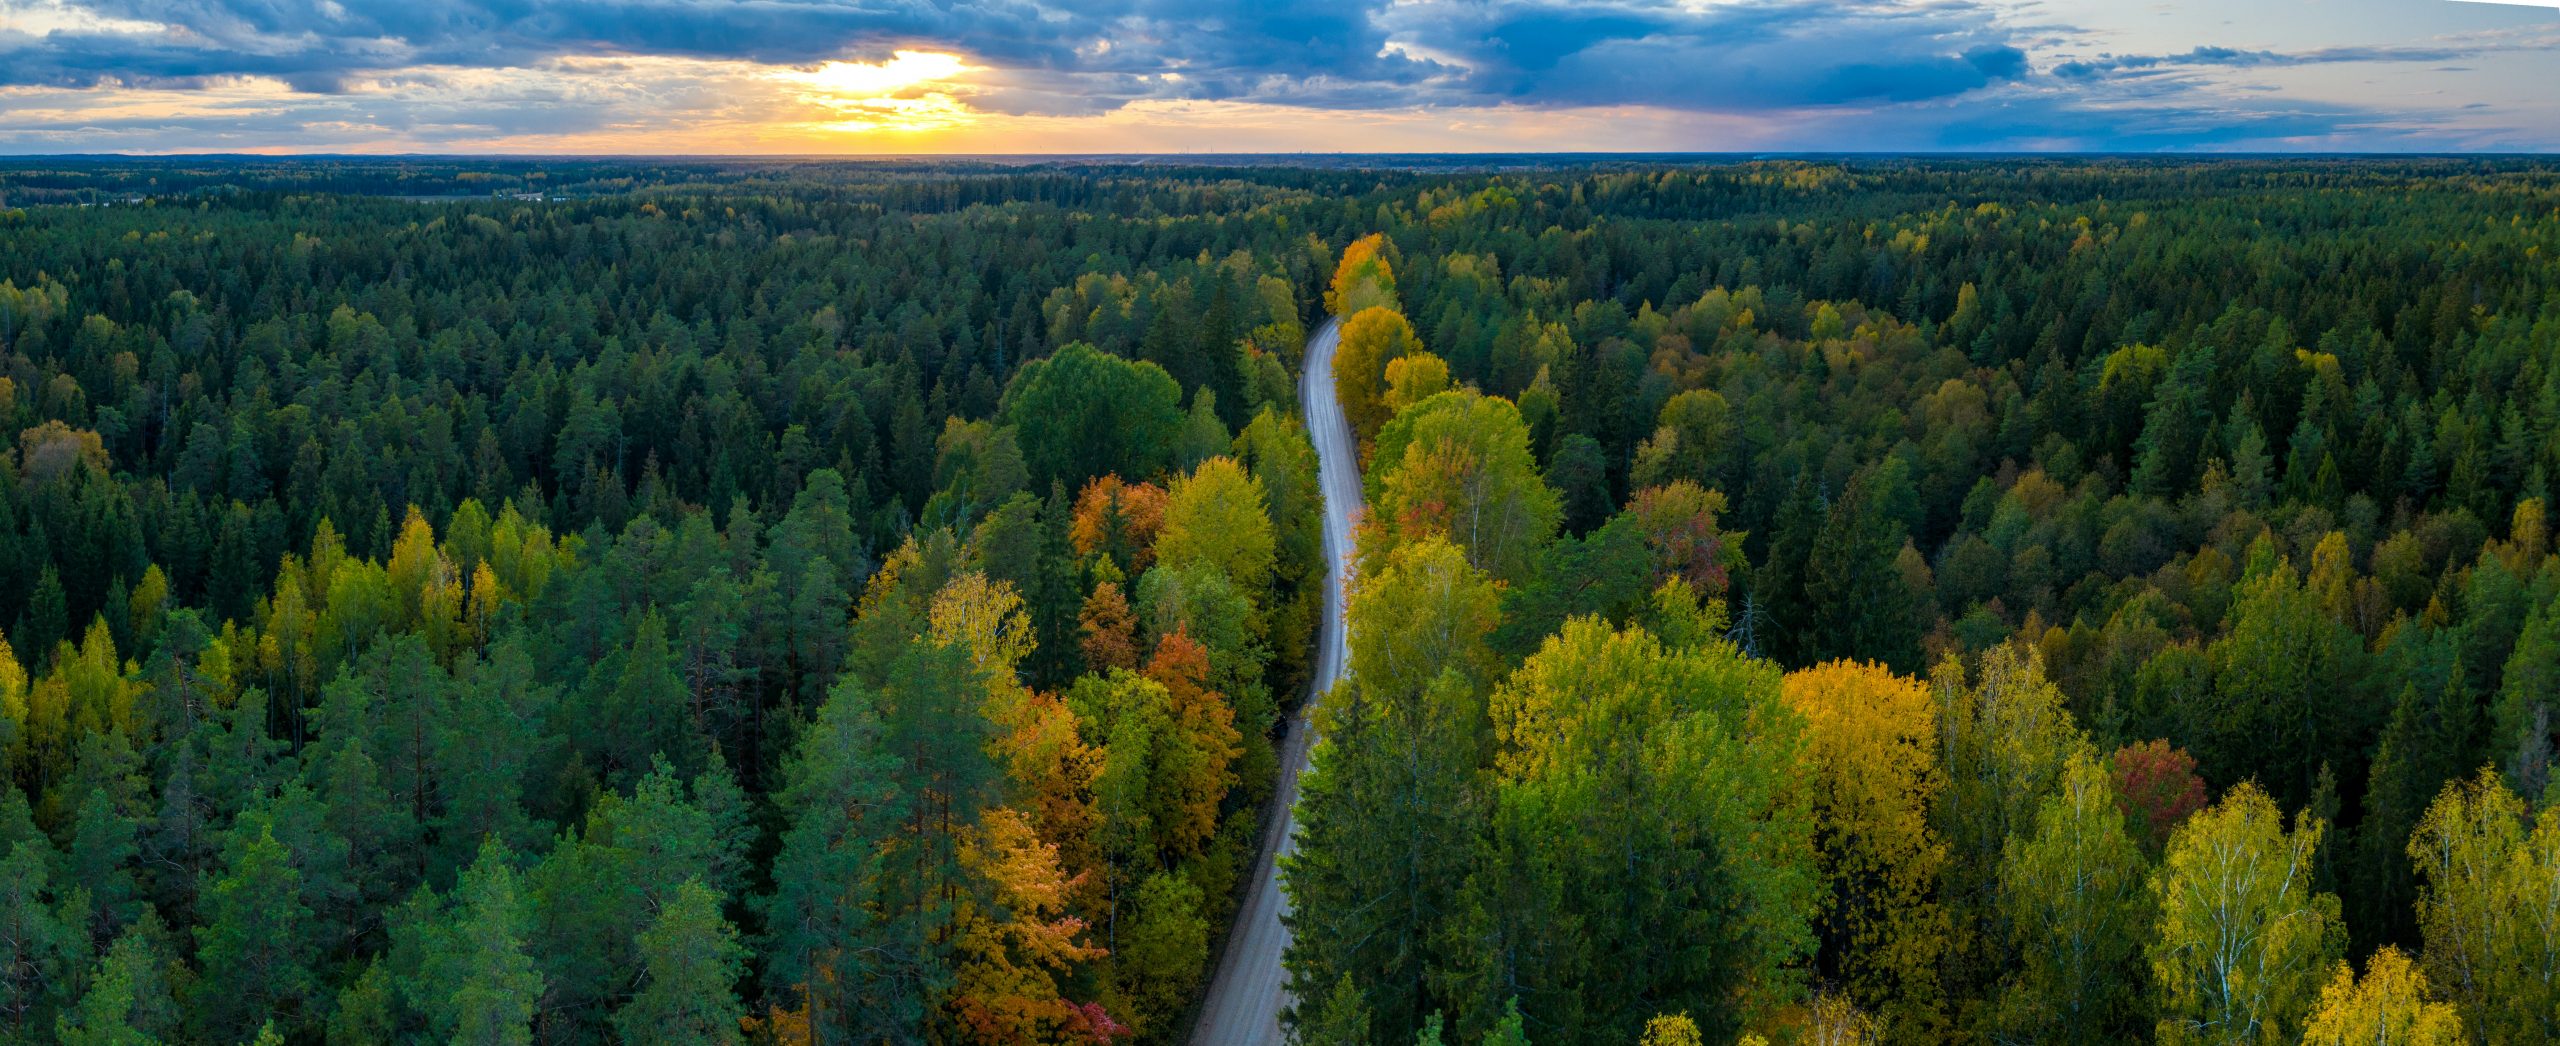
Panorama view of Latvian forest and road from above

Latvia is a heavily forested small country (about half the size of England), with 52% forest cover totalling 3.54 million ha (2.7 times bigger than the forest area in England and 11% bigger than the entire UK).

In its catchment area analysis report of the Baltic country, consultancy Indufor found:

  • Best management practice is driven by the State-owned sector with an increasing proportion of corporate owners improving management standards in the private sector
  • Markets are dominated by domestic saw-timber demand and pulpwood exports to neighbouring Scandinavia
  • Fuelwood, pellets and biomass are substantial and critical markets for low-grade fibre

Increasing forest area, carbon stored and no deforestation

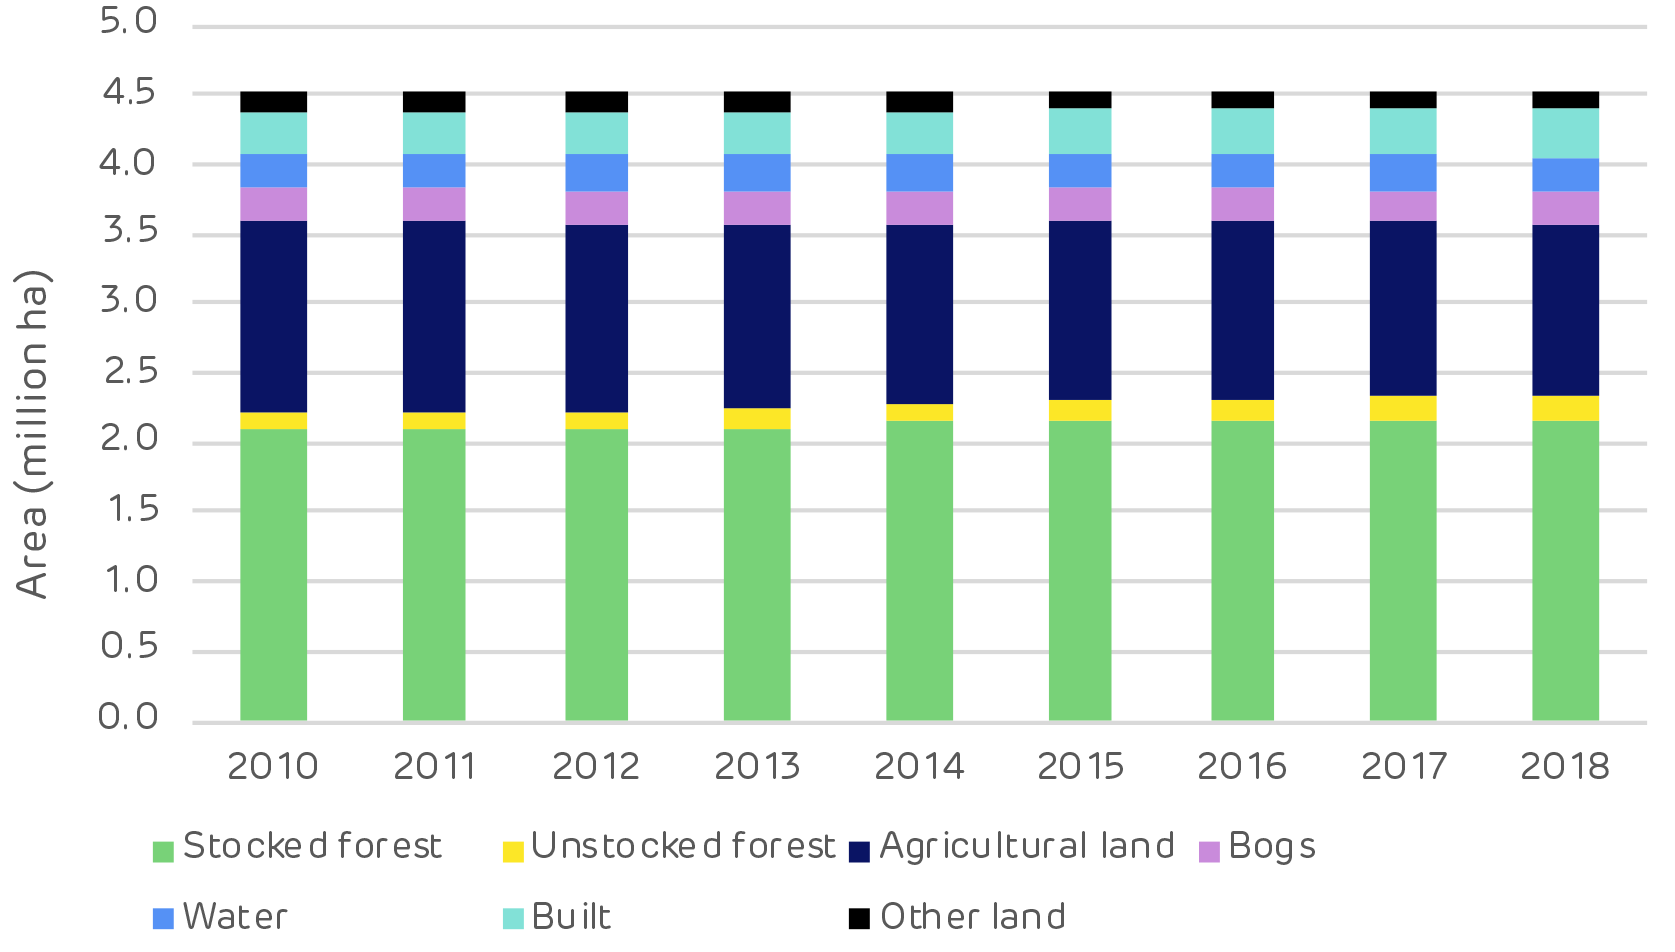
There has been an increase of around 400,000 hectares (ha) of forest in Latvia since 2000. This is due to natural afforestation of abandoned agricultural lands and also to an improvement in forest inventory analysis in 2009 which provided a more accurate assessment of land use and forestry data. Since 2010, the forest area has increased by 55,000 ha. There is no evidence of deforestation.
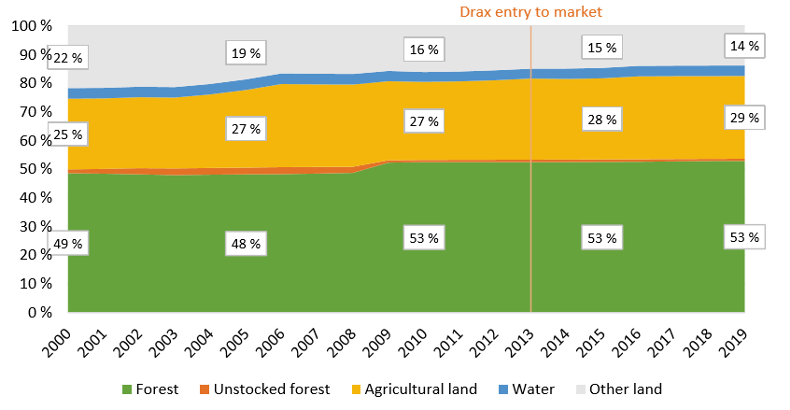
Primary land use Latvia

Primary land use Latvia

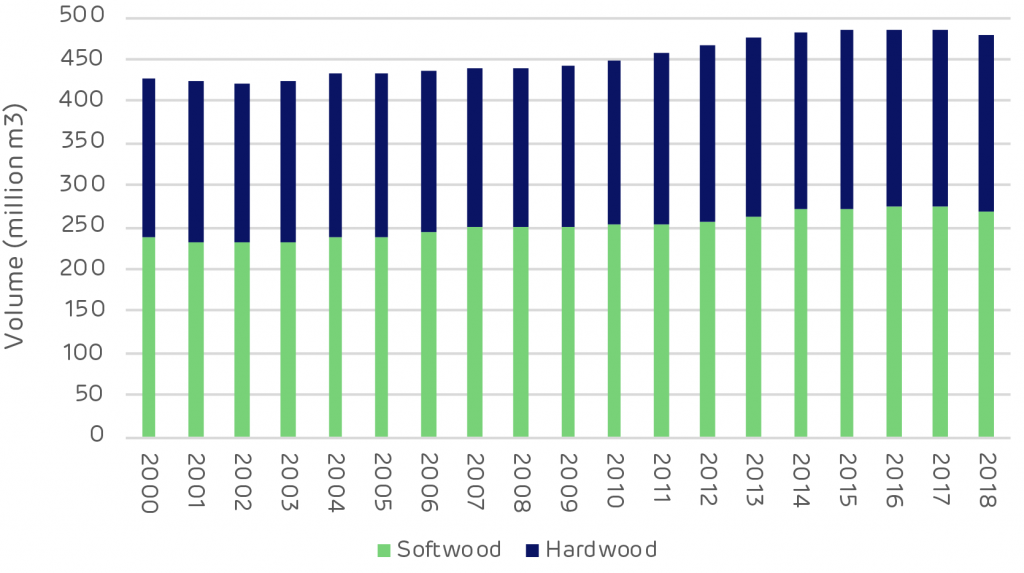
There has also been a substantial increase in forest carbon or growing stock. This increased by 106 million cubic metres (m3) since 2000 (75% hardwood) and by 33 million m3 since 2010 (57% hardwood).
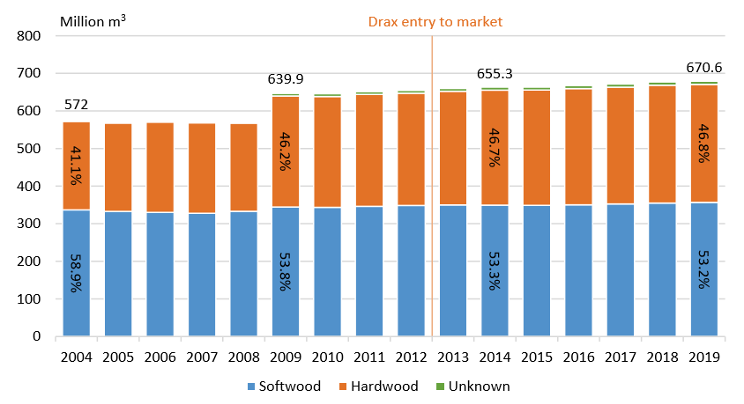
Increase in forest carbon

Increase in forest carbon

Limited hardwood markets

A proportion of the increase in hardwood volume in 2009 was due to the improvement of forest inventory calculations but also due to increased natural regeneration on unutilised land. The hardwood forest in Latvia and the Baltic region is quite different to that of the US South. In the Baltics there is prolific hardwood regeneration (birch, alder and aspen) which grows quite rapidly.

There are limited markets for structural timber, therefore hardwoods produce a lot of low-grade wood fibre. There are no domestic pulp markets in Latvia and only limited markets for panel board. Therefore, much of the low-grade wood fibre can only be used for firewood and biomass. The chart below shows a minor change in species composition from planted pine to naturally regenerated spruce and aspen – the most prolific regenerators in this region.
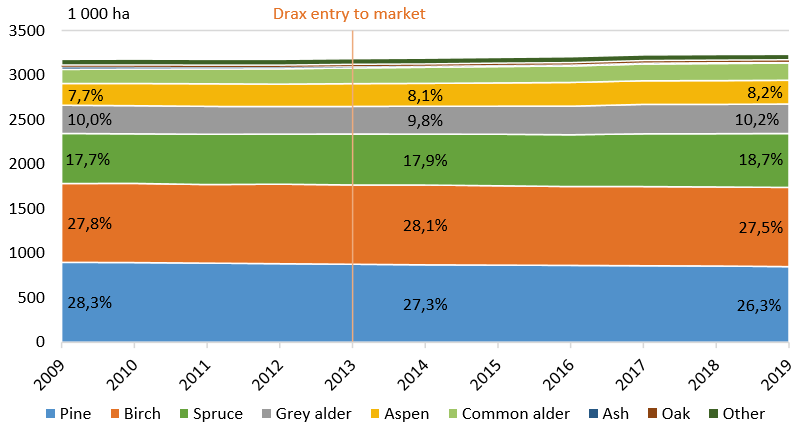
Varied species mix

Varied species mix

Planting and regeneration

State owned forests have a higher proportion of planted forest areas compared to the private sector where natural regeneration is preferred due to lower costs. Planting allows the owner to control the species mix, quality and growth. Whereas regeneration can be more of a lottery for both quality and species mix. As more corporate owners emerge, planting with improved stock may increase.
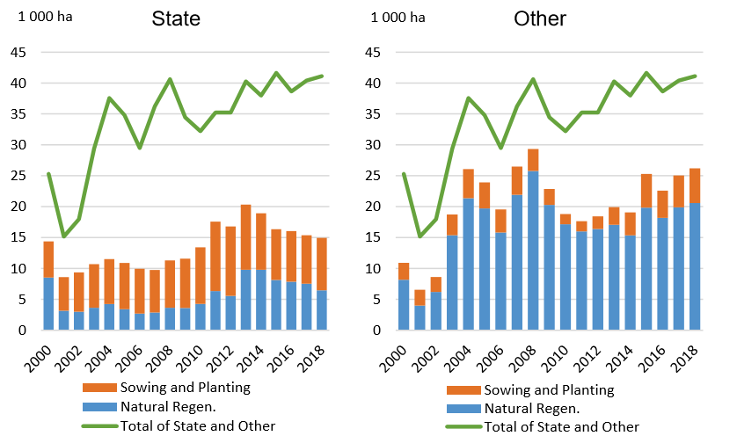
Restocking practice by ownership category

Restocking practice by ownership category

How the financial crisis impacted Latvian forests

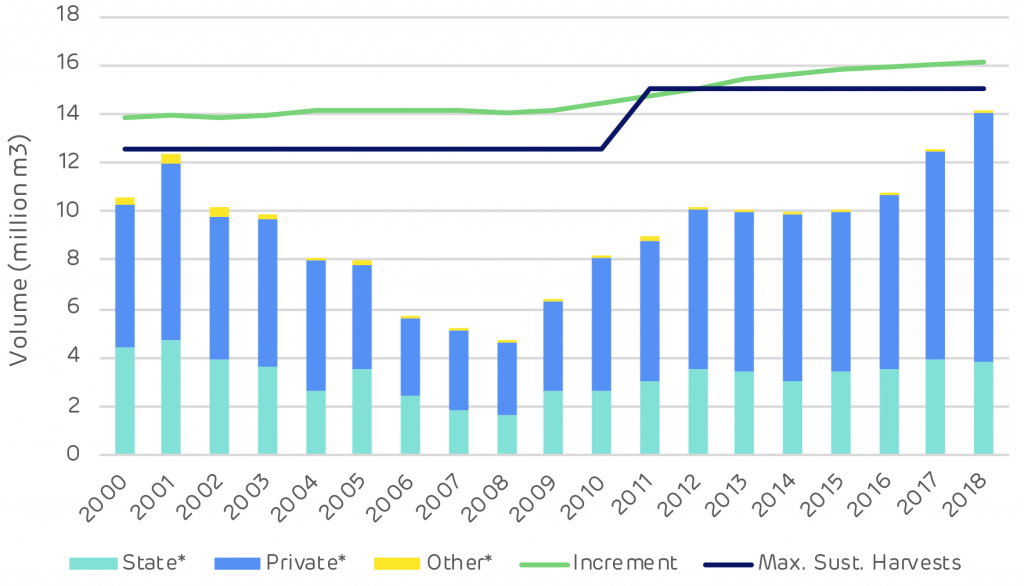
Harvesting levels have been consistently below net annual increment since 2000. There have been some fluctuations in the annual allowable cut in State forests, particularly following the global financial crisis in 2008.

Harvesting in the private sector declined due to falling prices and sawnwood production dropped by 42% in 2009 compared to 2006. During that period, State-owned forest increased harvesting in order to support the industry in the absence of strong markets and private sector supply.

Post-recession, the harvesting balance returned and demand for wood products increased. The current surplus of growth compared to removals is around 5.5 million m3 p.a. or a growth drain ratio of 1.6.
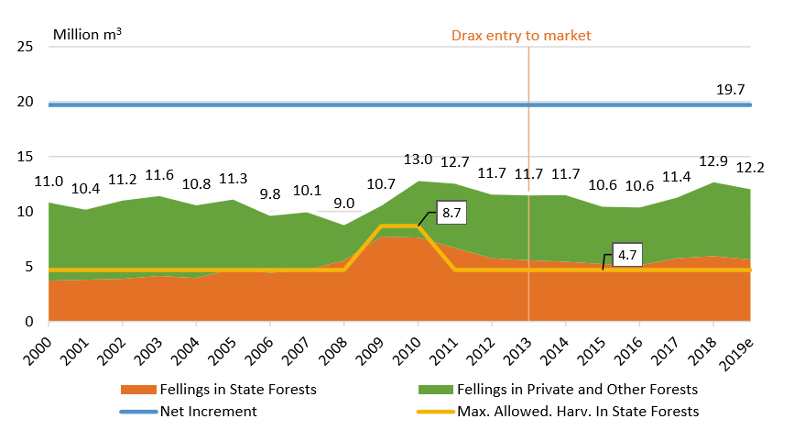
Surplus of growth compared to removals

Surplus of growth compared to removals

Biomass and pulp prices

Increasing wood pellet exports have had limited impact on wood prices. The feedstock for this market (fuelwood & forest chip) has limited competition and therefore remains fairly stable.

Pulpwood markets are driven by export demand to Scandinavia and can be volatile as this market fluctuates. 2018 saw a substantial spike in pulpwood prices due to increased export demand as a response to a global increase in pulp and paper prices boosting Scandinavian production. This had a minor knock on effect on the domestic fuelwood markets.
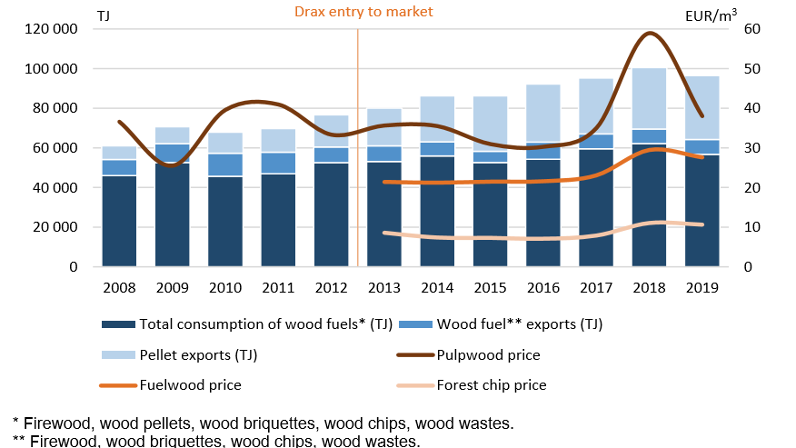
Variation of low-grade wood prices with changing demand

Variation of low-grade wood prices with changing demand

An important part of this analysis is to look for evidence to evaluate Drax’s performance against its new forest commitments, some of which relate directly to these trends and data sets.

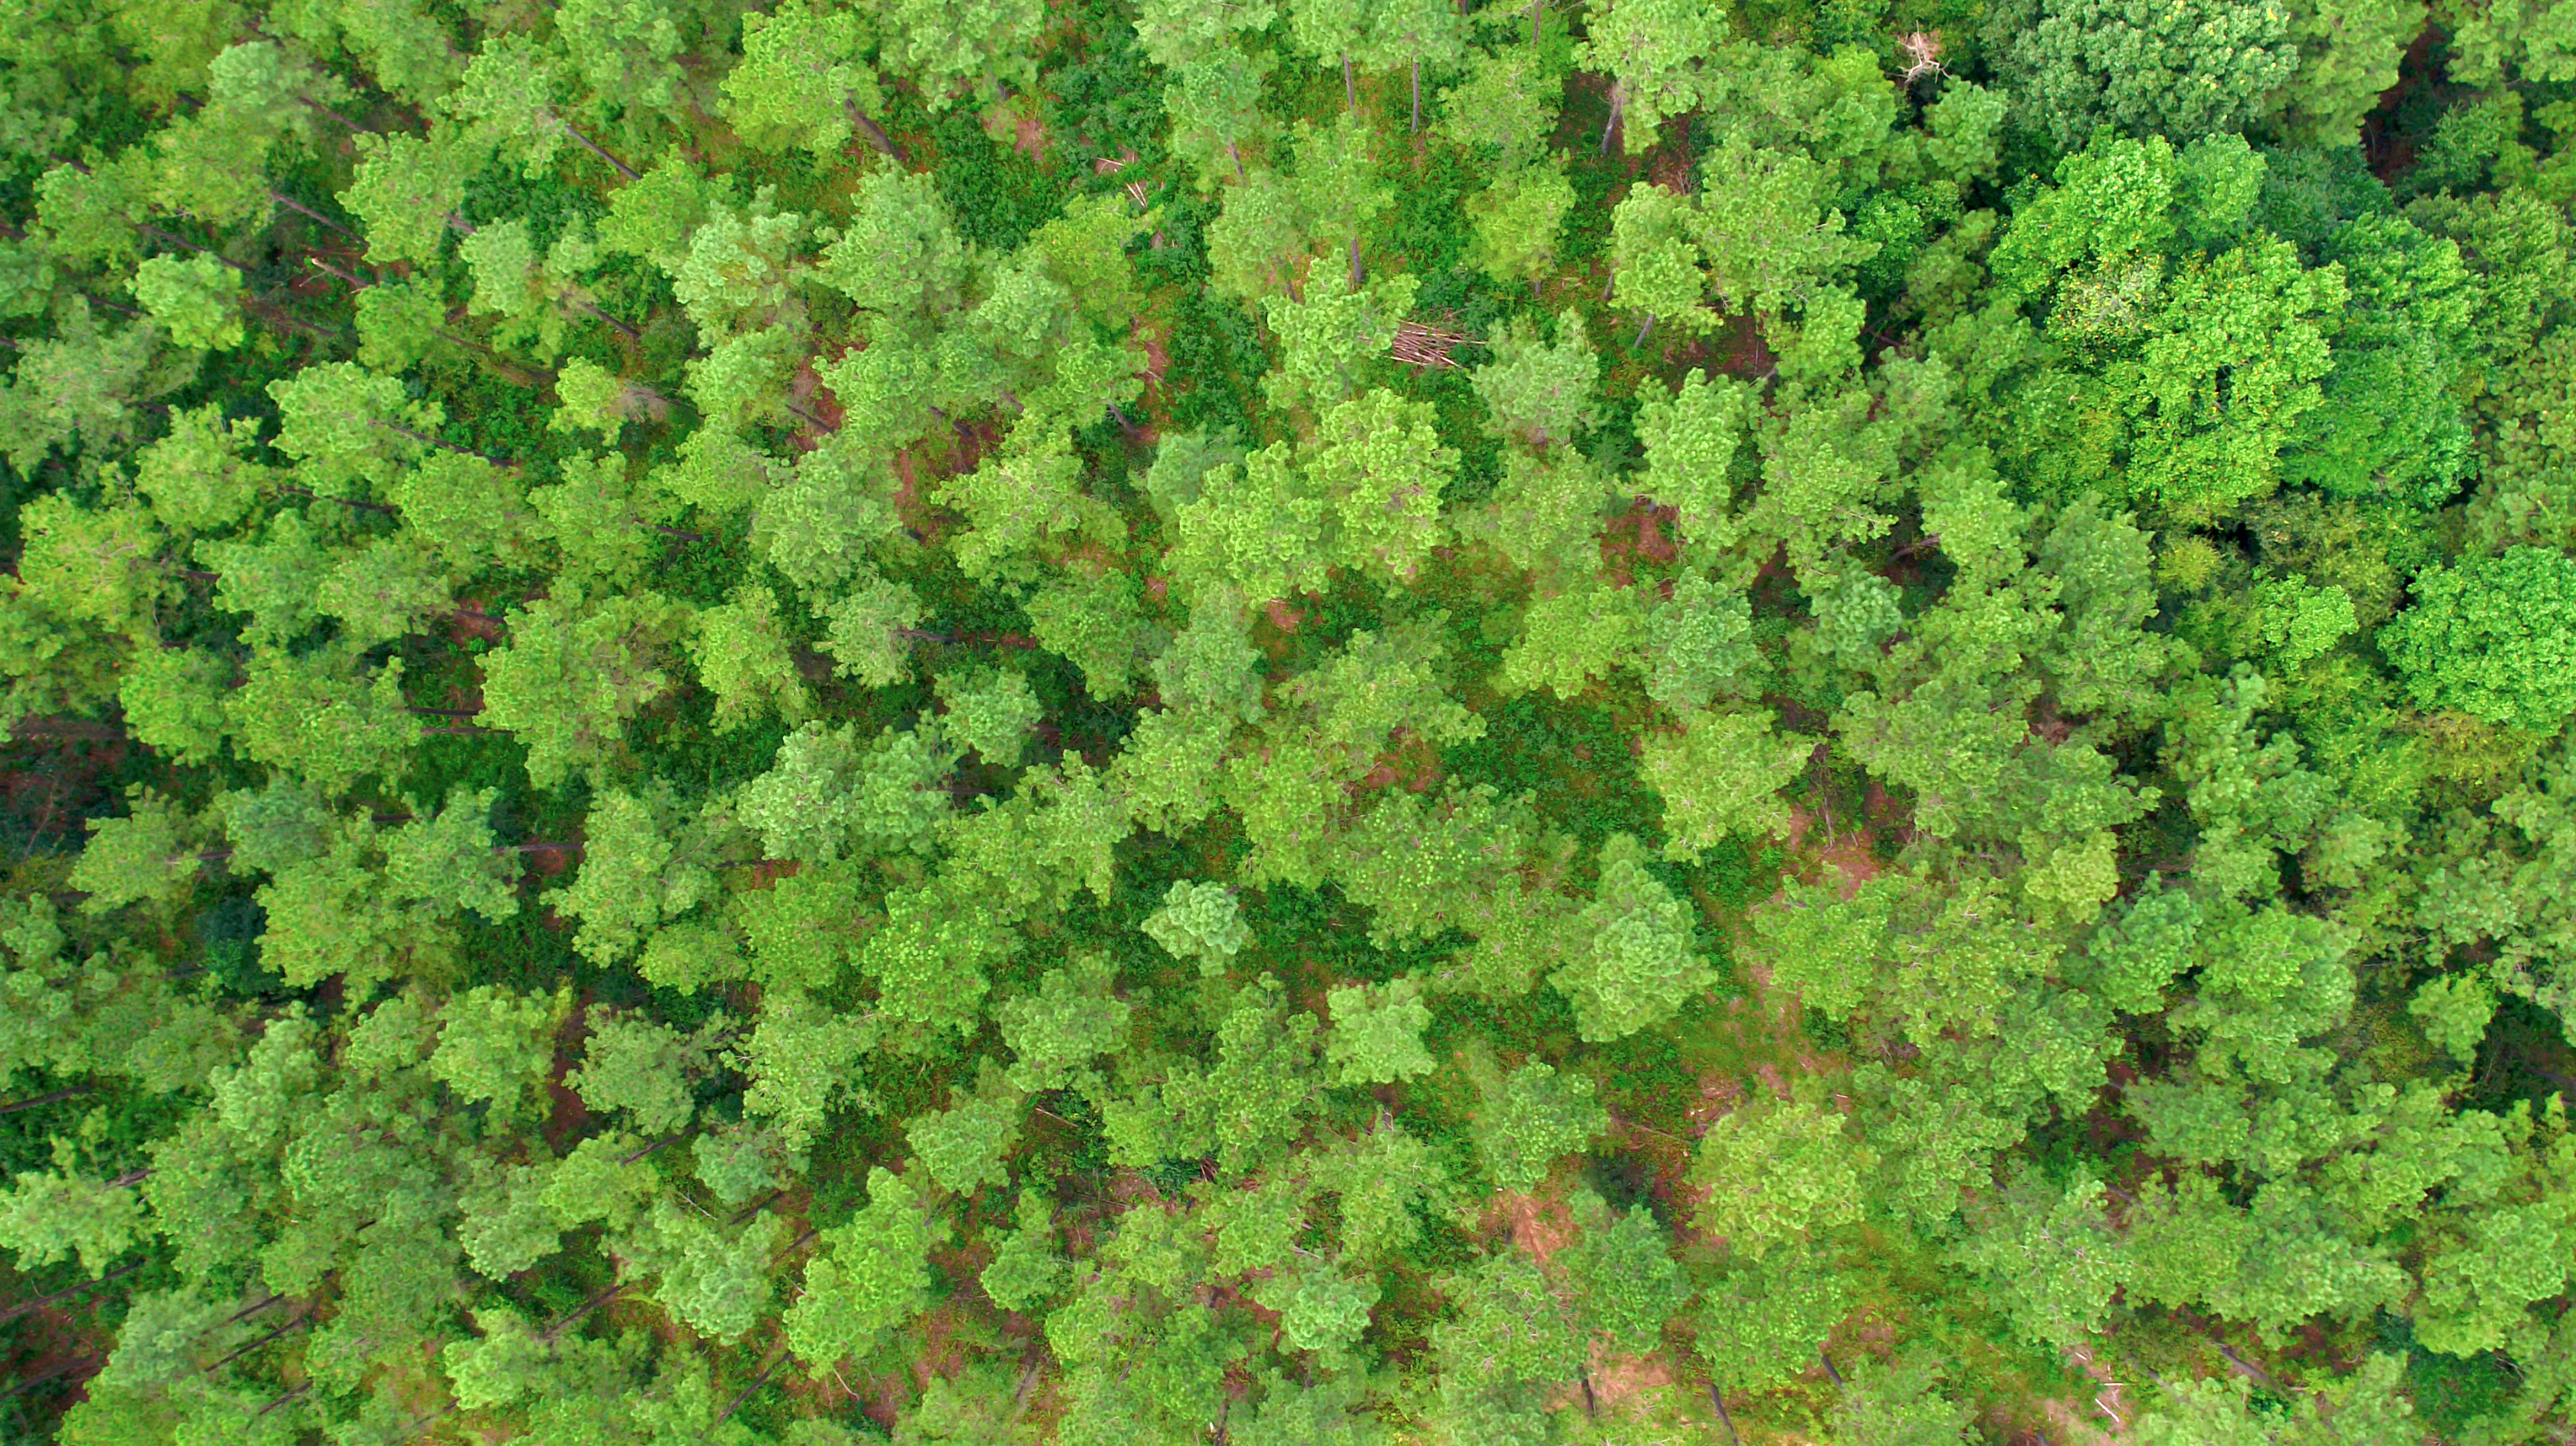
Pine forest in Latvia

Pine forest in Latvia

Below, the consultant summarises the evidence of biomass impacts against key metrics in the forest industry of Latvia.

Is there any evidence that wood-based bioenergy demand has caused changes in …

Forest area / forest cover

No impact. Both forest area and forest cover have increased during the last two decades. The main driver of the growing forest area has been the natural regeneration of agricultural lands that were left uncultivated during the Soviet regime.

Forest growing stock

No impact. Forest growing stock has steadily increased throughout the observation period.

The main driver for harvesting level is the roundwood demand from sawmills, panel mills and export. Wood-based bioenergy demand may increase thinnings and residue collection, but it is not as significant a driver for total harvests as the aforementioned. Exported pellets have accounted for approximately 10-14% of the total volume of annual harvests in recent years, depending on the assumed average dry densities of the harvested wood and pellets.

Harvesting levels

No impact / slight increasing impact. The national felling volume is only about 65% of the national forest increment. The total harvesting area has been declining, while the total harvested volume has increased in the past 20 years. This can be explained by the diminished share of thinnings and increased share of clear-cuts. A decline in both area and volume of fellings can be seen between 2002–2008 and 2010–2016.

The main drivers of harvesting levels are sawmill industry, panel industry and export demand. However, wood demand for energy purposes can still improve the overall income for the forest owner and therefore increase the total harvesting levels in private forests

Harvesting residue collection

Increasing impact. Most of the collected residues originate from clear-cuts in state forests. Most produced harvesting residues are left in situ, and they are not over-exploited.

Collection of wood residues from harvesting operations has been increasing for the last 15 years as a result of increased capacities and demand from heat and CHP plants. Latvia is increasingly relying on woody biomass for energy generation.

Forest growth / carbon sequestration potential

No apparent impact. The total forest area and growing stock have grown in the last decade.

According to Latvia’s National Forestry Accounting Plan 2021–2025, the forests are decreasing their GHG sequestration capacity. Even a low sequestration rate increases carbon storage, which explains the increases in forest growing stock and area. The decrease in GHG sequestration capacity is due to forest ageing, emissions from soils and the increased share of broadleaved forests, which have lower carbon accumulation capacity than conifers.

Removal of harvesting residues decreases carbon sequestration since the residues are an input to the soil carbon pool. However, the majority of the harvesting residues’ carbon is released to the atmosphere when the biomass decays, so the ultimate impact of harvesting residue collection is minimal if the collection is done on a sustainable level. The sustainability of the collection is determined by how the soil nutrient balance is impacted by collection. This is not accounting for the substitution effect that the harvesting residues may have, by, e.g. reducing the need to burn fossil fuels.
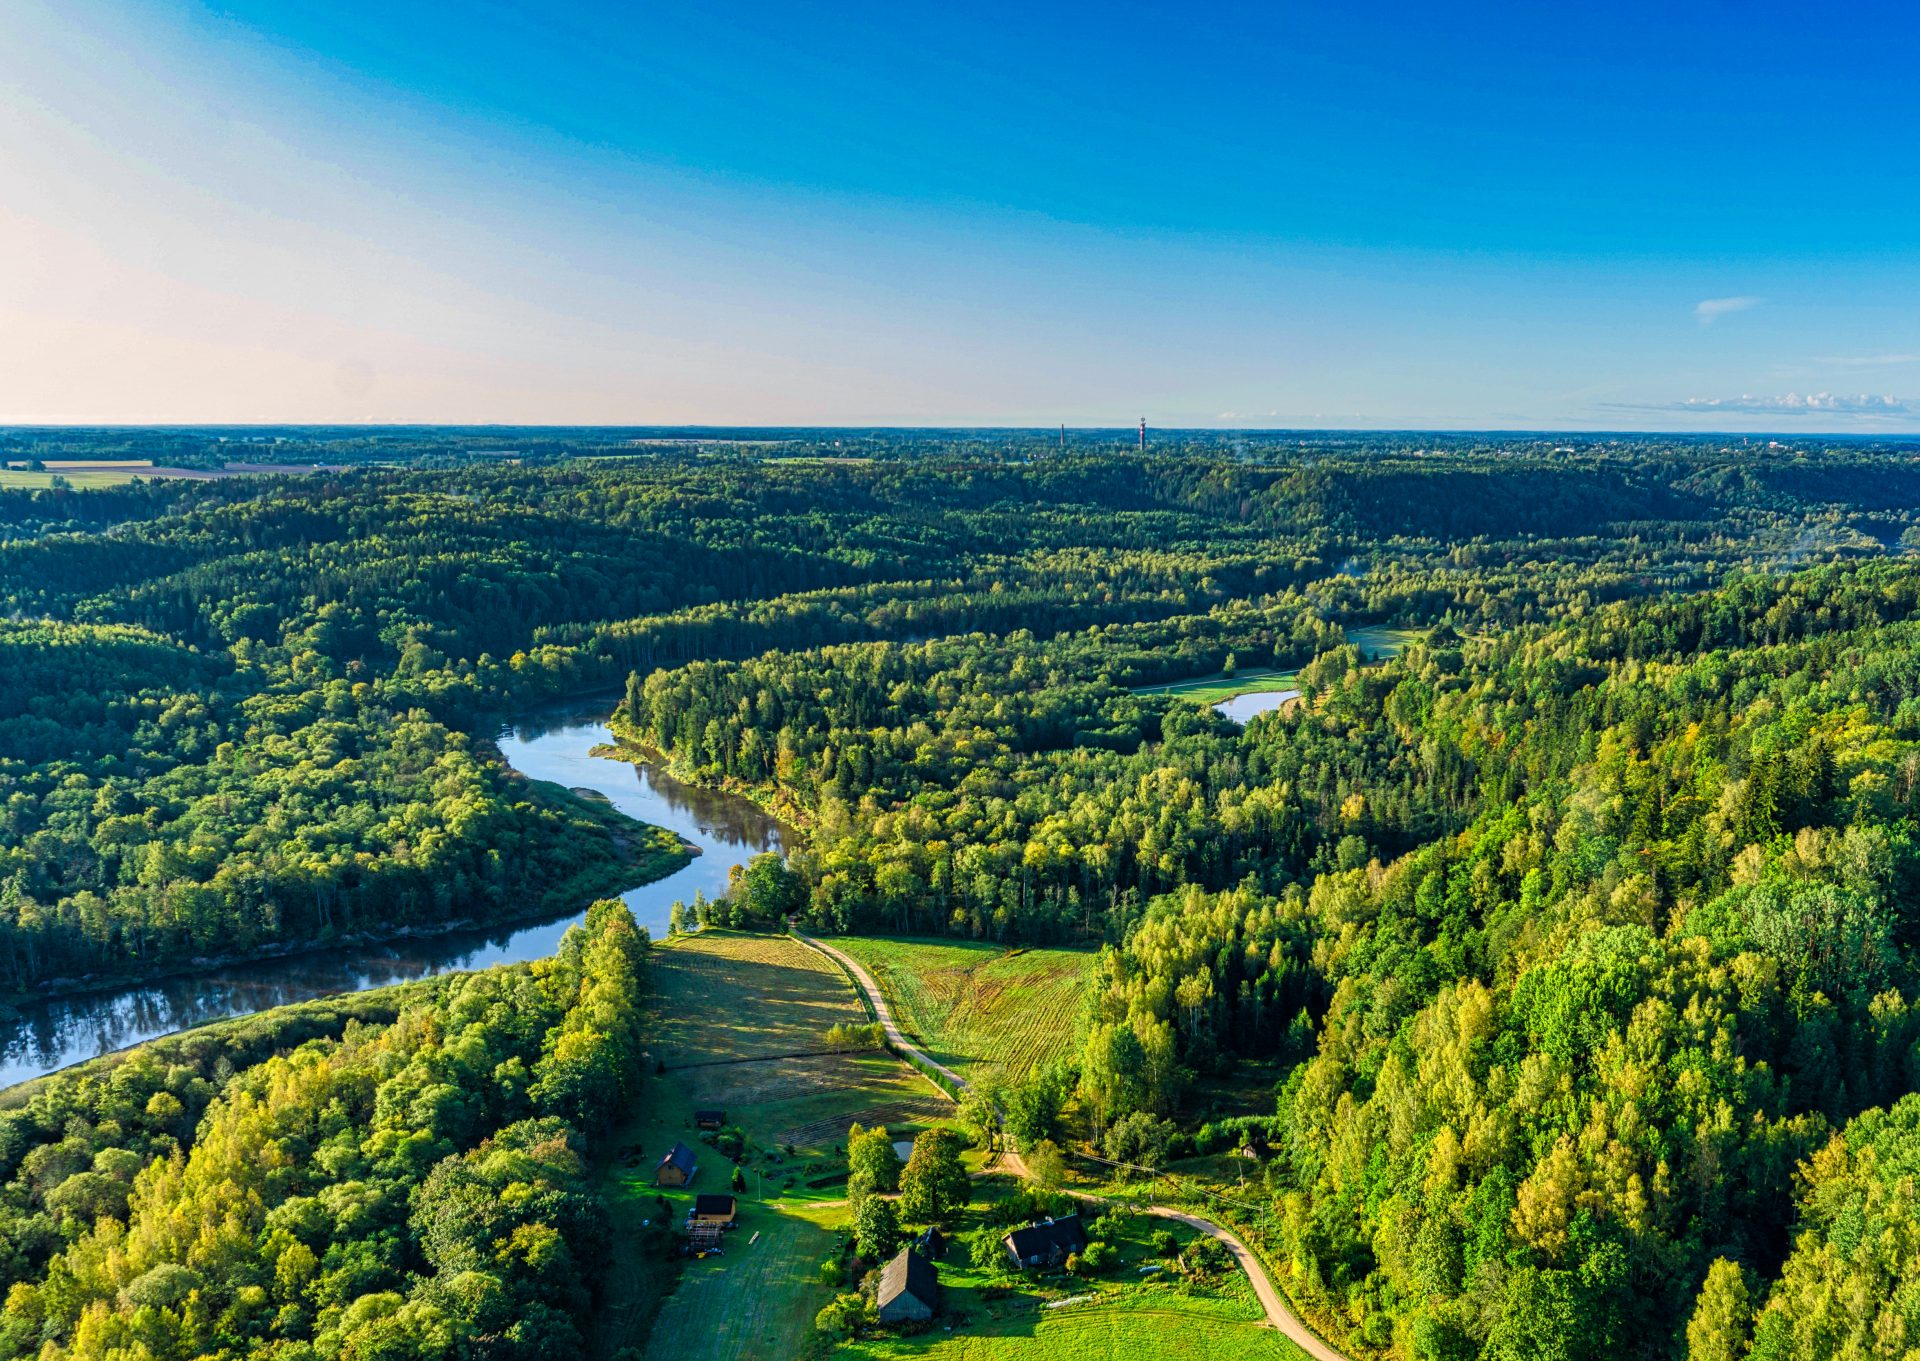
Aerial sight of warm, colorful autumn morning sunrise at forest covered picturesque river valley. Clear blue sky and high contrast shadows with magnificent reflections, breathtaking

Is there any evidence that wood-based bioenergy demand has caused changes to forest management practices …

Rotation lengths

No impact. The Law on Forests regulates minimum forest age and diameter for clear-cuts. The LVM and large-scale forest owners often conduct clear-cuts at minimum diameter, whereas smallholders tend to wait until roundwood prices are high. Due to the regulation, an increase of wood-based bioenergy demand has not shortened rotations.

Thinnings

Increasing impact in naturally afforested former agricultural lands. No impacts on thinnings overall. The total harvested area has been declining, while the total harvested volume has increased in the past 20 years. This can be explained by the diminished share of thinnings, due to existing forest age structure, and increased share of clear-cuts. Most of the harvesting residues are collected from clear-cuts.

There is an increased demand for small diameter wood and harvesting/processing residues overall.

The increased demand for small-diameter hardwood has increased harvesting in previously unmanaged afforested agricultural lands, which usually overgrow with broadleaved trees. These kinds of lands are usually otherwise not significant for forest management.

Conversion from hardwood to softwood

No impact. No indication of hardwood conversion to softwood was found. Instead, pine forests are decreasing due to the favouring of natural regeneration, which usually results in spruce or broadleaved forests in nutrient-rich and/or wet soils.

Is there any evidence that wood-based bioenergy demand has impacted solid wood products markets …

Diversion from other wood product markets

No apparent impact. Production of sawnwood and wood-based panels have increased or remained steady, i.e. no evidence of diversion.

Several interviews confirmed that sawlogs are not processed for other products besides sawnwood and wood-based panels.

Wood prices

No apparent impact. Prices of all wood assortments increased in 2017–2018, most notably the prices of pulpwood. This was due to difficult harvesting conditions and increased demand for pulpwood in Finland and Sweden, because of high market pulp prices. Pulpwood prices returned to pre-surge levels in 2019. Fuelwood prices also increased temporarily, but at a much more moderate rate. The main driver for fuelwood price increases was the surge of pulpwood prices.

Read the full report Catchment Area Analysis in Latvia. A 2017 interview with Raul Kirjanen, CEO of Graanul Invest, a wood pellet supplier of Drax operating in Latvia, can be read here. Read how Drax and Graanul work with NGOs when concerns are raised within our supply chain here.

This is part of a series of catchment area analyses around the forest biomass pellet plants supplying Drax Power Station with renewable fuel. Others in the series include: Georgia Mill, ChesapeakeEstoniaMorehouse Bioenergy and Amite Bioenergy.

Changing forest structure in Virginia and North Carolina

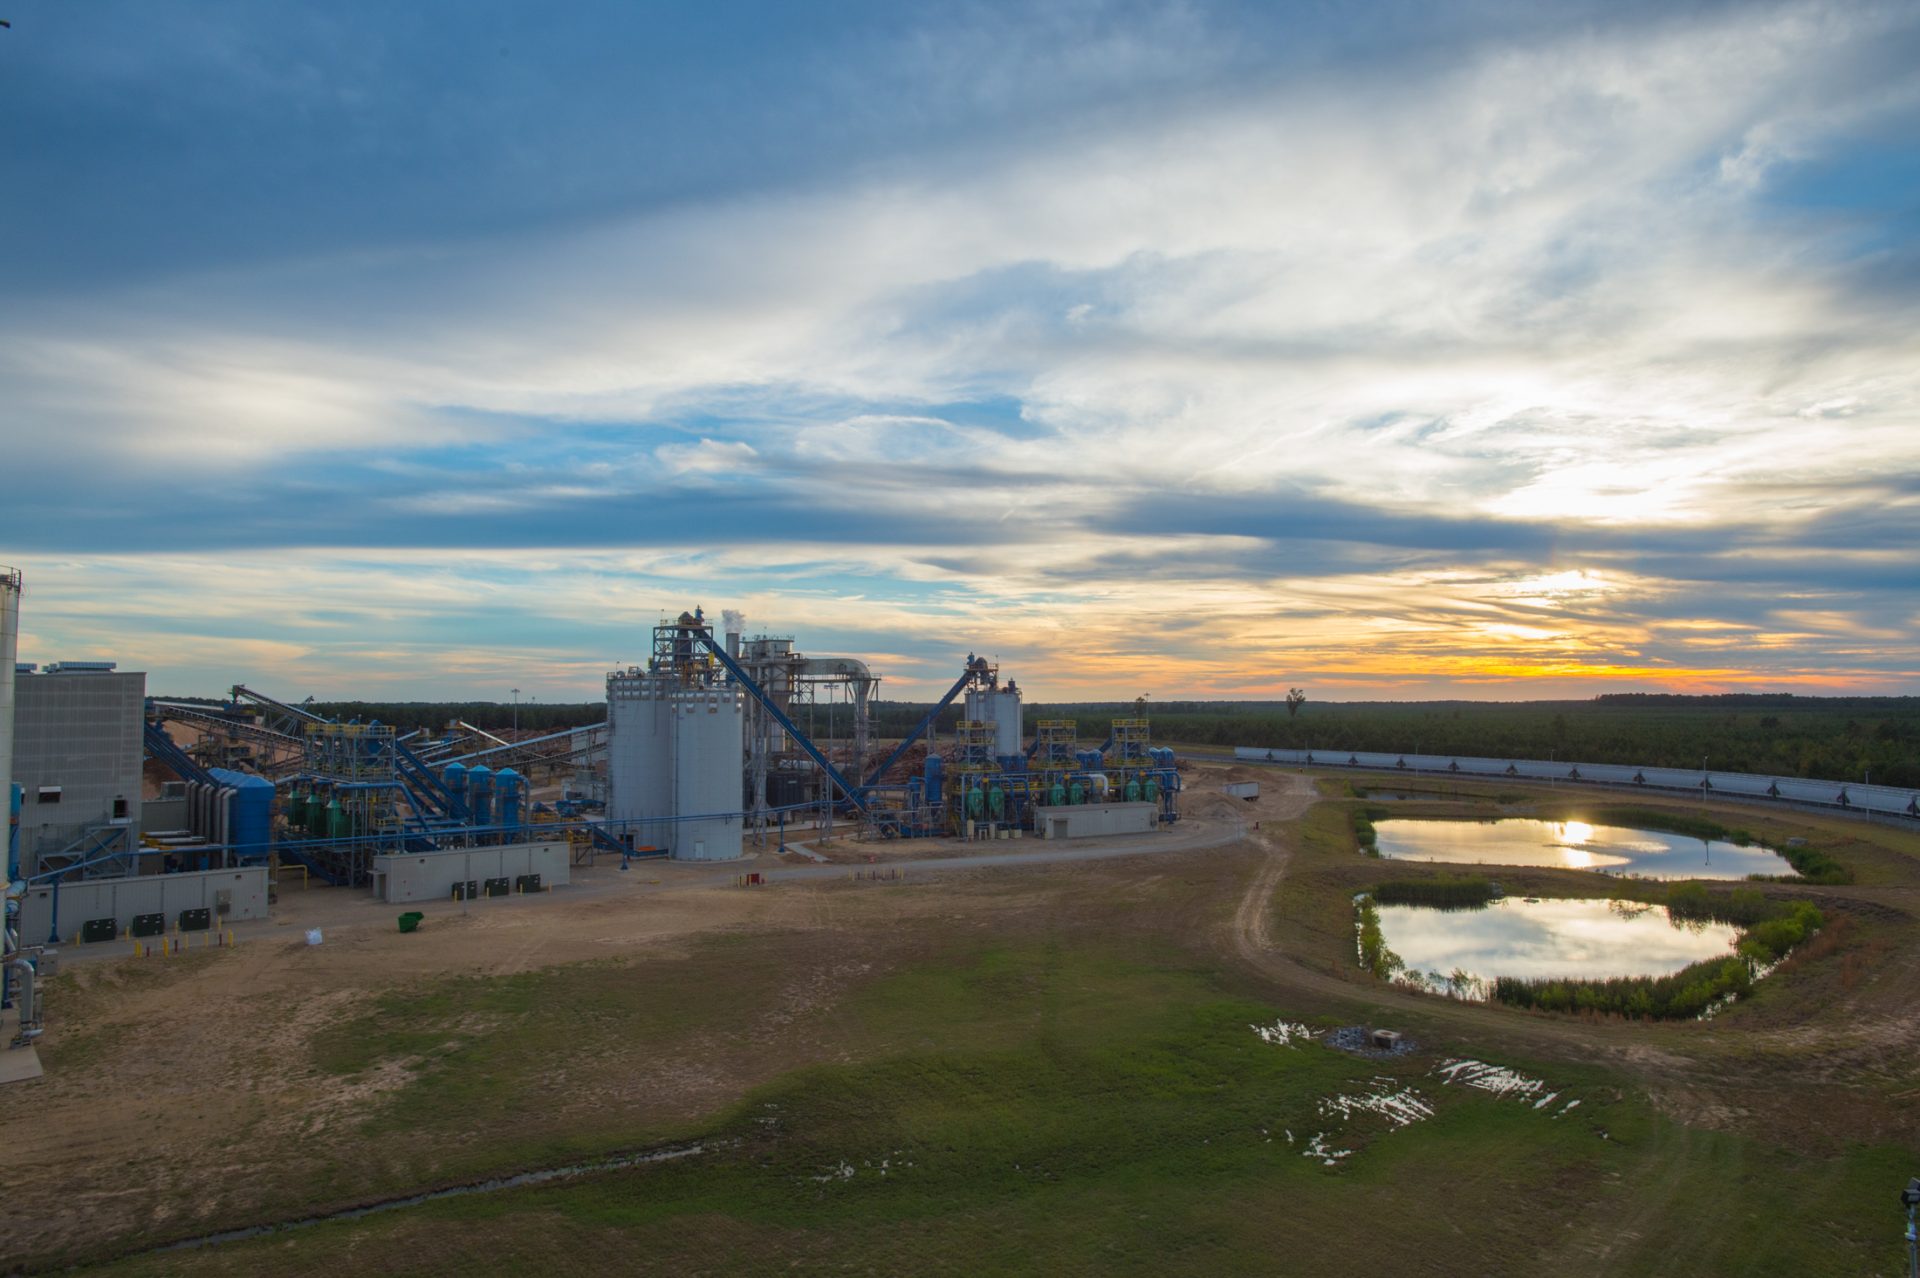
Photos: Roanoke Rapids area near the North Carolina, Virginia border, courtesy of Enviva.

Forest owners have responded to the recovery in pine saw-timber markets, since the global financial crisis of 2008, by planting more forest and investing more in the management of their land. The same period has witnessed increased demand from the biomass sector which has replaced declining need for wood from pulp and paper markets.

The area of timberland (actively managed productive forest) has increase by around 89,000 hectares (ha) since 2010. This change is due to three important factors: new planting on agricultural land; the planting of low-grade self-seeded areas with more productive improved pine; and the re-classification by the US Forest Service (USFS) of some areas of naturally regenerated pine from woodland to timberland.

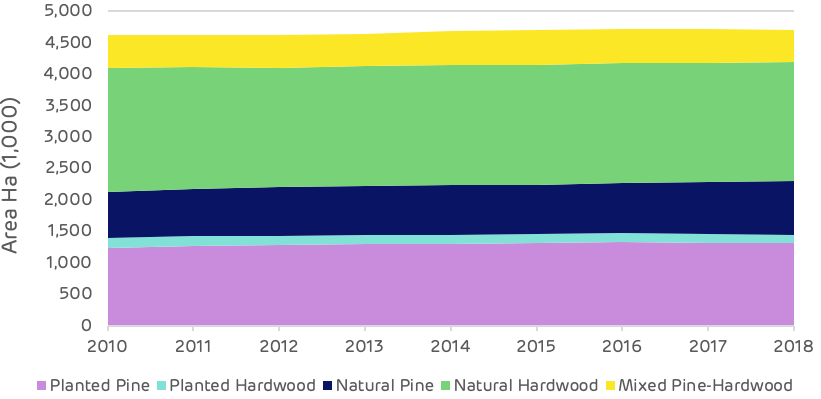
The 2018 data shows that pine forest makes up 46% of the timberland area, of which 61% is planted and the remainder naturally regenerated. Hardwoods cover 43% of the timberland area, with 93% of this naturally regenerated. The remaining area is mixed stands.

Composition of timberland area

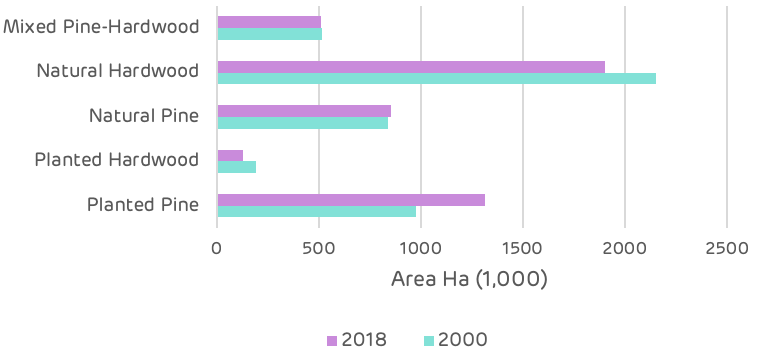
Since 2000 there have been some significant changes in the composition of the timberland area with a transition from hardwood to softwood. Pine has increased from 39% of the total area in 2000 to 46% in 2018 and hardwood has decreased from 50% to 43% over the same period.

All pine areas have increased since 2000 with naturally regenerated pine increasing by 13,000 ha and planted pine by 340,000 ha since 2000. Mixed stands have declined by 6,500 ha as some of these sites have been replanted with improved pine to increase growth and saw-timber production.

The biggest change has been in the hardwood areas where there has been a decline of around 314,000 ha, despite the total area of timberland increasing by 31,000 ha.

Change in forest type

This change has been driven by private forest owners (representing 91% of the total timberland area), seeking to gain a better return on investment from their forest land.

Hardwood markets have declined since the 2008 recession and demand for hardwood saw-timber has not recovered. Demand for pine saw-timber has rebounded and is now as strong as pre-crisis.

Pine also offers much faster growth rates and higher total volumes in a much shorter time frame (typically 25-35 years compared to 75-80 years for hardwoods).

The decision to change species is similar to a farmer changing their agricultural crops based on market demand and prices for each product. Where forests are managed for revenue generation then it is reasonable to optimise the land and crop for this objective. This can be a significant positive, from a carbon perspective more carbon is sequestered in a shorter time frame and more carbon is stored in long term wood products, if the quantity if saw-timber is increased.

Increased revenue generation also helps to maintain the forest area (rather than conversion to urban development, agriculture or other uses).

A potential negative is the change in habitat from a pure hardwood stand to a pure pine stand, each providing a different ecosystem and supporting a different range of flora and fauna. There is no conclusive evidence that one forest type is better or worse than the other; there is a great deal of variety of each type.

Some hardwood forests are rich in species and biodiversity, others can be unremarkable. The key is not to endanger or risk losing any species or sensitive habitat and to ensure that any conversion only occurs where there is no loss of biodiversity and no negative impact to the ecosystem.

It is not clear whether all of the lost hardwood stands have been directly converted to pine forests, some hardwood stands may have been lost to other land uses (urban and other land has increased by 400,000 ha). Some may have been directly converted to pine by forest owners encouraged by the increase in pine saw-timber demand and prices.

Whatever the primary driver of this change it is clearly not being driven by the biomass sector.

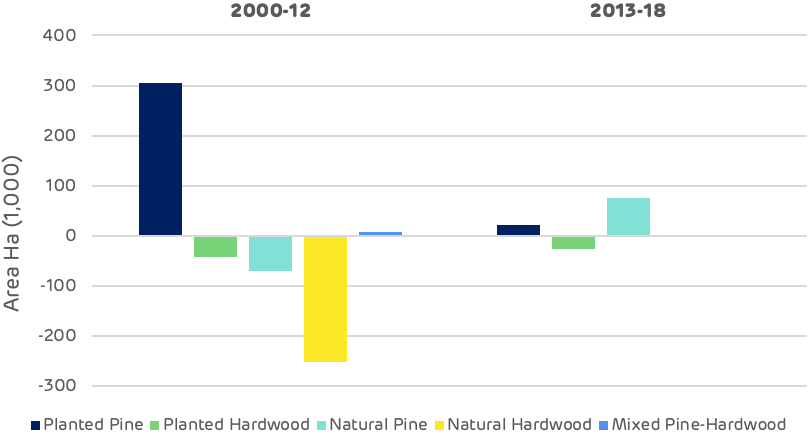
Change in forest type – timing

The chart above demonstrates that the biggest change, loss of hardwood and increase in planted pine, occurred between 2000 and 2012, prior to the operation of the pellet mills. Since 2012, there has been no significant loss of natural hardwood and only a small decline in planted hardwood.

Read the full report: Catchment Area Analysis of Forest Management and Market Trends: Enviva Pellets Ahoskie, Enviva Pellets Northampton, Enviva Pellets Southampton (UK metric version). Explore Enviva’s supply chain via Track & Trace. This is part of a series of catchment area analyses around the forest biomass pellet plants supplying Drax Power Station with renewable fuel. The series includes: Estonia, Morehouse Bioenergy, Amite Bioenergy, and the Drax forestry team’s review of the Chesapeake report on Enviva’s area of operations.

Estonia catchment area analysis

View from Suur Munamagi over forest landscape in South Estonia.

Estonia is a heavily forested country with a mature forest resource that has been neglected over many years due to political and ownership changes. Management of state and corporate owned forests is now good, but some small privately-owned areas of forest are still poorly managed.

Despite this, both the forest area and the growing stock have been increasing, largely due to new planting and the maturing age class of existing forest.

Forest area has increased from 49% to 52% of the total land, increasing by more than 118 thousand hectares since 2010.

Land use in Estonia

Land use in Estonia [click to view/download]

Over the same period the growing stock increased by 52 million m3, with 60% of this growth in softwood and 40% in hardwood species. The data shows a slight decline in 2018 but this is due to a sampling error and the growing stock is thought to have been maintained at 2017 levels (this should be rectified in the 2019 data when available).

Change in forest growing stock – Estonia

Change in forest growing stock – Estonia [click to view/download]

The forests of Estonia have been going through a period of restitution since the 1990s. Land that had been taken into state ownership during Soviet rule has been given back to private owners. This process was complex and lengthy and limited active management in the forest during this time.

Since 2008, harvesting and management has increased. Private and corporate forest owners have been harvesting forest that had been mature and ready for clear felling. The longer-term harvesting trend has been considerably lower than annual growth (increment) and the maximum sustainable harvesting level, as shown on the chart below.

Annual increment and harvesting levels

Annual increment and harvesting levels [click to view/download]

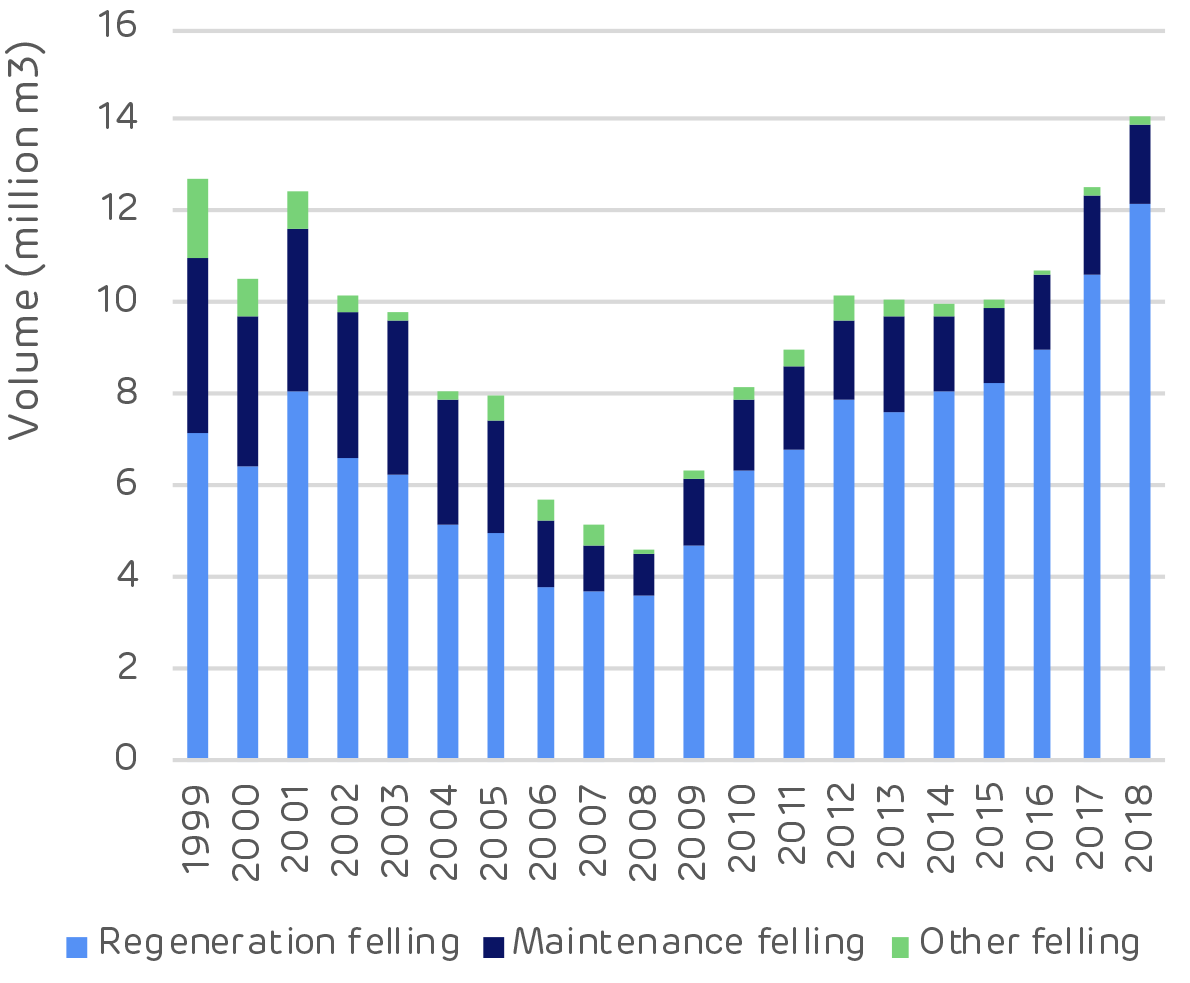
In 2018 harvesting reached an all time high at just over 14 million m3 and just under the maximum threshold. It is expected to remain at this level as more forest matures and enters the cycle of harvest and regeneration.

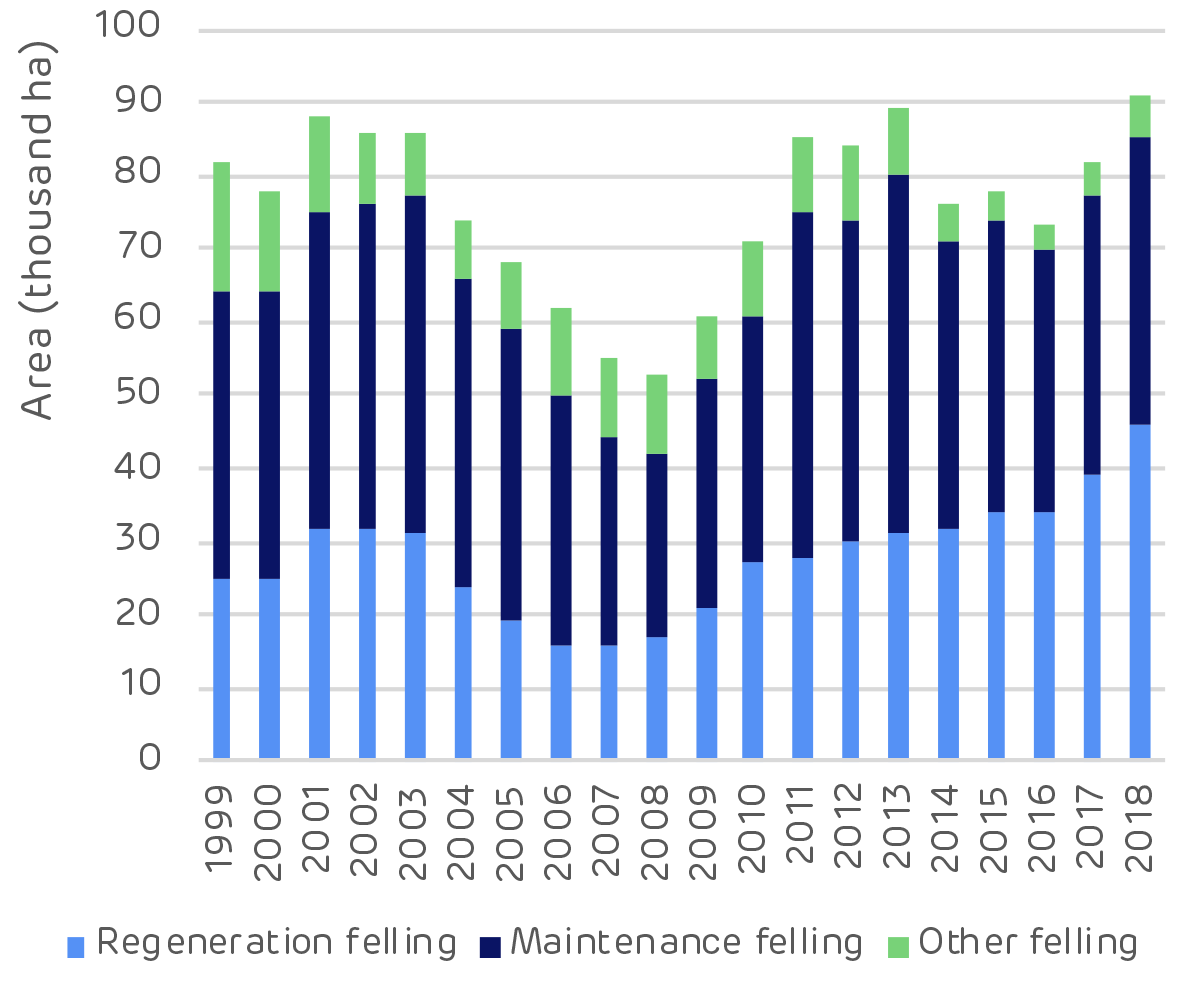
Clear cutting (regeneration felling) is the largest operation by volume but thinning (maintenance felling) is the largest by area.

This indicates a forest landscape in balance, with widespread thinning to produce more sawlog trees and a large volume of clear cuts in the mature stands to make way for the next generation of forests.

Reforestation in Estonia. * Note: Since 2014 it has not been compulsory for private and other forest owners to submit reforestation data. [Click to view/download]

Reforestation in Estonia. * Note: Since 2014 it has not been compulsory for private and other forest owners to submit reforestation data. [Click to view/download]

Planting of seedlings is the most common form of regeneration. However, some native hardwood species are strong pioneers and naturally regenerate among the spruce and pine stands. This has led to a change in the species composition of some forests with an increase in hardwoods, although this is relatively small scale and only prevalent among some small private owners that do not invest in clearing unwanted regeneration.

Species mix in Estonian forests [Click to view/download]

Species mix in Estonian forests [Click to view/download]

Markets and prices for forest products

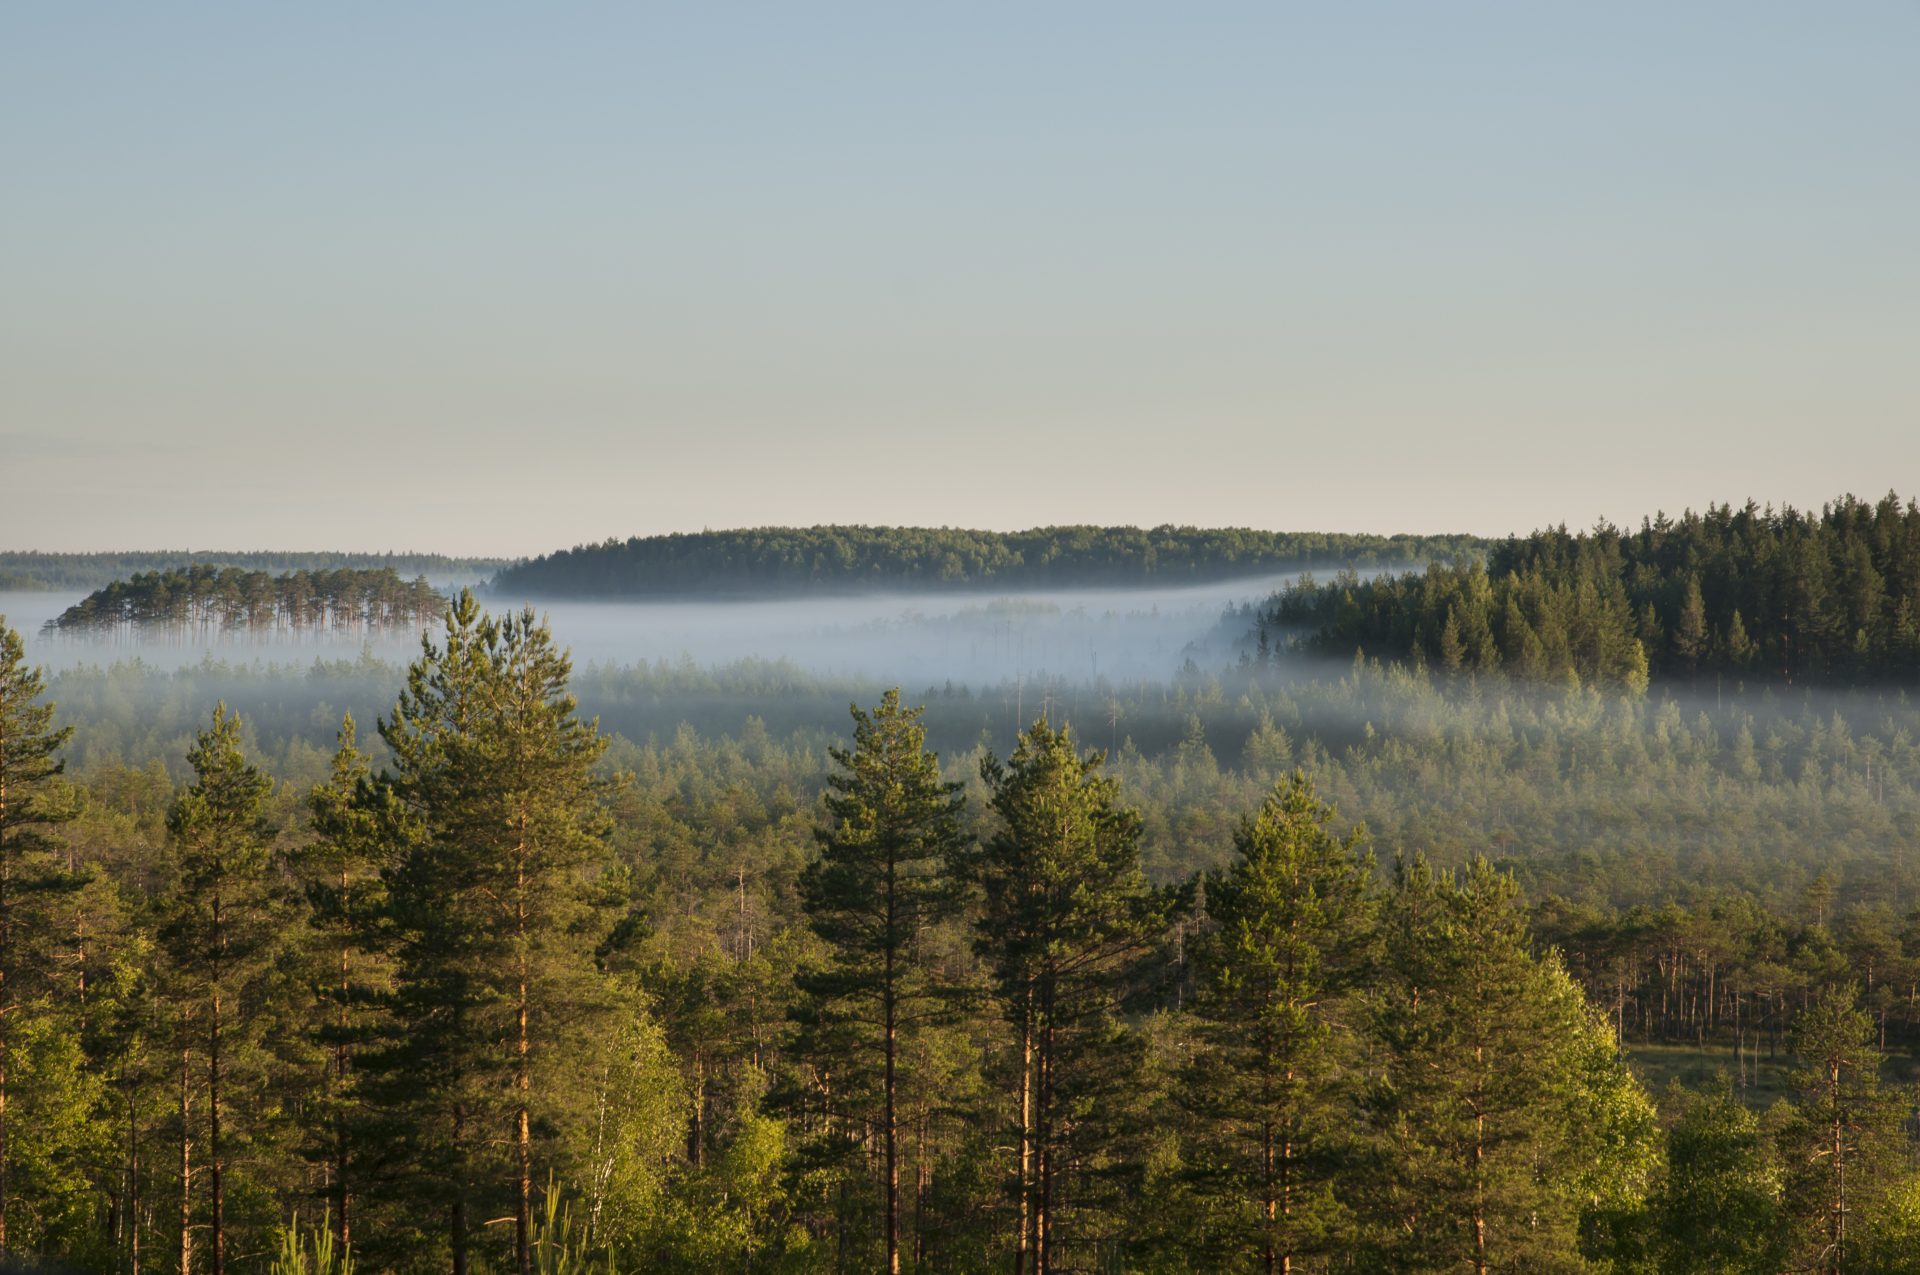
Sunrise and fog over forest landscape in Estonia

Sunrise and fog over forest landscape in Estonia

Pulpwood markets are limited in Estonia and this material has been historically exported to neighbouring Finland and Sweden. Export demand has had a significant impact on prices as can be seen in a spike in 2018 when demand was at its strongest.

The forest industry has been dominated by sawmills and panel board mills. Demand and production in this sector has been increasing and this has kept prices high. There is a substantial differential between sawlog and pulpwood pricing.

Comparison of sawlog and pulpwood prices [click to view/download]

Comparison of sawlog and pulpwood prices [click to view/download]

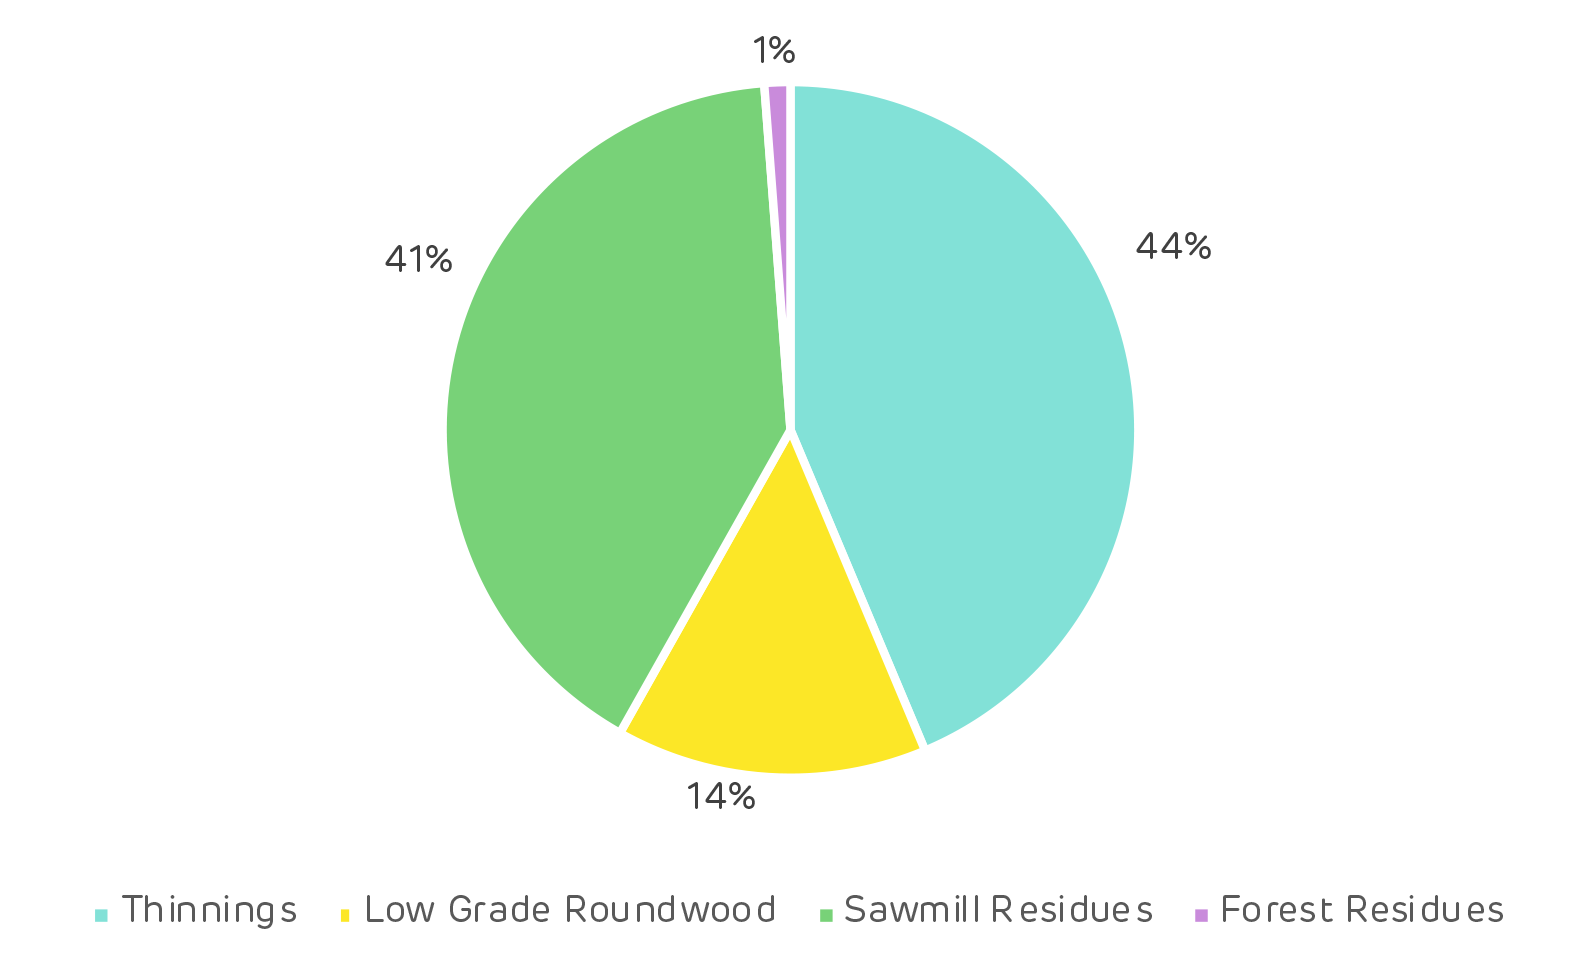
The pellet industry developed due to the abundance of low-grade fibre available domestically. This included sawmill and forest residues, as well as low grade roundwood from thinnings and clear cuts. Drax’s suppliers use a combination of these feedstock sources as shown below.

Drax feedstocks from Estonia 2018 [click to view download]

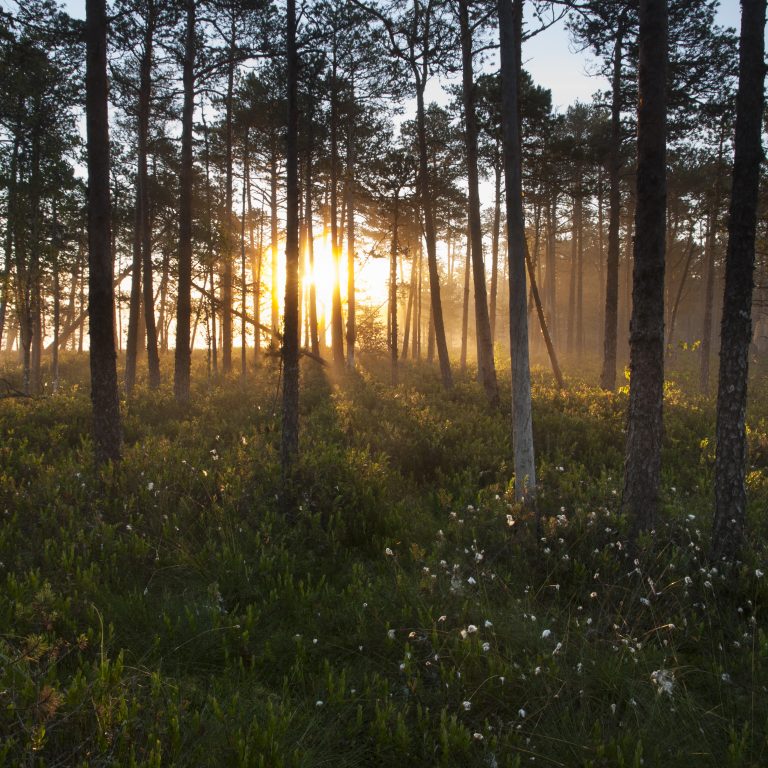
Sunrise through forest in Estonia

Sunrise through forest in Estonia

Summary of key questions addressed in the analysis:

Impacts of wood-based bioenergy demand to forest resources:

Forest area / forest cover

No negative impact. Regardless of increasing domestic biomass utilisation for energy and exports, forest area has increased due to afforestation programmes. Forest cover is not as high as forest area, due to temporarily un-stocked area after clear-cut. Despite this, forest cover has continuously increased from 2010–2018.

Growing stock

No negative impact. The total forest growing stock has been increasing for the last two decades. In 2018 the growth slowed or halted (official statistics show a decrease, but this is due to sampling error). In 2018 there was record-high wood demand from Finland, which was driven by high global pulp prices motivating maximal pulp production. This increased harvests to a previously unseen level.

Harvesting levels

Slight increasing impact. During 2004–2011, harvesting levels in Estonia were less than half of the estimated maximum sustainable level. This resulted in an increase in the maximum sustainable harvesting level for the 2011–2020 period. In 2018, the harvesting volumes were at the maximum sustainable level. The main drivers increasing the harvesting volumes have been increased sawmill capacity and production, high demand for pulpwood in Finland and Sweden and improved demand for energy wood. This was a temporary peak and demand has already slowed. Softwood lumber prices have decreased significantly in Europe due to an abundance of wood supply from Central Europe, which has been created by widespread bark beetle and other forest damages. Global pulp prices have also decreased to below 2017 prices.

Forest growth / carbon sequestration potential

Ambivalent impact. The annual increment has grown throughout the 2000–2018 period. Increased fuelwood price has enabled forest management in some of the alder forests that were completely unutilised in the past. Thinnings, both commercial and pre-commercial, accelerate long-term volume growth in forests, leading to increased carbon sequestration. Removal of harvesting residues decreases carbon sequestration since the residues are input to the soil carbon pool. However, the majority of the harvesting residues’ carbon is released to the atmosphere when the biomass decays, so the ultimate impact of harvesting residue collection is minimal if the collection is done on a sustainable level. The sustainability of the collection is determined by how the soil nutrient balance is impacted by collection. This is not accounting for the substitution effect that the harvesting residues may have, by e.g. reducing the need to burn fossil fuels. Utilisation of sawmill by-products does not directly impact forests’ carbon sequestration potential, but it can increase harvesting through improved sawmill overall profitability.

Impacts of wood-based bioenergy demand to forest management practices:

Rotation lengths

Neutral. Forest law regulates minimum forest age for clear-cuts. According to interviews, Riigimetsa Majandamise Keskus (RMK – the Estonian state forest company), often conducts the final felling at the minimum age. Due to the regulation, an increase of wood-based bioenergy demand has not shortened rotations at least in state-managed forests. In forests that are older than the minimum final felling age, sawlog price is a more important driver for final-felling decisions than wood-based bioenergy demand.

Thinning

Increasing impact. The increase of bioenergy demand has increased the demand for small-diameter hardwood, which in turn has increased thinnings in previously unmanaged forest stands. This will increase the availability of good quality sawlogs and will also accelerate the carbon sequestration (tonnes/ha/year) of the forests. However, the total forest carbon stock (tonnes/ha) will be reduced; in unmanaged (e.g. no thinnings) mature stands, the carbon stock is larger than in managed stands of similar age. The carbon stock of a thinned stand will remain below that of an unthinned stand regardless of post-thinning accelerated growth.

Conversion from hardwood to softwood

Neutral. No indication of hardwood conversion to softwood was found.

Impacts of wood-based bioenergy demand to solid wood product (SWP) markets:

Diversion from other wood product markets

Neutral. Production of sawnwood, wood-based panels, pulp and paper products have increased or remained steady, i.e. no evidence of diversion.

Wood prices

Slight increasing impact. During 2017–2018, the price of all roundwood assortments increased notably. The increase was strongest in pulpwood assortments, especially those that are not further processed domestically but are exported to mainly Finland and Sweden. Finnish demand for pulpwood was at a very high level in 2018. This was a temporary trend, however, and prices and demand have since decreased. The price increase for fuelwood was less dramatic, no sharp increases are observed. According to interviews, pellet production was the most important driver of fuelwood prices.

Read the full report: Catchment Area Analysis in Estonia. A 2017 interview with Raul Kirjanen, CEO of Graanul Invest, a wood pellet supplier of Drax operating in Estonia, can be read here. Read how Drax and Graanul work with NGOs when concerns are raised within our supply chain here.

Read more about how bioenergy has no negative impact on Estonia’s forest resources here.

This is part of a series of catchment area analyses around the forest biomass pellet plants supplying Drax Power Station with renewable fuel. Others in the series include: Georgia Mill, Latvia, Chesapeake and Drax’s own, other three mills LaSalle BionergyMorehouse Bioenergy and Amite Bioenergy.

How biomass wood pellet mills can help landowners grow healthy forests

Working Forests US South

International Paper’s pulp and paper mill, located in the Morehouse parish of Louisiana, had been in operation since 1927 and was once the largest employer in the area. However, as a result of the global recession of 2008, the company was forced to lay off over 550 employees and shut the facility. Other mills in the area have also reduced production including Georgia Pacific which let go around 530 people at its Crossett, Arkansas plant 18 miles to the north of Morehouse in 2019.

For an area dominated by forests, such as Northern Louisiana and Southern Arkansas, this decline in traditional markets came as a serious blow. It’s a region where a healthy market for wood products is vital for the local economy and, in turn, the health of the region’s forests. Luckily other wood product manufacturers and industries have since began to fill the gap.

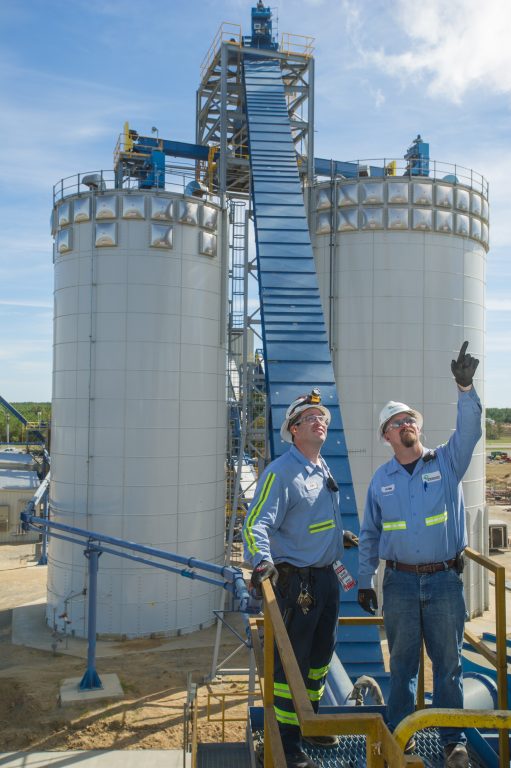
Engineers in front of wood pellet storage silos at Drax's Morehouse BioEnergy biomass manufacturing facility in northern Louisiana

Engineers in front of wood pellet storage silos at Drax’s Morehouse BioEnergy biomass manufacturing facility in northern Louisiana

Drax Biomass has opened a mill in Morehouse parish that uses some of the the low-grade wood previously used to supply the paper industry to produce compressed wood pellets, which are used to generate renewable electricity in the UK.

Commissioned in 2015, the plant employs 74 people and can produce as much as 525,000 metric tonnes of biomass pellets a year. This makes it an important facility for local employment and the wood market in the region. However, to ensure it is positively contributing to the area and its environment, the demand for wood must be sustainably managed.

Morehouse BioEnergy sources low-grade wood from a catchment area that covers a 60-mile radius and includes 18 counties in Arkansas and four in Louisiana.

As Drax Biomass doesn’t own any of the forests it sources wood products from, it regularly examines the environmental impact of its pellet mills on the forests and markets in which it operates. The aim is to ensure the biomass used by Drax to generate 12% of Great Britain’s renewable electricity is sustainably sourced and does not contribute to deforestation or other negative climate and environment impacts.

A new report by forestry research and consulting firm Forisk evaluates the impact of biomass pellet demand from Morehouse BioEnergy on the forests and wood markets within the mill’s catchment area.

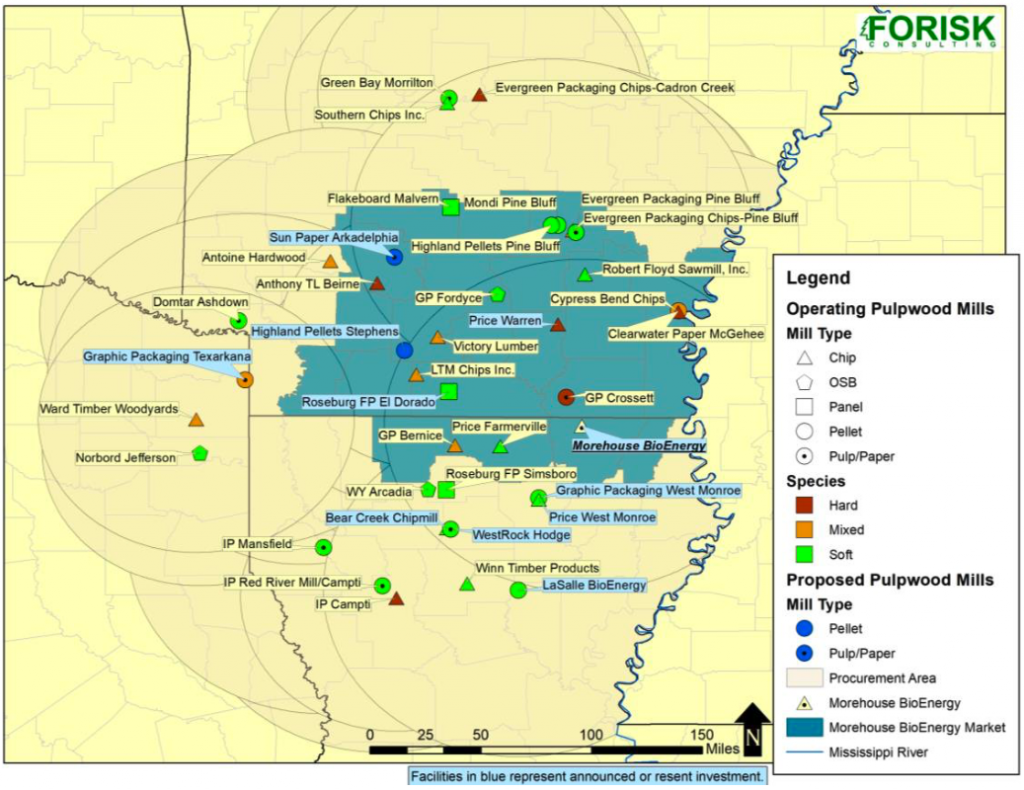
Map of pulpwood-using mills near Morehouse timber market

Map of pulpwood-using mills near Morehouse timber market

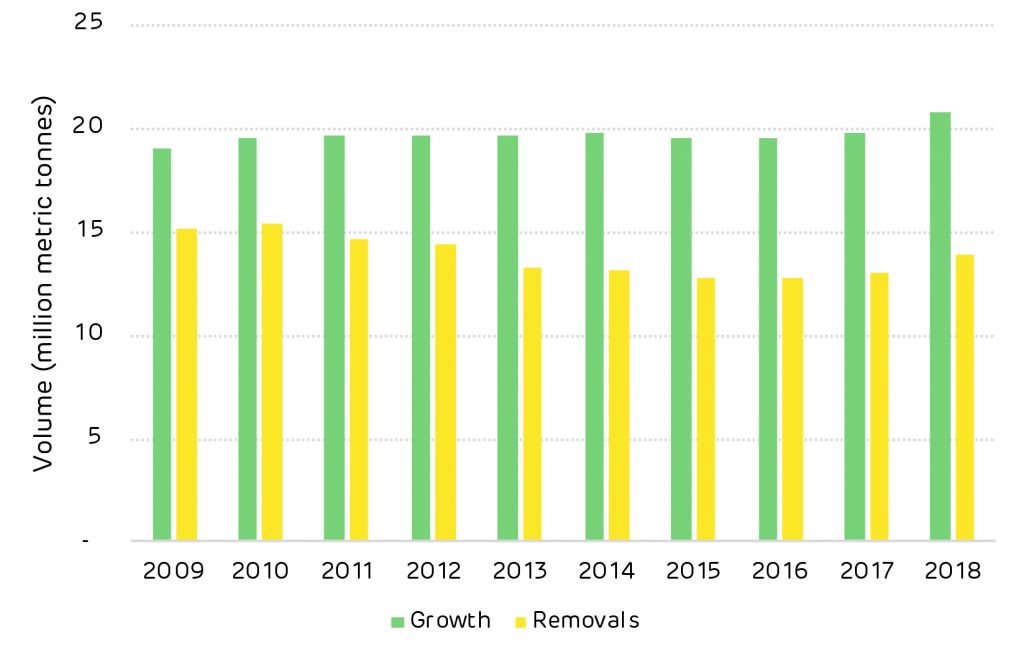
It found that biomass demand in the region does not contribute to deforestation, nor increase forest harvesting above a sustainable level. Overall, growth of the region’s pine timberland, which supplies Morehouse BioEnergy, continues to exceed removals, pointing to expanding forest carbon and wood inventory.

Annual growth compared to harvesting removals

Annual growth compared to harvesting removals

Growing forests and increasing timber stocks

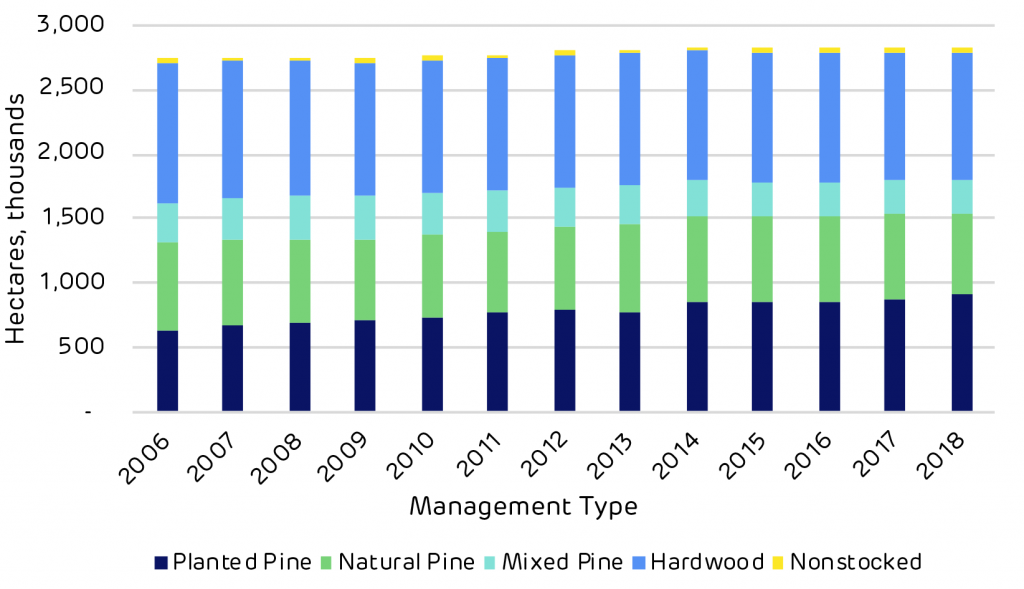
The study focuses on timberland – working forests – in the plant’s sourcing area, which the US Forestry Service categorises as productive land capable of providing timber on an industrial scale.

The timberland here is made up of 63% softwood trees, which includes pines, and 37% hardwoods such as oak. Pellet manufacturing as a whole (including other pellet producers in the area), accounts for only 6% of the demand for wood products in the region. Of that, Morehouse BioEnergy contributes to 4% of total pellet demand.

Total area of timberland

Total area of timberland

Lumber – such as sawtimber – makes up the bulk of demand for wood products, accounting for 46% of total demand, largely as a result of its high market value and landowners’ aims to extract maximum revenue from their pine stands.

However, the less valuable wood – parts of trees that are misshapen, too short or thin to be used for lumber – can be sold at a lower price to biomass pellet mills. This wood might previously have been sold to paper and pulp mills exclusively, but with International Paper’s departure, Morehouse BioEnergy now fills a part of that role.

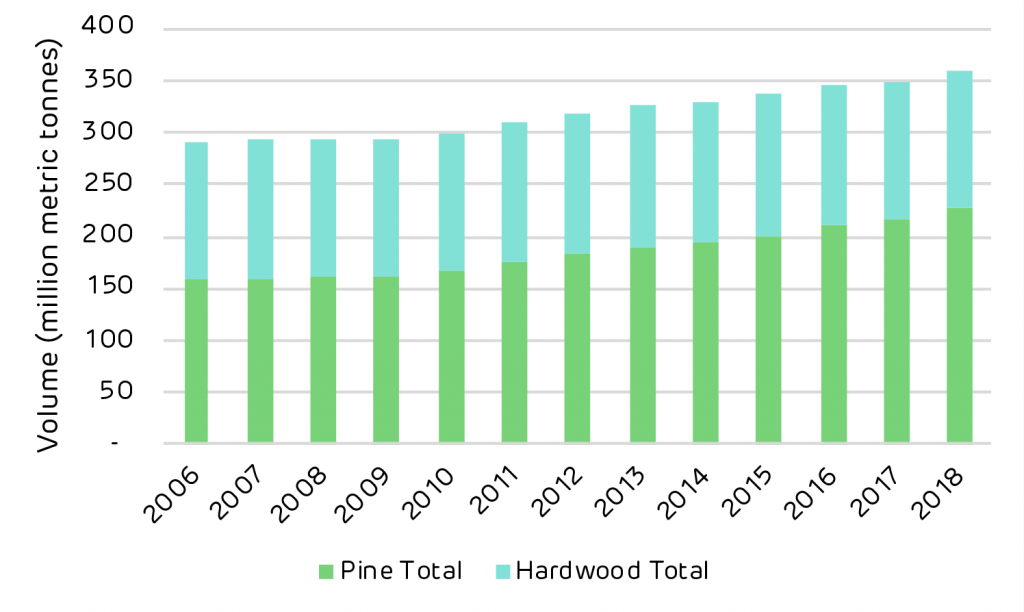
Total volume of growing stock on timberland

Total volume of growing stock on timberland

Maintaining healthy markets for both high and low-value wood is key to enabling landowners to reforest areas once they have been harvested in the knowledge it will provide a valuable return in the future. Ultimately, however, the way forests are maintained depends on the individual landowners and how they want to use their land.

The advantages of corporate ownership

Morehouse BioEnergy’s catchment area covers 28,000 square kilometres of timberland, within which 96% of the timber is privately owned. While some of that is owned by families with small patches of productive land, 54% is held by corporate owners. This includes businesses such as real estate investment trusts (REITs) and timber investment management organisations (TIMOs), which advise institutional investors on how to manage their forest assets.

This high percentage of corporate ownership influences forest management and replanting, as owners look to maximise the value of forests and seek to continue to generate returns from their land.

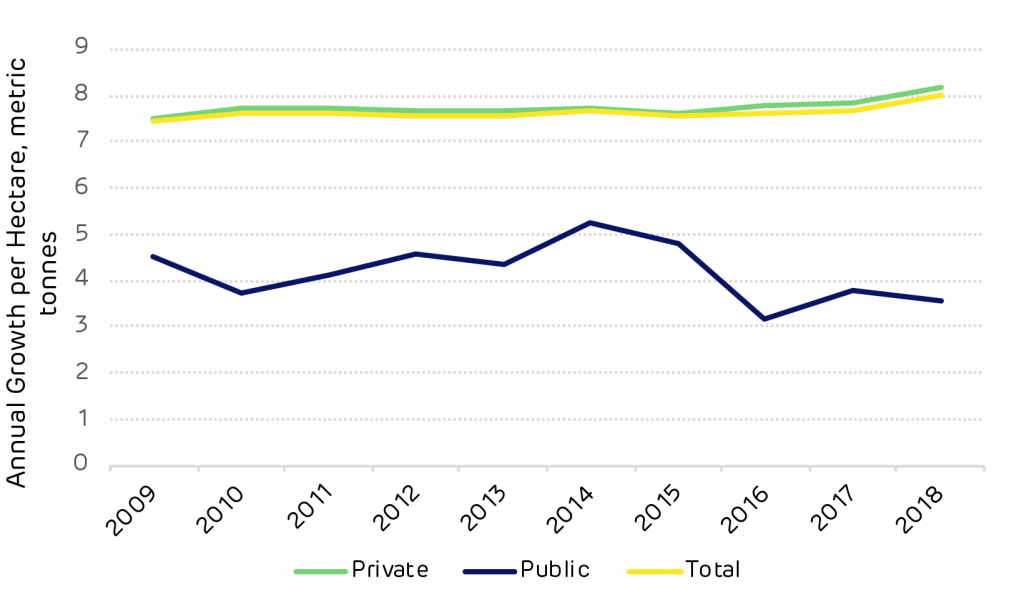
“In general, corporate owners are spending more money on silviculture and actively managing their timber stands,” explains Forisk Consulting Partner Amanda Lang. “They are investing more in fertiliser, their seedlings and harvest control on pine stands, because that leads to larger trees of a higher quality and more profit in the long run.” This is reflected in the higher growth rates found in the private sector, leading to faster rates of carbon sequestration.

Annual growth per hectare by owner type

Annual growth per hectare by owner type

Smaller private landowners, meanwhile, may have other objectives for their land like recreation and hunting, in addition to timber income. As a result, some owners may be less inclined to intensively manage their timber stands, forgoing fertilisation and competition control (due to cost) and might harvest on a less regular basis. Although these landowners may not be maximising the productivity of their timber resource to the same degree corporate owners do, their unique management often contribute to greater diversity on the landscape.

Demand and forest health

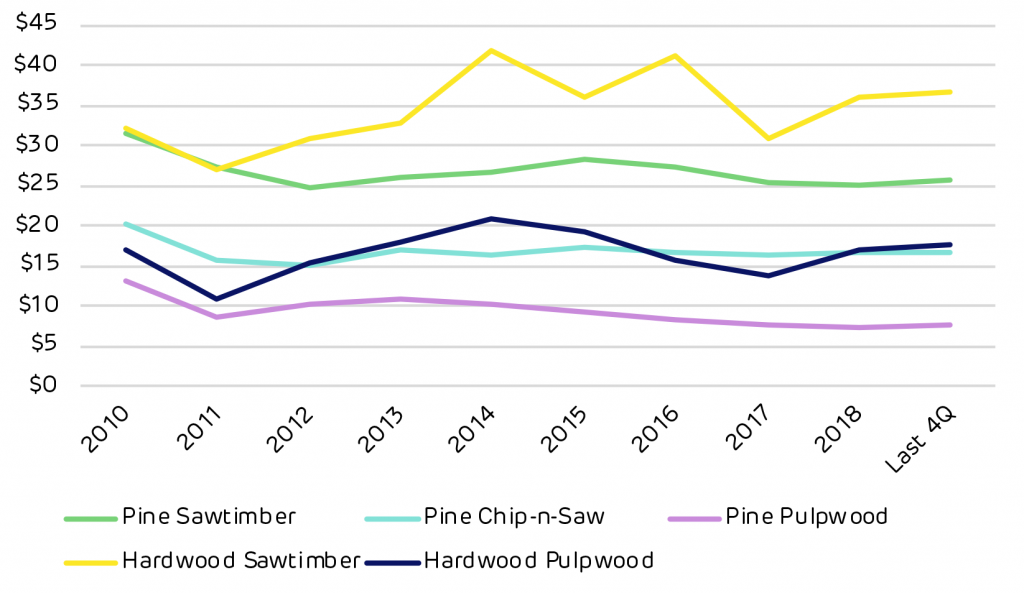
In 2018 the annual average price for a metric tonne of pine sawtimber in Morehouse BioEnergy’s catchment area was $25.71, down from a 10-year high of $31.60 in 2010. Similarly, pine pulpwood, from which biomass pellets are made, was valued at $7.75 per metric tonne in 2018, down from a 10-year high of $13 in 2010.

These low wood prices have caused many landowners to delay harvesting forests in hopes for a more lucrative wood price. As a result, pine timber inventories have grown across Morehouse BioEnergy’s catchment area. In 2010 the US Forest Service counted more than 167 million metric tonnes of pine inventory. By 2018 this had increased by more than 35% to reach 226 million.

Morehouse BioEnergy market historic stumpage prices, $/metric tonne

Morehouse BioEnergy market historic stumpage prices, $/metric tonne

The report suggests this price slump is an ongoing result of the 2008 recession, which greatly affected US house construction – one of the primary uses of sawtimber and many other types of wood products in the US. Some areas have already seen sawtimber prices increase as they recover from the recession, however, the report suggests this is not spread evenly on a national level.

The inventory overhang in Morehouse BioEnergy’s catchment area is expected to begin reversing in 2024 or 2025, as Lang explains: “We expect inventories to increase for a few more years and then start to decline. That said, inventories will remain higher than pre-recession levels.”

While high inventories suggest an abundant resource, lower inventory volumes are not indicative of declining or unhealthy forests. Rather, they can point to younger, growing forests that have recently been replanted, which will later grow to higher inventory volumes as they mature. Both suggest a healthy forestry industry in which landowners continue to reinvest in forests.

Overall, the analysis of the region points to healthy, growing forests and, importantly, a sustainable industry from which Drax can responsibly source biomass pellets. Ensuring the biomass used at Drax Power Station is sustainably sourced is crucial to its generation of renewable, carbon-neutral electricity, and in turn laying the path to negative emissions.

Read the full report: Morehouse, Louisiana Catchment Area Analysis. A short summary of its analysis and conclusions, written by our forestry team, can be read here. Explore every delivery of wood to Morehouse BioEnergy using our ForestScope data transparency tool.

Morehouse catchment area analysis

Working forest in southern Arkansas within the Morehouse catchment area

The forest area around the Drax Morehouse BioEnergy plant has a long history of active management for timber production. 96% of the forest owners are private and around half of these are corporate investors seeking a financial return from forest management. The pulp and paper (p&p) sector dominates the market for low grade roundwood with over 75% of the total demand. The wood pellet markets use only 6% of the roundwood, of which 4% is used by Morehouse.

Given the small scale of demand in the pellet sector, the extent of influence is limited. However, the new pellet markets have had a positive impact, replacing some of the declining demand in the p&p sector and providing a market for thinnings for some forest owners and a new off-take for sawmill residues.

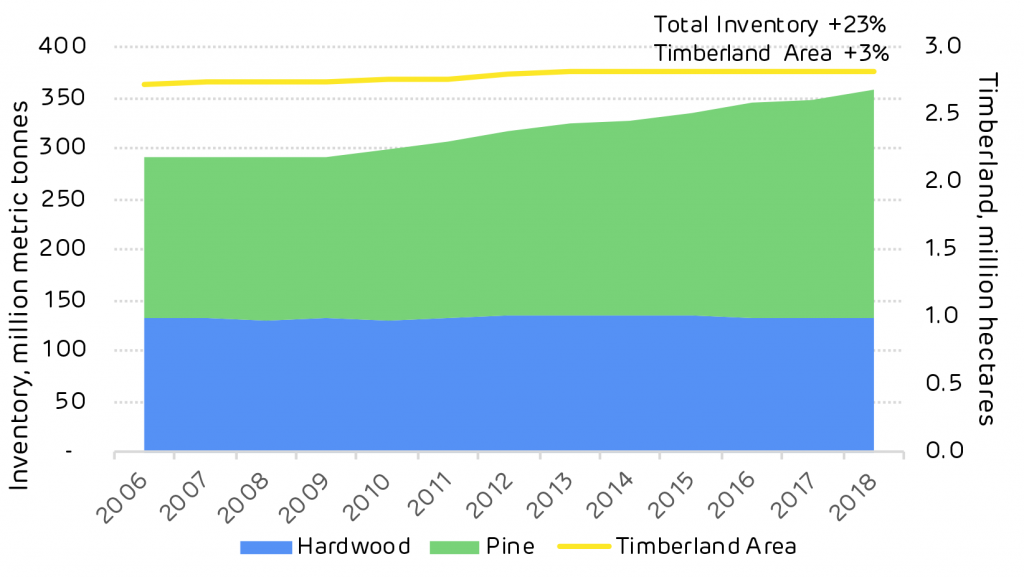
Pine forest is dominant in this area with an increasing inventory (growing stock) despite a stable forest area. Active management of pine forests has increased the amount of timber stored in the standing trees by 68 million tonnes from 2006 to 2018.  Over the same period the hardwood inventory remained static.

Chart showing historic inventory and timberland area in Morehouse catchment

Historic inventory and timberland area in Morehouse catchment; click to view/download.

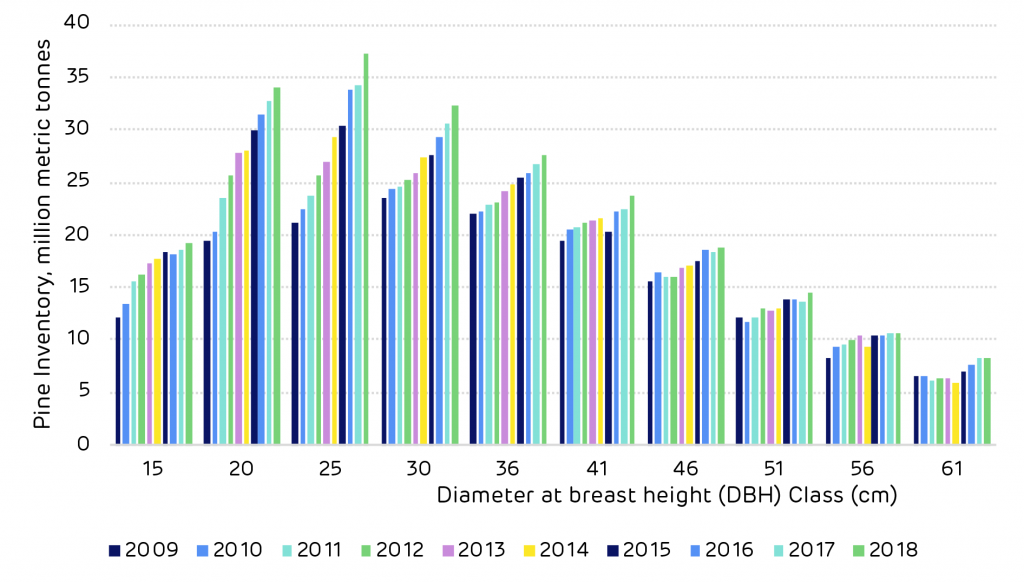
US Forest Service FIA data shows that the pine resource in this catchment area has been maturing, the volume of timber has been increasing in each size class year on year. This means that the volume available for harvesting is increasing and that more markets will be required to utilise this surplus volume and ensure that the long-term future of the forest area can be maintained.

Chart showing historic pine inventory by DBH Class

Historic pine inventory by DBH Class in Morehouse catchment; click to view/download.

This is reflected in the growth drain ratio – the comparison of annual growth versus harvesting. A ratio of one shows a forest area in balance, less than one shows that harvesting is greater than growth. This can be the case when the forest area is predominantly mature and at the age when clear cutting is necessary.

A growth drain ratio of more than one shows that growth exceeds harvesting, this is typically the case in younger forests that are not yet ready for harvesting and are in the peak growing phase, but it can also occur when insufficient market demand exists and owners are forced to retain stands for longer in the absence of a viable market.

Drax Morehouse plant

Drax’s Morehouse BioEnergy compressed wood pellet plant in northern Louisiana

This can have a negative impact on the future growth of the forest; limiting the financial return to forest owners and reducing the cumulative sequestration of carbon by enforcing sub-optimal rotation lengths.

The current growth drain ratio of pine around Morehouse is 1.67 with an average annual surplus of around 7 million metric tonnes. This surplus of growth is partly due to a decline in saw-timber demand due to the global financial crisis but also due to the maturing age class of the forest resource and the increasing quantity of timber available for harvesting.

Historic growth and removals of pine in Morehouse catchment (million metric tonnes)

YearGrowthRemovalsNet GrowthGrowth-to-Drain
200914.112960762411.1860124622.92694830041.26166145535
201014.580331100610.91819493463.662136166021.33541589869
201115.129903273610.72162297824.408280295451.41115792865
201215.357258404710.30755904395.049699360811.48990254039
201315.63898206189.701617808065.93736425371.61199733603
201415.91041518229.376564771556.533850410651.69682773701
201515.94235364499.669133266476.273220378431.64878828387
201616.43527840789.579357241816.855921165961.71569740985
201716.838075354610.1594737396.678601615681.65737672908
201817.770968348910.65938820047.111580148561.66716588371

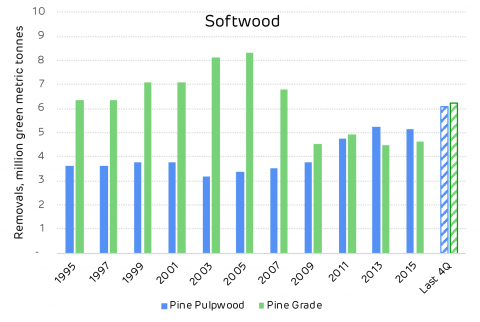
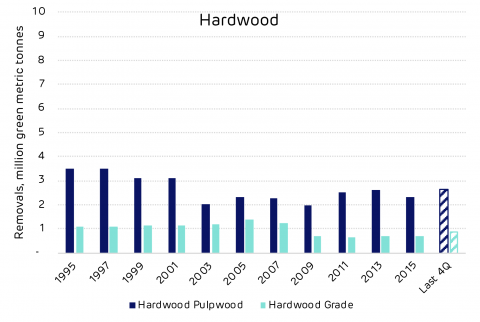
The chart below shows the decline in pine saw-timber demand in the catchment area following the financial crisis in 2008. It also shows the recent increase in pulpwood demand driven by the new pellet mill markets that have supplemented the declining p&p mills.

Sawmills are a vital component of the forest industry around Morehouse, with most private owners seeking to maximise revenue through saw-timber production from pine forests.

As detailed in the table below, there are 70 markets for higher value timber products around this catchment area. These mills also need an off-taker for their residues and the pellet mills can provide a valuable market for this material, increasing the viability of the saw-timber market.

Operating grade-using facilities near Morehouse timber market

TypeNumber of MillsCapacityCapacity UnitsHardwood Roundwood At Mill From MarketSoftwood Roundwood At Mill From Market
Consumption, million green metric tonnes
Lumber6810538.8235294M m³1.737194320550.88604623042613.06745552335.69986977638
Plywood/Veneer2904M m³000.9617438725360.506109617373
Total701.737194320550.88604623042614.02919939586.20597939376

Pulp and paper mills dominate the low grade roundwood market for both hardwood and softwood. The pellet mill market is small with just 3 mills and therefore does not influence forest management decisions or macro trends in the catchment area. However, demand for wood pellet feedstock exceeds 1.5 million tonnes p.a. and this can provide a valuable market for thinnings and sawmill residues. A healthy forest landscape requires a combination of diverse markets co-existing to utilise the full range of forest products.

Operating pulpwood-using facilities near Morehouse timber market

TypeNumber of MillsCapacityCapacity UnitsHardwood Roundwood At Mill From MarketSoftwood Roundwood At Mill From Market
Consumption, million green metric tons
Pulp/Paper117634.86896M metric tons3.489826926741.192570970097.557287050371.66598821268
OSB/Panel62412.55M m³002.567325398621.19890681942
Chips178395.08999M metric tons2.938909722111.46484421365.287607151192.18745126814
Pellets31573.965975M metric tons002.078219858451.01128896402
Total346.428736648862.6574151836917.49043945866.06363526426

In its analysis, Forisk Consulting considered the impact that the new pellet mills including Morehouse BioEnergy have had on the significant trends in the local forest industry. The tables below summarise the Forisk view on the key issues. In its opinion, the Morehouse plant has had no negative impact.

Bioenergy impacts on markets and forest supplies in the Morehouse market

ActivityIs there evidence that bioenergy demand has caused the following?Explanation
DeforestationNo
Change in forest management practiceNo
Diversion from other marketsPossiblyBioenergy plants compete with pulp/paper and OSB mills for pulpwood and residual feedstocks. There is no evidence that these facilities reduced production as a result of bioenergy markets, however.
Increase in wood priceNoThere is no evidence that bioenergy demand increased stumpage prices in the market.
Reduction in growing stocking timberNo
Reduction in sequestration of carbon / growth rateNo
Increasing harvesting above the sustainable yieldNo

Bioenergy impacts on forests markets in the Morehouse market

Forest metric Bioenergy impact
Growing Stock Neutral
Growth Rates Neutral
Forest Area Neutral
Wood Prices Neutral
Markets for Solid Wood Neutral to Positive*
*Access to viable residual markets benefits users of solid wood (i.e. lumber producers).

Read the full report: Morehouse, Louisiana Catchment Area Analysis. An interview with the co-author, Amanda Hamsley Lang, COO and partner at Forisk Consulting, can be read here. Explore every delivery of wood to Morehouse BioEnergy using our ForestScope data transparency tool.

This is part of a series of catchment area analyses around the forest biomass pellet plants supplying Drax Power Station with renewable fuel. Others in the series include: ,

Others in the series include: Georgia MillEstonia, Latvia, Chesapeake and Drax’s own, other three mills LaSalle BionergyMorehouse Bioenergy and Amite Bioenergy.

Letter from Will Gardiner to the Independent Advisory Board on Sustainable Biomass

Dear John, 

Thank you for your letter of the 9 January, detailing the findings and recommendations from the first meeting of the Independent Advisory Board on Sustainable Biomass.

I want to begin by reiterating how important the work of the IAB is to Drax’s purpose and ambition. As you know, we recently announced our intention to become the world’s first carbon negative company by 2030 by scaling up our pioneering biomass with CCS (BECCS) pilot project. This ambition will only be realised if the biomass we use makes a positive contribution to our climate, the environment and the communities in which we operate. To that end, both you and the IAB will play a vital role by guiding us on our sourcing choices and challenging us to be as sustainable and transparent as we can be.

I enjoyed meeting with the IAB and hearing your conclusions from the first meeting. I am also pleased to hear from my team that the longer discussions were useful and constructive. Please pass on my thanks to all the members of the IAB for their time and consideration.

In particular, I am grateful for their consideration of our new sustainable biomass sourcing policy and the insight and recommendations that were given. I am pleased to hear that you agree our policy is an accurate representation of the criteria laid down in the Forest Research report.

I agree that a key topic for us to explore is how science can be further developed with regards the use of small, early thinnings and small roundwood. I also agree that understanding the counter factuals in the usage of wood that has come to us is important. This is an area we have, and continue to, explore, and I would refer the IAB to a report we have published subsequent to the meeting, “Catchment Area Analysis of Forest Management and Market Trends (2019)”– which contains an independent analysis of the impact of our sourcing at our Amite pellet mill in Mississippi. The team look forward to discussing this with you at a future meeting and receiving your input to shape the next phases of this work.

I also agree the need to continuously improve our sustainability policy and seek to update it as new findings come to light, as well as ensure that the current policy is embedded into our operations. For that reason, our policy will be kept under regular review to accommodate changes in science and new evidence as it emerges. We have also committed to advancing scientific research in the areas applicable to our operations through partnerships with academic institutions and direct support for academic research.

With regards your suggestion of a restatement of the academic evidence on biomass sustainability, we shall give this interesting approach due consideration. I do believe that better alignment through a shared understanding of the evidence among the academic community, environmental groups, policy makers and industry would be a welcome development and would be grateful to the IAB for its further consideration of how this might be achieved.

I will also raise your considerations regarding the Sustainable Biomass Program (SPB) in my position a member of the SPB Board. You are correct that our new policy goes beyond SBP, and so an important work programme for us is how we demonstrate we are meeting the new policy.

Lastly, I welcome the addition of two interim telephone calls which will help to keep momentum between the half yearly meetings and will support us as we develop our policy, research and implementation projects further. Thank you for this commitment.

As the work of the IAB progresses, I look forward to hearing how you believe Drax can best build the evidence required to demonstrate that we are sourcing according to the best available science. As the world’s largest biomass consumer it is important that we lead by example. This means not only having a world leading biomass sustainability policy in place, but also the data and evidence available to give all our stakeholders the confidence that we are fulfilling our purpose of enabling a zero carbon, lower cost energy future.

Thank you once again for your participation and expertise.

Yours,


Will Gardiner

Group CEO

View/download the PDF version here

Findings and Recommendations from the First Meeting of Drax’s Independent Advisory Board on Sustainable Biomass (IAB)

Sir John Beddington

Dear Will,

Findings and Recommendations from the First Meeting of Drax’s Independent Advisory Board on Sustainable Biomass (IAB)

The Independent Advisory Board on Sustainable Biomass provides this statement following its first meeting on Friday 15th November 2019.

Attendees: John Beddington (Chair), John Krebs (Deputy Chair), Virginia Dale, Sam Fankhauser, Elena Schmidt, Robert Matthews (Ex-Officio Member).

During the meeting, IAB members:

The IAB shares this summary of its findings and recommendations.

  • The IAB agreed that its role is to provide independent advice to Drax on its sustainable biomass policy and practice. IAB members will do this by scrutinising the science and evidence, informing Drax’s approach, and by providing independent feedback to Drax on how it can adopt best practices. In addition to holding two face to face meetings each year, the IAB agreed to hold two interim telephone meetings.
  • The IAB recommended Drax refer to “forest environment” not “natural environment” in its policy.
  • The IAB noted that the ten criteria Drax have outlined to reduce the carbon emissions of its biomass approach have been designed to reflect the findings of Forest Research’s Carbon Impacts of Biomass Consumed in the EU report (2018). The IAB found that the Drax criteria are an accurate interpretation of the report.
  • The IAB would like to explore how the science can further be developed with regard to the use of small, early thinnings and small roundwood, and consider how Drax’s policy might evolve.
  • The IAB and Drax discussed the possibility of developing some sub criteria for specific forest types.
  • The IAB suggested Drax could consider a “Restatement of the Evidence” academic review process to better understand, and draw alignment on, where there is scientific evidence on the sustainability of biomass.
  • The IAB suggested Drax should consider both a goal to continuously improve and consider the longer term implications of its policy commitments in light of potential climate changes.
  • The IAB emphasised that the way Drax operationalises its commitments will be critical. It stressed the importance of robustly exploring the counterfactuals to Drax’s biomass activities, highlighting the potential for trade-offs between climate and biodiversity outcomes as an area for more detailed review.
  • The IAB highlighted a number of considerations for Drax in its use of the Sustainable Biomass Program (SBP). It welcomed SBP’s adoption of a multi-stakeholder approach and suggested it will be important to scrutinise its evolution. It noted that, as Drax’s sustainability commitments go beyond SBP’s current criteria, Drax needs a strategy on how to evidence the compliance for these additional commitments.
  • The IAB expressed interest in learning about Drax’s long term vision. It noted that the ceasing of subsidies in 2027 will be a key milestone and highlighted its interest in exploring Drax’s strategy for managing this.

In future meetings with Drax, the IAB will further examine evidence of Drax’s approach, performance and impact against its commitments, to identify any changes that Drax may need to make. The IAB noted the following specific topics for further consideration:

  • Evidence relating to the impact of thinning a forest on carbon, pest control and fire risks;
  • How Drax operationalises its commitments, the counterfactuals of Drax’s biomass activities, and potential trade-offs between biodiversity and carbon outcomes;
  • Drax’s approach to biodiversity;
  • Drax’s long term vision including its plans for developing and scaling bioenergy with carbon capture and storage (BECCS) and its broader roadmap to net zero carbon emissions;
  • Drax’s evidencing for each of its climate related commitments;
  • Potential differences between the standards expected by stakeholders and local legal standards;
  • Water and soil management practices.

Yours sincerely,

Professor Sir John Beddington
Chair of the IAB

View/download the PDF version here

Trusting in trees – How four countries transformed their forests

Minimalist tree top with light blue sky background

From arctic-circle, snow-laden pines to damp equatorial rainforests, to dry Australian scrublands, the planet is home to an incredibly diverse range of forested environments.

And while each region is very different, almost all have been impacted by humans. The effects of this have not always been positive, and despite decades spent raising awareness of the importance of forests for the health of the world, some regions’ forests remain in decline. Africa and Asia in particular have seen a decline in forest cover (although each year sees less lost) over the past few decades.

But there are areas where the impact of humans is in fact having a positive effect. This is largely thanks to the introduction of modern sustainable forestry practices, which have incentivised growth and helped bringing a variety of environmental and economic benefits to different regions around the world.

A recent report by Pöyry Management Consulting for Drax has looked in depth at these benefits and in particular, four regions where different approaches to sustainable forestry have brought a positive impact to people, industry and the environment alike.

More than a testament to the beneficial effects sustainable forest management can have, it shows that while the tactics, methods and environments may differ, their positive effects are universal.

US South: Turning around old practices

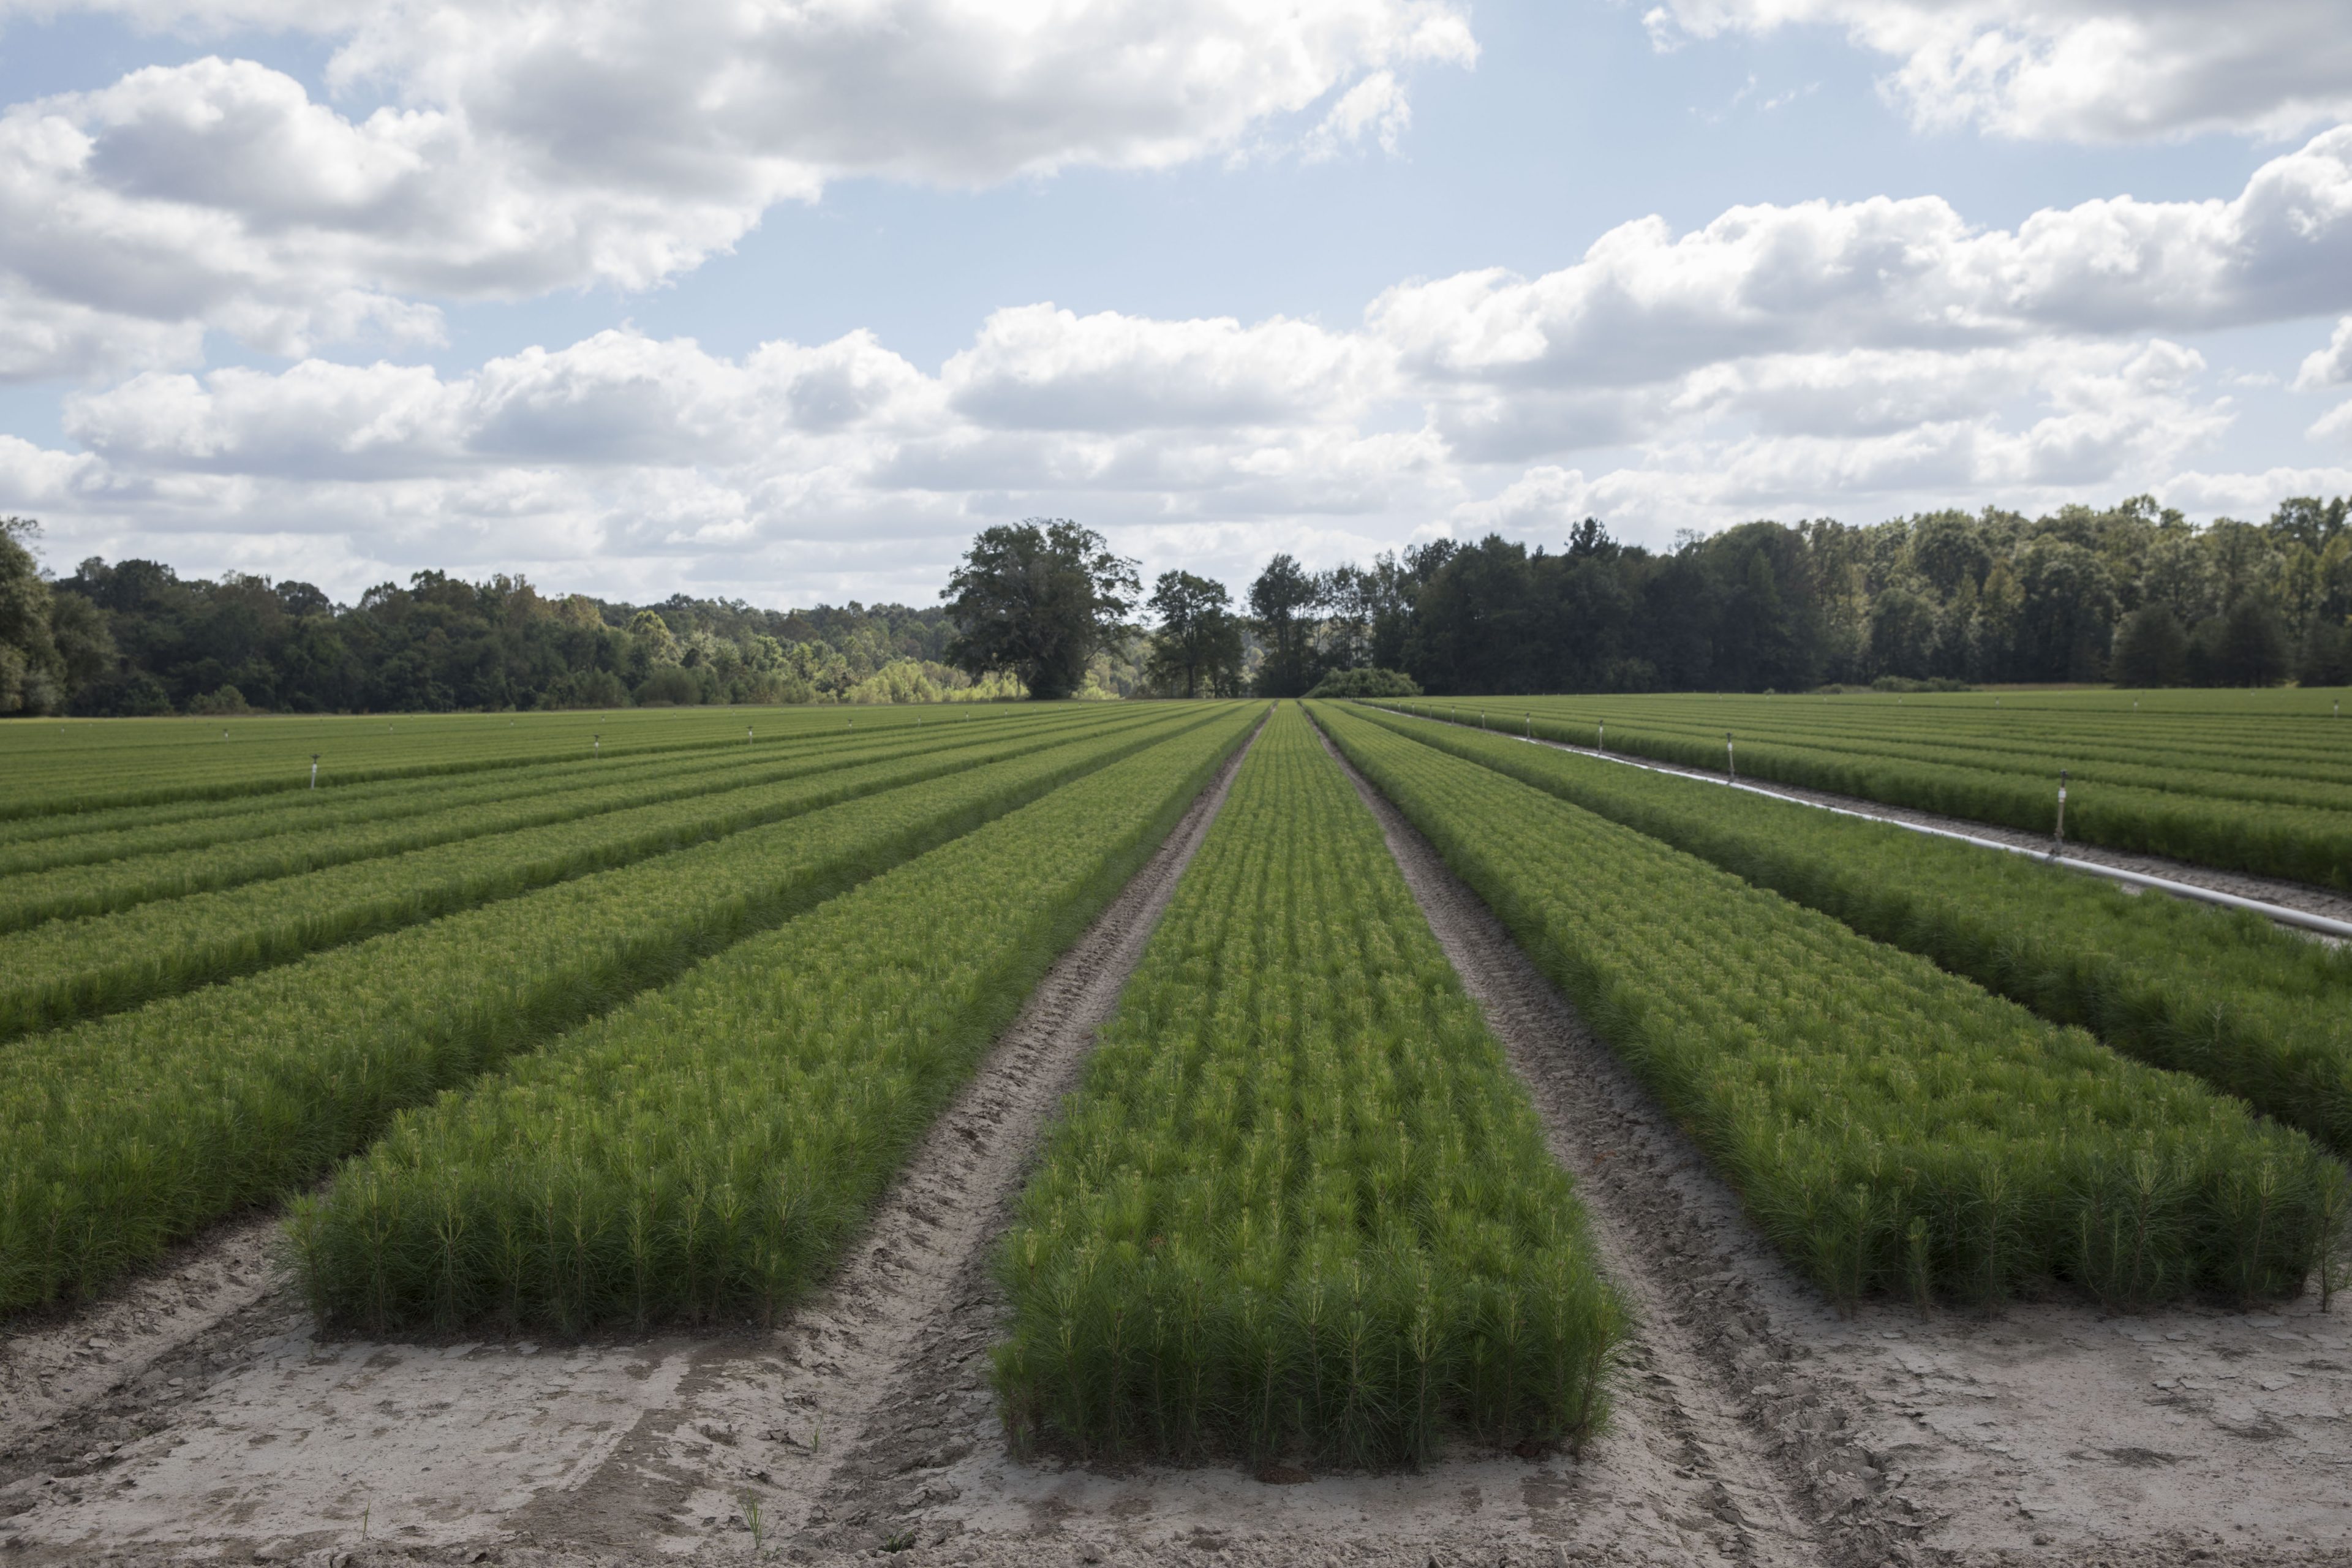
Weyerhaeuser Nursery, Camden, Alabama

The forests of the US South, from Virginia and Kentucky to Texas and Florida, have a long history of misuse. Both indigenous people and later European settlers used disruptive techniques such as large scale burning and removed valuable, mature hardwood on a mass scale, often leaving areas to naturally regenerate.

That largely changed in the mid-20th century, however, when forestry became more-intensive and the need for sustaining a supply of quality timber grew more apparent. The introduction of processes such as thinning and managed regeneration helped usher in a more responsible approach that has led to growth in both the forestry industry and forest coverage.

Between 2010 and 2015 there was 50% more growth in the volume of forests than was removed from harvesting. More than just growing forest area, this means an increase in the amount of carbon being absorbed and stored from the atmosphere.

Charts: US South historical increment to removal and US South above ground carbon 1957-1997.

In the US South, around 86% of forest land is privately owned by either corporations or individuals, but the economics of sustainable forestry practices has encouraged the overall growth in forests, even with limited regulations on land use in the area.

In addition to the native birds and mammals that depend on sustainably managed forests in the region, more than 200,000 people were employed by the industry in 2016, making it a vital part of local rural economies.

Finland: A century-long history of sustainable practices

Asikkala, Finland by Taneli Lahtinen on Unsplash

Wood and wood products play an important role in Finnish culture, from its famous saunas to the world’s largest wooden church – multinational phone brand Nokia even started life in in 1865 as a wood pulp mill.

A high demand for wood as a commercial product meant that a few centuries ago Finland’s forests where in a state of heavy degradation. But starting as far back as 100 years ago sustainable practices such as planned harvesting and regeneration legislation were introduced. The results are significant: there is now more wood in Finnish forests today than at the turn of the century.

The majority (61%) of Finland’s forests are privately owned, with the state owning 25%, companies only owning 8%, and 5% held by other owners. Many large companies, however, offer services such as forestry work, wood sales, drainage and tax services to private owners. This collaboration between sectors allows for best practices to be easily shared and quickly become widespread.

As a result, forest stocks have increased from 1,500 million m3 in 1970 to 2,500 million m3 in 2015, even while overall forest area has remained largely the same. It highlights the effectiveness of legislation, guidelines and certification in regenerating forests.

Chart: Forest growing stock in Finland

UK: Incentivising growth and diversity

The UK was once thought to be 30% covered by forestland, but by the turn of the last century forests made up less than 5%. Today, however, this has grown to as much as 13%, owing largely to regulation and incentives.

Chart: Forest area in UK by country and type over previous 10 years.  

As far back as the 1700s the UK had become dependent on wood imports from New England in the US and the Baltics in Europe. Following the First World War the Forestry Commission was established, primarily to try prevent timber shortages during times of war, but it went on to drive a boom in new plantations across the country and introduce grant schemes for private plantations.

Chart: Top 10 Net Importers of Wood Products. In 2017 the UK was the world’s second largest net importer of wood products.

A problem with this afforestation, however, was that it mostly consisted of monocultures of exotic species that were well suited to the climate, rather than regenerating native species. The modern UK Forestry Standard is countering this practice by putting in place requirements for afforestation and replanting that protect biodiversity, landscape and climate change, as well as soil and water.

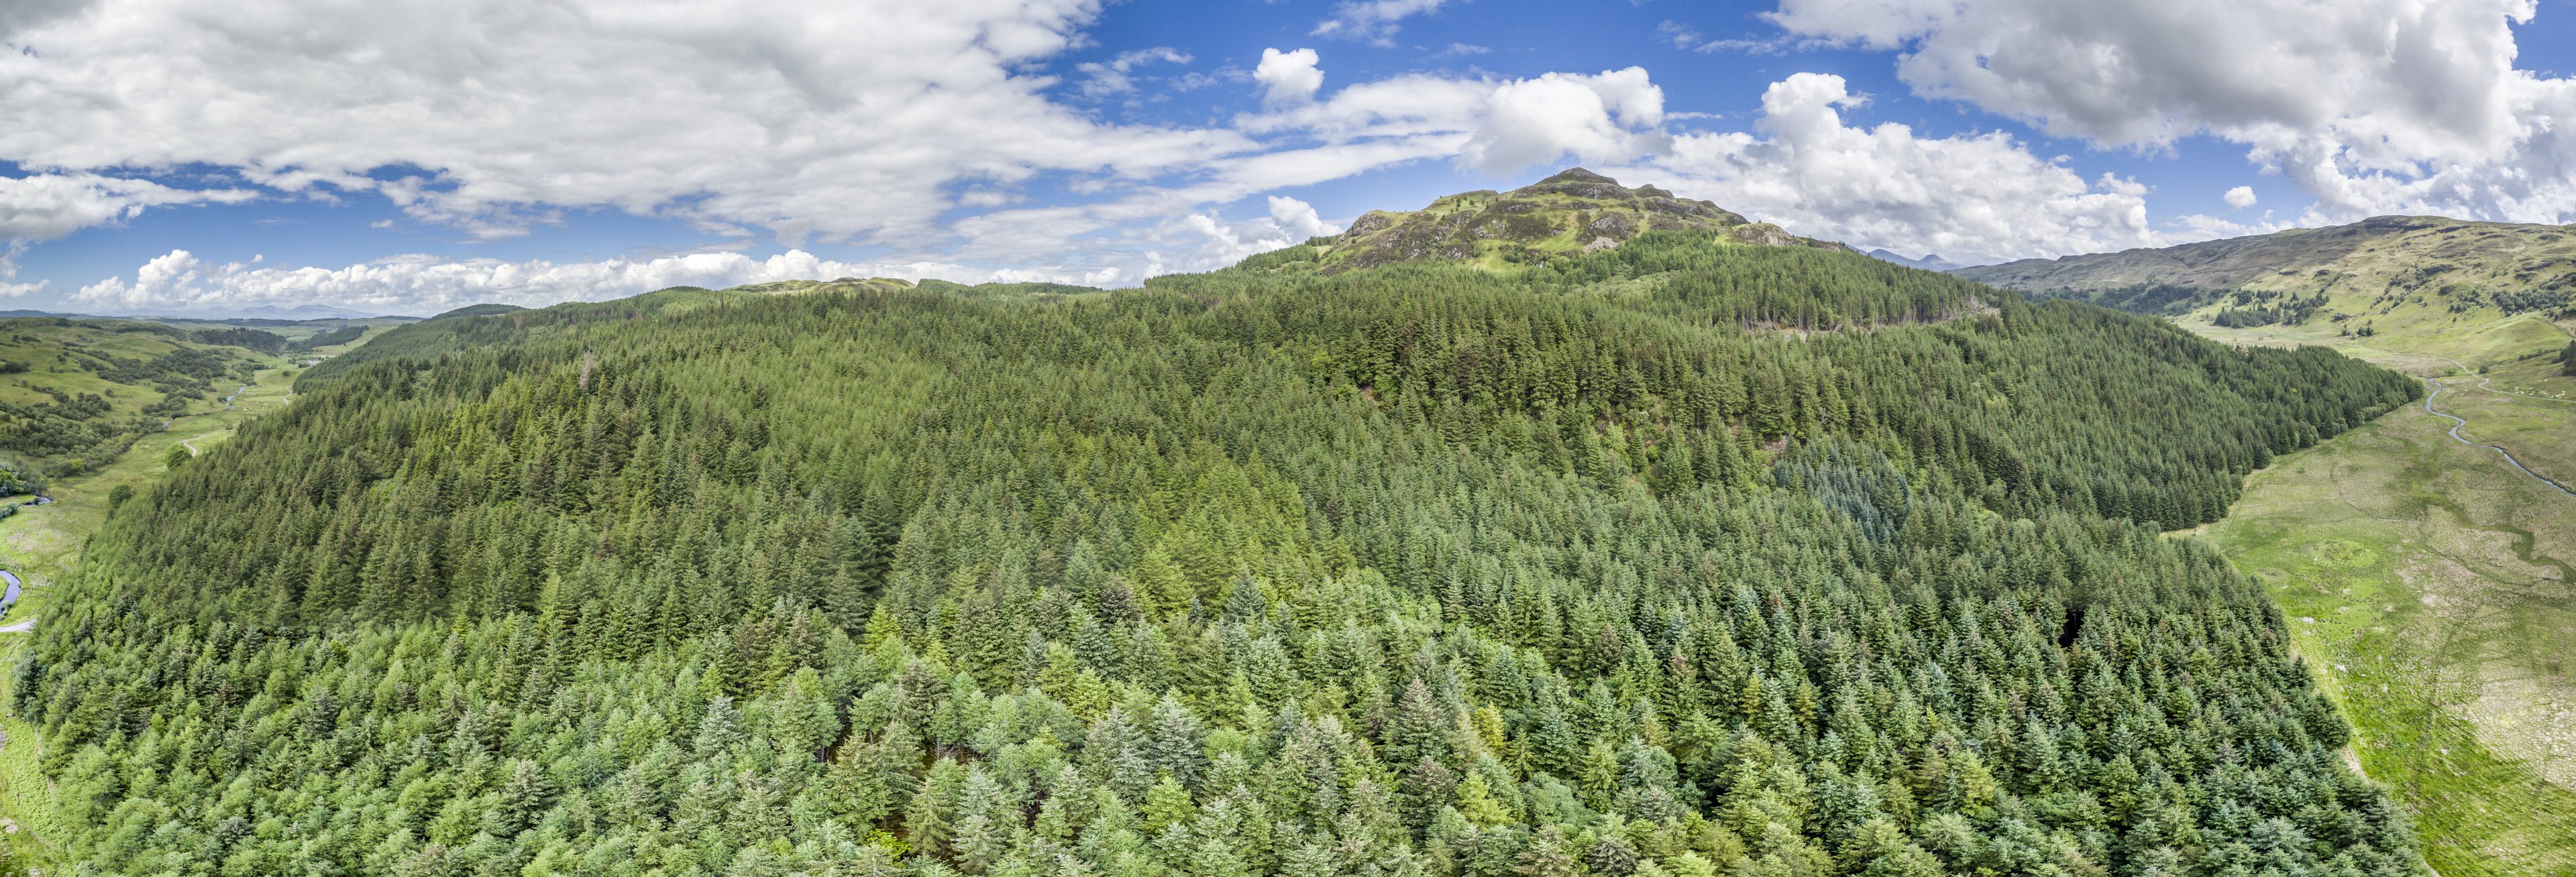
Forest in Argyll and Bute

Some 73% of the UK’s forests are privately owned, which includes historic estates and charitable trusts, as well as investment funds. Despite the increasing forest area in the UK over the past century, imports of both wood and wood products still make up almost 80% of the UK’s wood needs. The upside for the region is increased recreational and preserved historic forests.

Uruguay: Sustainably managing rapid expansion

Uruguay’s forestry industry is much younger than the likes of the US South or Finland, but offers an example of a how to rapidly expand the sector while preserving its ‘old growth’, or primary, forests.

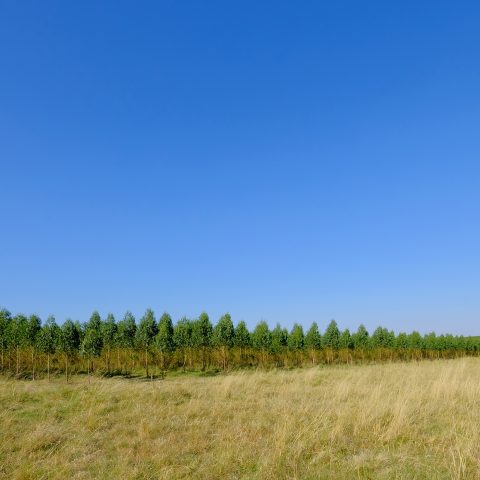
Eucalyptus trees in Uruguayan working forest

In 1975 the country introduced incentives such as tax waivers on forest operations and later subsidies for new plantations, as well as tax duties for timber exports. The result was a surge in eucalyptus plantations, which grew from 25,000 hectares in 1987 to more than 1 million hectares in 2015, largely driven by interest from international companies and investors. These plantations are currently managed sustainably, with growth still exceeding removals.

Eucalyptus is not a native species to Uruguay, but by allowing international investors to plant on land deemed of no agricultural or environmental value, the country has seen enormous afforestation while 800,000 hectares of native forests remain.

The economic impact is similarly impressive. Today forestry directly employees 15,000 people in Uruguay – 55% in forestry and logging and 45% in wood processing. The skills required to work in newly constructed mills has led to several courses in forestry and wood science at Uruguayan Universities.

Chart: Total forest area development in Uruguay

These four countries take different approaches to forestry but what they have in common is forest growth exceeding that removed through harvesting. It points to sustainable forest management as a means of growing forests and, in turn, carbon extracted and stored.

Read the full report by Dr. Hannes Lechner and Dr. Jack Lonsdale: Assessment of the benefits of sustainable forest management [PDF]