Tag: decarbonisation

How Great Britain’s breakthrough year for renewables could have powered the past

After a year of smashing renewable records, Great Britain’s electricity system is less dependent on fossil fuels than ever before. Over the course of 2017, low-carbon energy sources, including nuclear as well as renewables, accounted for half of all electricity production.

The finding comes from Electric Insights, a quarterly research paper on Britain’s power system, commissioned by Drax and written by researchers from Imperial College London. The latest report highlights how Great Britain’s electricity system is rapidly moving away from fossil fuels, with coal and gas dropping from 80% of the electricity mix in 2010 to 50% in 2017.

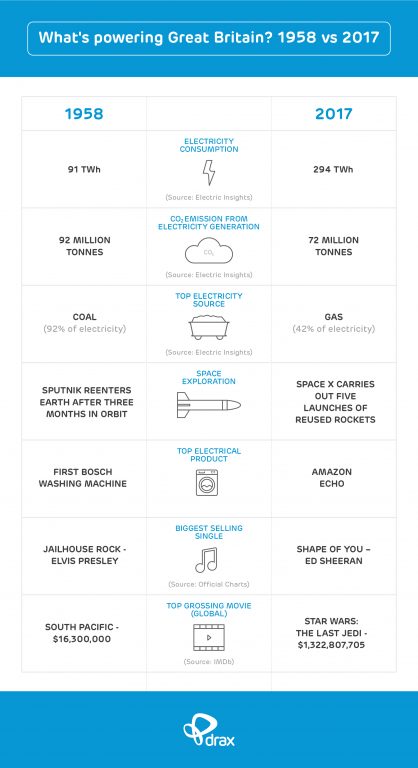
It’s an impressive change for eight years, but it’s even more dramatic when compared to 60 years ago.

Powering the past with renewables

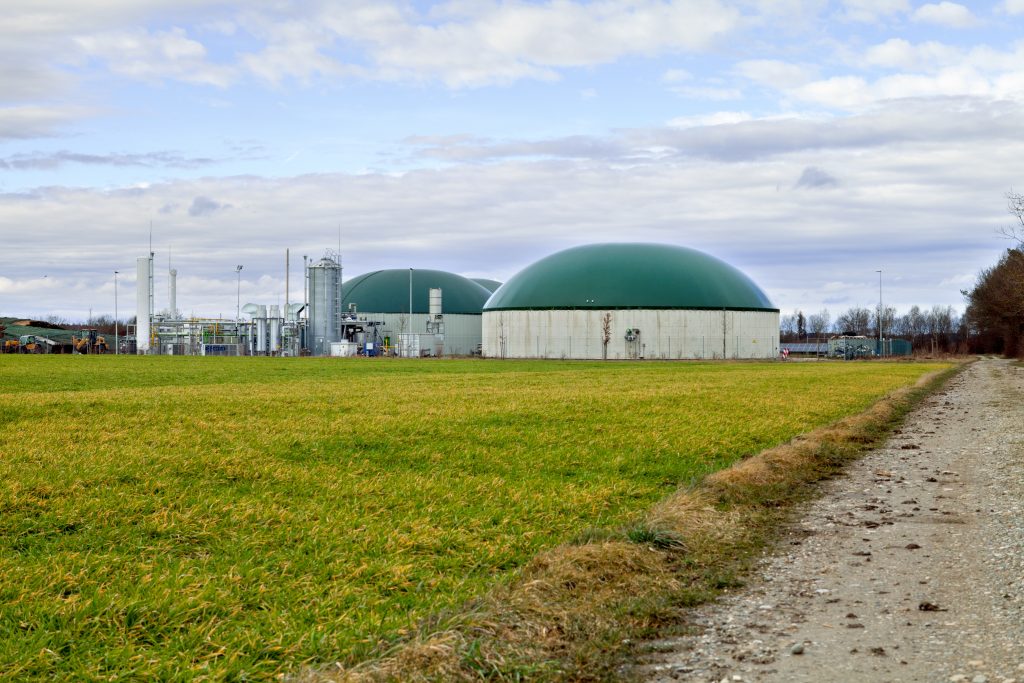
In 2017 renewable output grew 27% over 2016 and produced 96 terawatt hours (TWh) of electricity –  enough to power the entire country in 1958.

Back then Great Britain was dependent on one fuel: coal. It was the source of 92% of the country’s power and its high-carbon intensity meant emissions from electricity generation sat at 93 million tonnes of carbon dioxide (CO2). Compare that to just three million tonnes of CO2 emissions from roughly the same amount of power generated in 2017, just by renewables.     

Today the electricity system is much more diverse than in 1958. In fact, with nuclear added to renewable generation, 2017’s total low-carbon capacity produced enough power to fulfil the electricity needs of 1964’s Beatlemania Britain.

But what’s enabled this growth in renewable generation? One answer, as Bob Dylan explained a year earlier, is blowin’ in the wind.

Read the full article here: Powering the past.


Stormy weather powering Great Britain

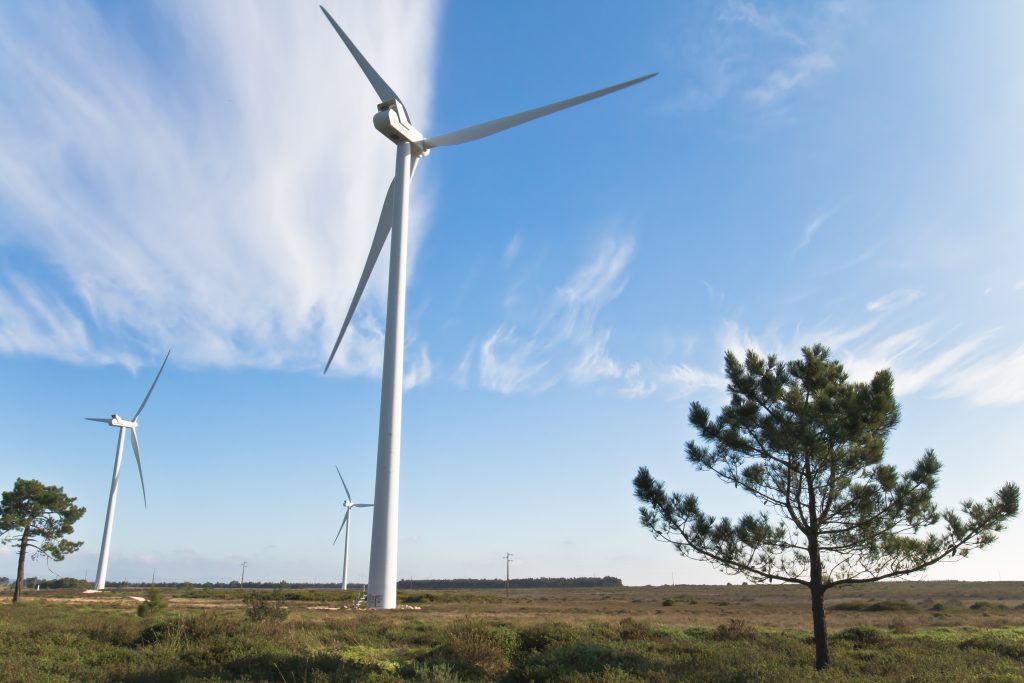
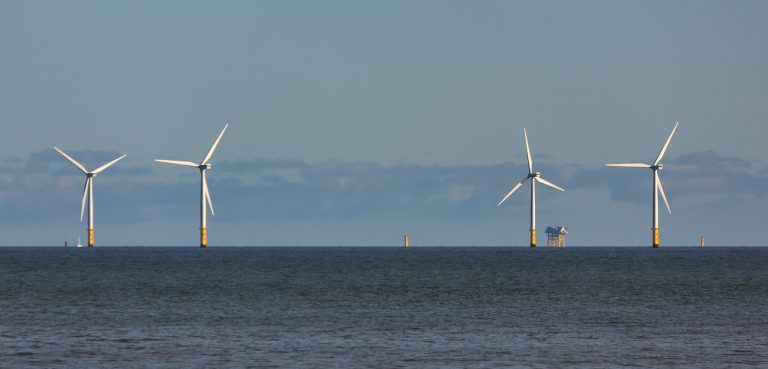
Wind power experienced a watershed year in 2017. Thanks to blusterier weather and a wave of new wind farm installations coming online, wind generation grew 45% between 2016 and 2017.

Windfarms, both onshore and offshore, produced 15% of the entire country’s electricity output in 2017, up from 10% in 2016. The 45 TWh it generated over the course of the year was almost double that of coal – and there’s potential for this to increase in 2018 as more capacity comes online.

The 1.6 gigawatts (GW) of new offshore wind turbines installed in Great Britain last year accounted for 53% of the net 3.15 GW installed across Europe. With large offshore farms at Dudgeon and Race Bank still being commissioned, the 3.2 GW of total new operating capacity registered in 2017 across offshore as well as onshore wind is on course to grow.

Co-author of the article, RenewableUK’s Head of External Affairs Luke Clark, said:

“These figures underline that renewables are central to our changing power system. Higher wind speeds and a jump in installed capacity drove a dramatic increase in the amount of clean power generated. Alongside breaking multiple records for peak output, wind energy continued to cut costs.”

As wind power is dependent on weather conditions, it is intermittent in its generation. But in 2017, more than one storm offered ideal conditions for wind turbines. During Q4 there were three named storms as well as the remnants of a hurricane all battering the British Isles, all of which helped push average wind speeds 5% higher than in 2016. While calculating wind power based on wind speed is complex, windier weather means more power – monthly average wind speed is proportional to monthly average power output from wind farms.

While the 2017 annual average wind speed of 10.1mph, was in line with the country’s long-term average, wind generation was not consistent across the year. In Q4 wind output was close to an average of 7 GW. By contrast, between May and August it was closer to 4 GW. Thankfully these calmer months saw longer hours of daylight, allowing solar power to compensate.

Read the full article here: Wind power grows 45%


Driving down carbon emissions

The knock-on effect of an increase in renewable generation is a drop in the carbon intensity of electricity production and in 2017 this reached a new low.

Across the year, carbon emissions, including those from imported sources, totalled 72 million tonnes, down 12% from 2016. This decrease is equal to 150 kg of CO2 saved per person, or taking 4.7 million cars off the roads. The least carbon intensive period of the quarter came just after midnight in the early hours of Monday 2 October, when it measured a record low of 56 grammes per kilowatt hour (g/kWh) thanks to low fossil fuel generation and high levels of renewables.

Over the whole year there were 139 hours when carbon intensity dipped below 100 g/kWh. This generally required 50% of the electricity mix to come from renewable sources and demand to be lower than 30 GW. For carbon intensity to dip under 100 g/kWh on a more permanent basis, greater renewable capacity will be required as demand rises.

Read the full article here: Carbon emissions down 12%


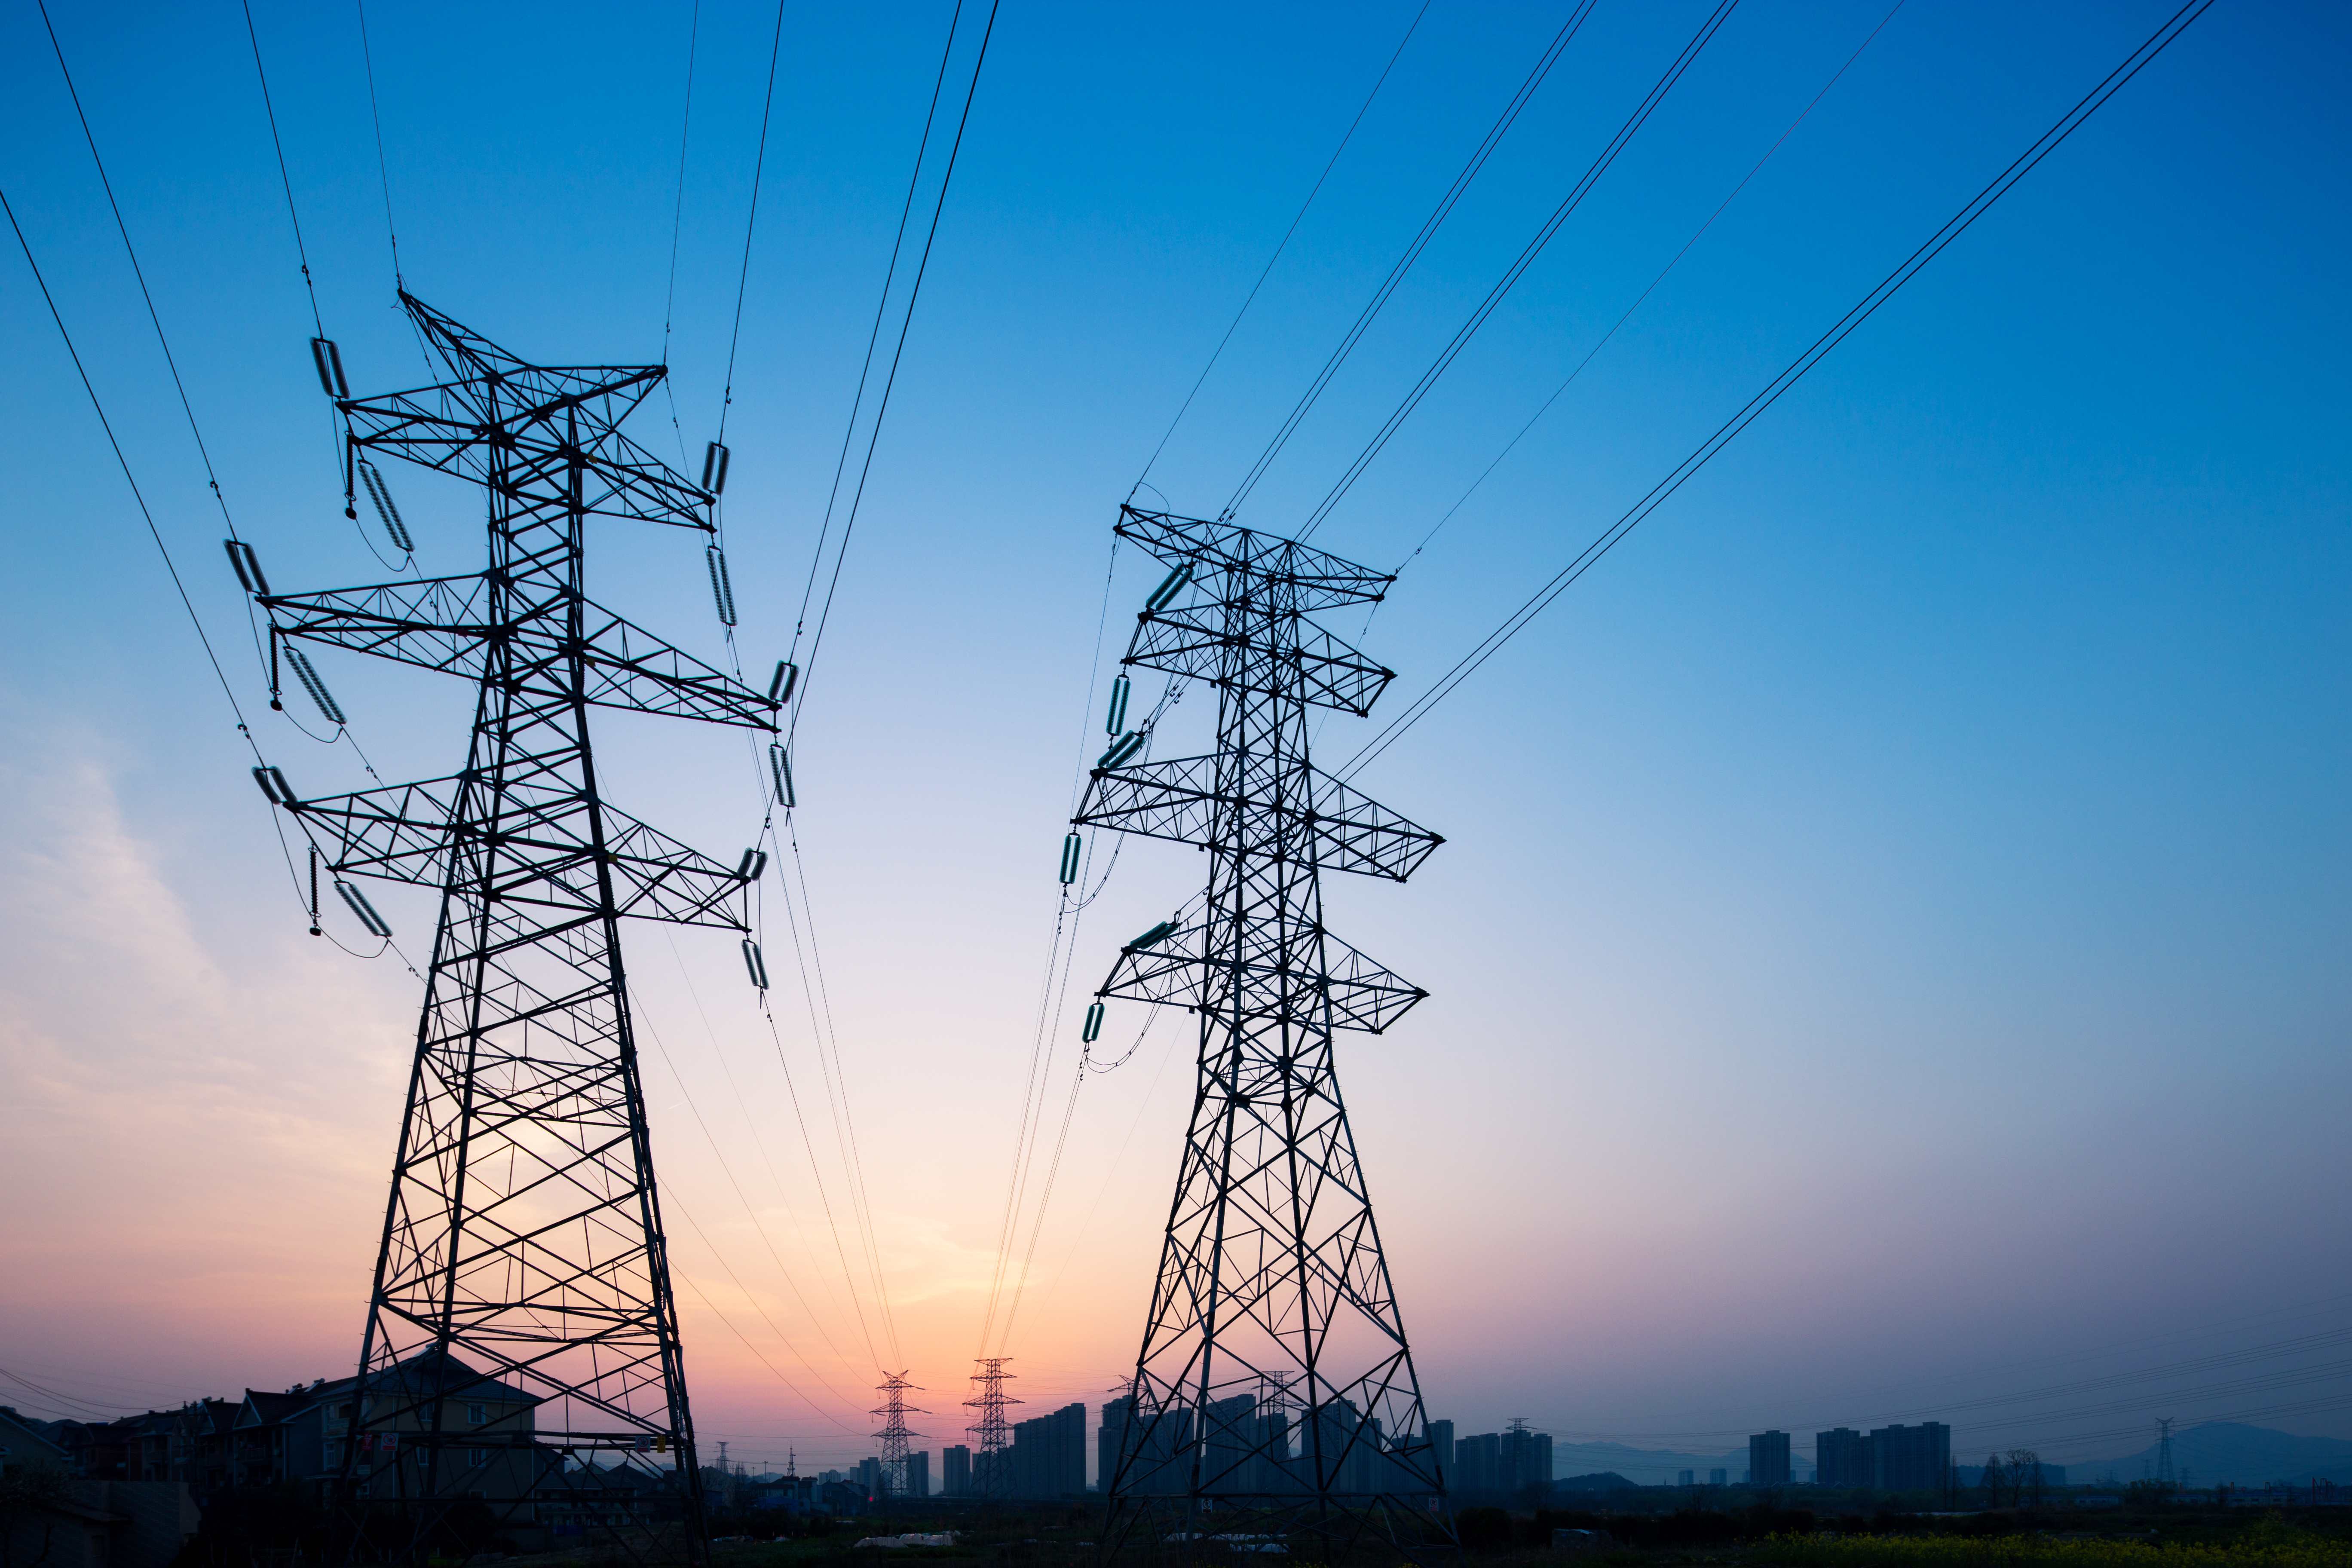
Interconnectors meeting future demand

Electricity demand in Great Britain has been on the decline since 2002, primarily due to more efficient buildings and appliances, and a decline in heavy manufacturing. However, this is expected to change over the coming years as more electric vehicles are introduced and the heating system is electrified to help meet 2050 carbon emissions targets.

While installing greater renewable capacity will be crucial in meeting this demand with low-carbon power, interconnectors will also play a significant role, particularly from France, which boasts a large nuclear (and low-carbon) capacity.

However, electricity sales through interconnectors are often based on day-ahead prices rather than the live market, which can lead to trades that aren’t reflective of demand on each sides of the channel.

In Q4 there were eight half-hours when demand was very high (more than 50 GW), yet power was being exported. This occurred despite day-ahead prices suggesting traders would lose money due to lower demand in France and the cost of using the interconnector. It highlights the need for improvements in inter-network trading as Great Britain increases its intermittent renewable generation and looks to a greater reliance on importing and exporting power.

Read the full article here: Moving electricity across the channel


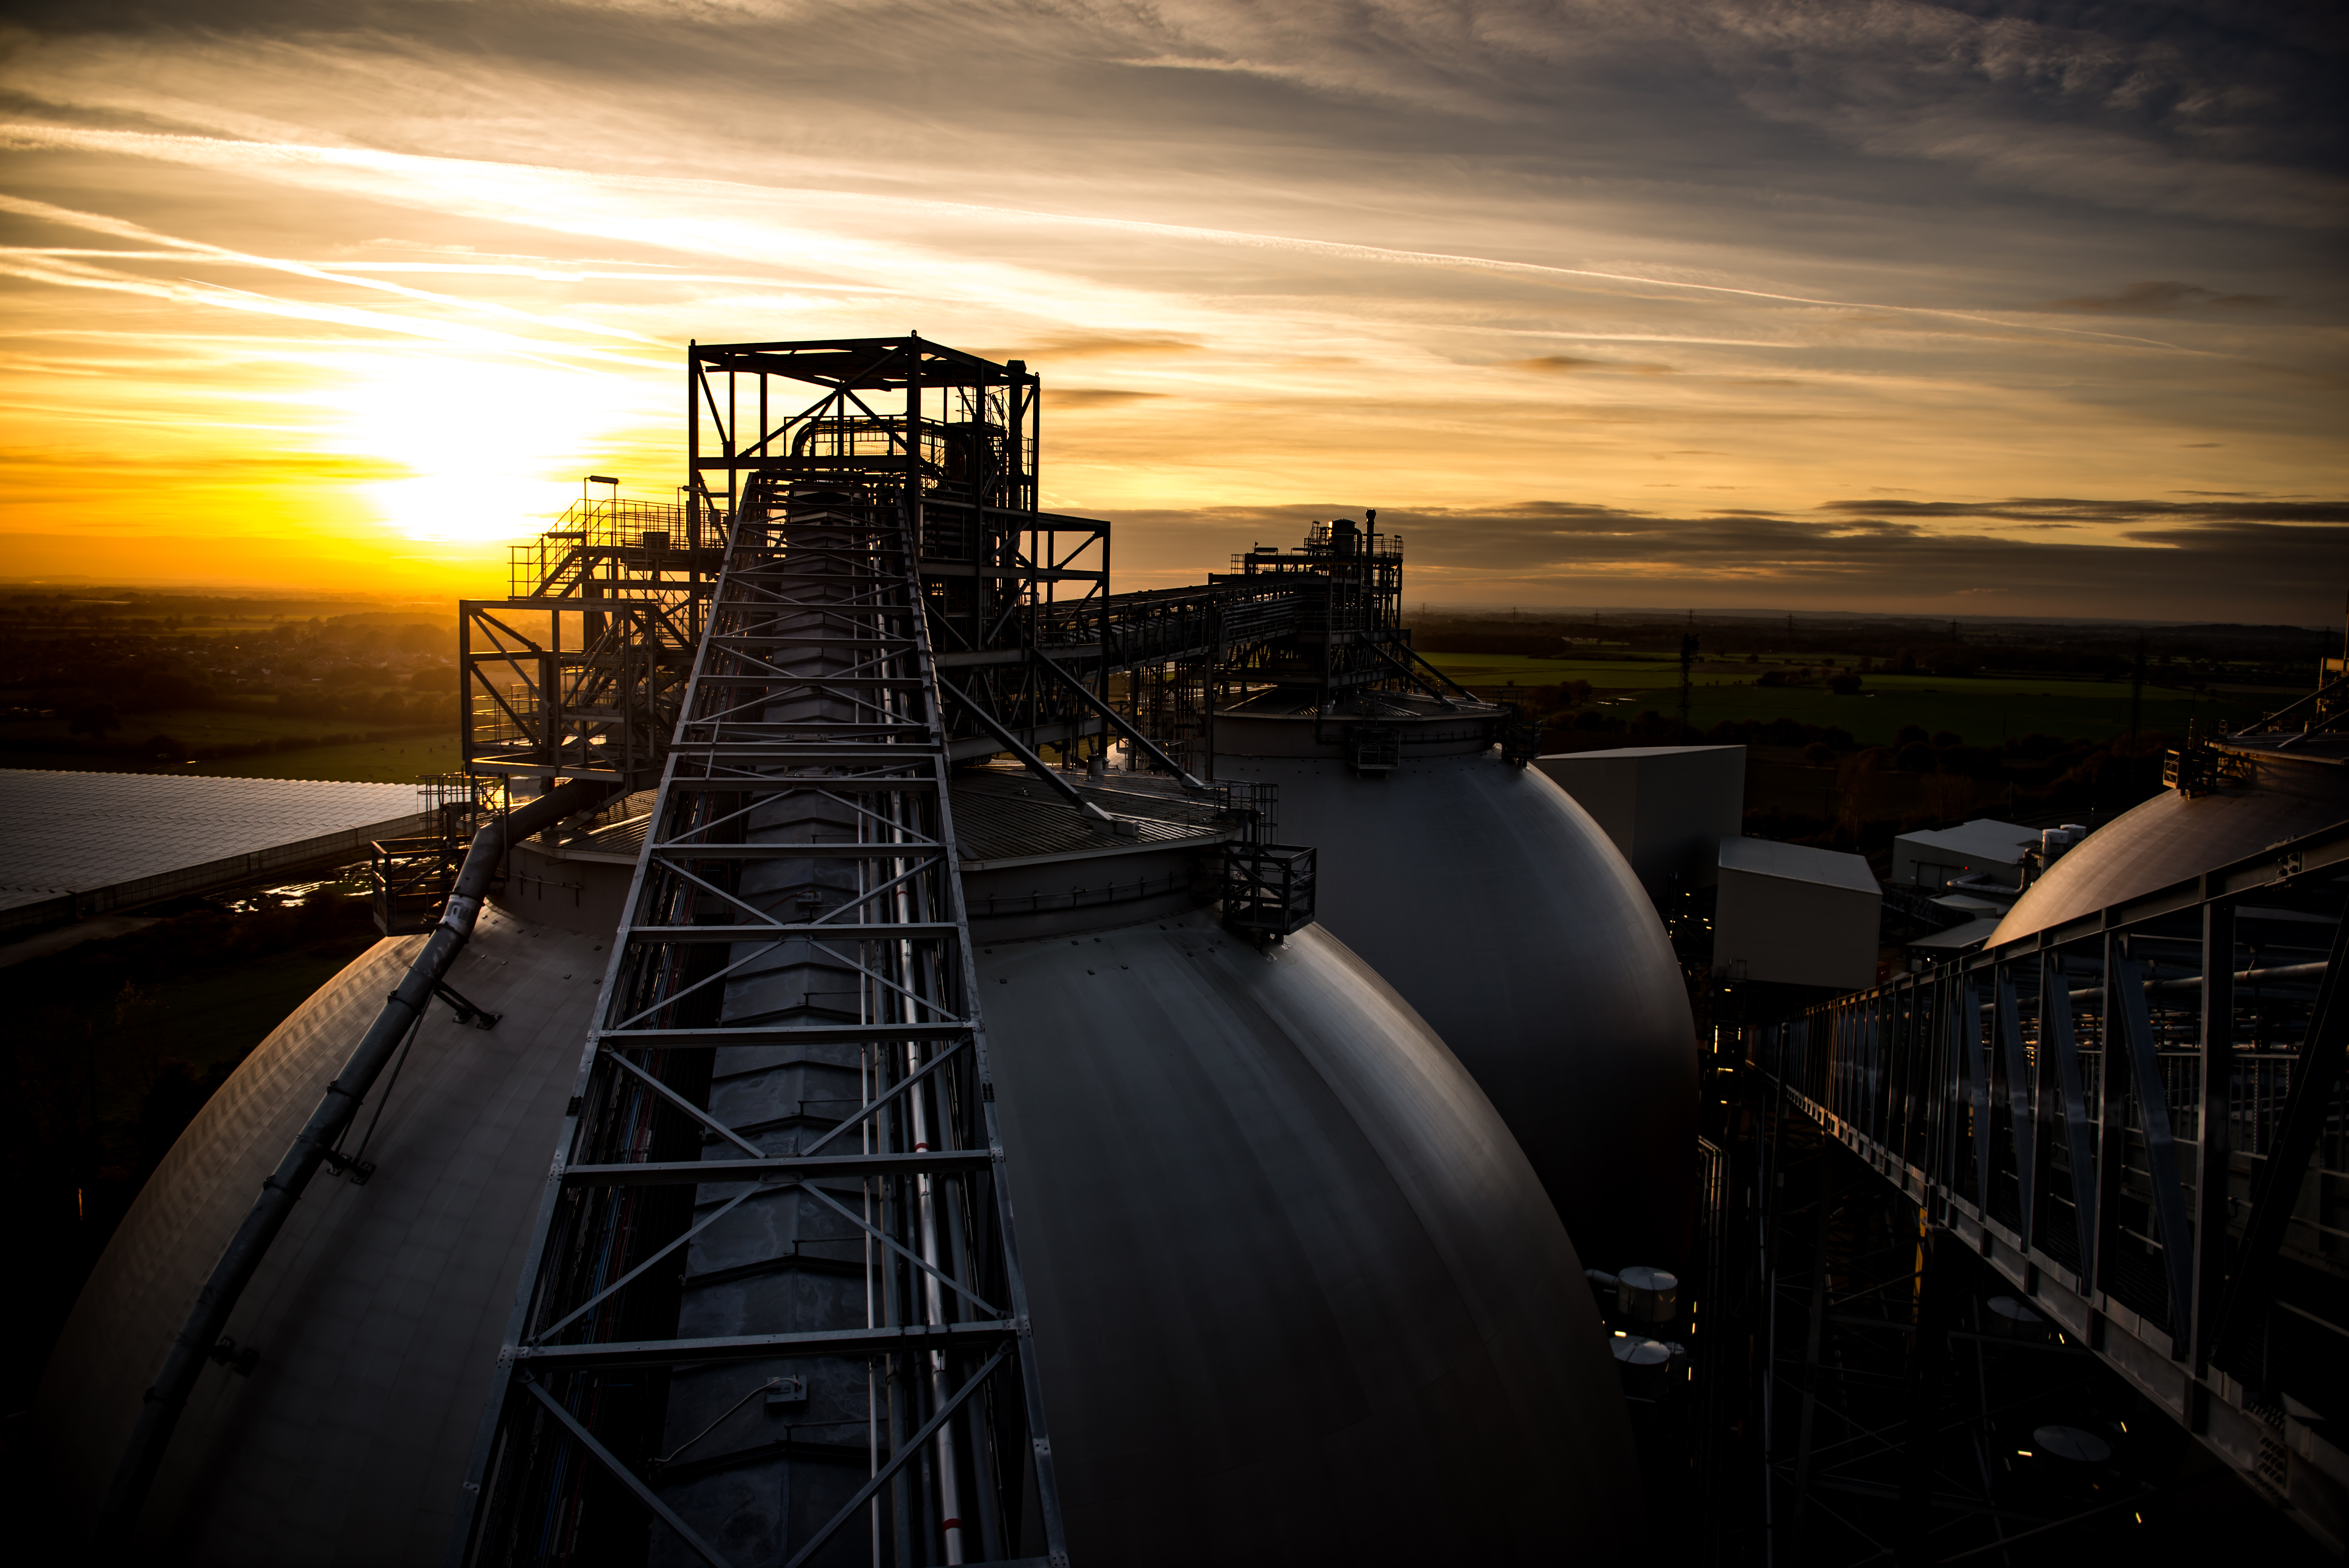
Great Britain’s electricity system continues to break its renewable records each year and heading into 2018 this is likely to continue. Wind and solar power will continue to grow as more installations come online and a fourth coal unit at Drax will be upgraded to sustainable biomass, which could lead to another breakthrough year. Regardless, 2017 will be a tough one to beat.

Explore the data in detail by visiting ElectricInsights.co.uk

Commissioned by Drax, Electric Insights is produced independently by a team of academics from Imperial College London, led by Dr Iain Staffell and facilitated by the College’s consultancy company – Imperial Consultants.

The wooden buildings of the future

Wooden building with blue sky background

When we think of modern cities and the buildings within them, we often think of the materials they’re constructed from – we think of the concrete jungle.

Since the 19th century, steel, glass and concrete enabled the building of bigger and more elaborate buildings in rapidly-growing cities, and those materials quickly came to define the structures themselves. But today that could be changing.

New technologies and building techniques mean wood, a material humans have used in construction for millennia, is making a comeback and reducing the carbon footprint of our buildings too.

Return of the treehouse

Civilisation has been building structures from wood for longer than you may realise.

Horyu-ji Temple in Nara, Japan

The 32-metre tall Pagoda of Horyu-Ji temple in Japan, was built using wood felled in 594 and still stands today. The Sakyumuni Pagoda of Fogong Temple in China is nearly twice as tall with a height of 67 metres. It was built in 1056.

Today, wood is once again finding favour.

The 30-metre tall Wood Innovation and Design Centre of the University of British Columbia (UNBC) in Canada was completed in October 2014 and is among the first of this new generation of wooden buildings. And they’re only getting bigger.

This year, the completion of the 84-metre, 24-storey HoHo Tower in Vienna will make it the tallest wooden building in the world. But this will be far surpassed if plans for the Oakwood Tower in London are approved. Designed by a private architecture firm and researchers from the University of Cambridge, the proposed building will be 300-metres tall if construction goes ahead, making it London’s second tallest structure after The Shard. And it would be made of wood.

Falling back in love with wood

Wood construction fell out of favour in the 19th century when materials like steel and concrete, became more readily available. But new developments in timber manufacturing are changing this.

Researchers in Graz, Austria, discovered that by gluing strips of wood with their grains at right angles to each other the relative weakness of each piece of wood is compensated. The result is a wood product known as cross-laminated timber (CLT), which is tougher than steel for its weight but is much lighter and can be machined into extremely precise shapes. Think of it as the plywood of the future, allowing construction workers to build bigger, quicker and lighter.

Glued laminated timber, commonly known as glulam, is another technology technique enabling greater use of wood in more complex construction. Manufactured by bonding high-strength timbers with waterproof adhesives, glulam can also be shaped into curves and arches, pushing wood’s usage beyond straight planks and beam.

These dense timbers don’t ignite easily either. They are designed to act more like logs than kindling, and feature an outer layer that is purposefully designed to char when exposed to flame, which in turn insulates the inner wood.

Susceptibility to mould, insect and water damage is indeed a concern of anyone building with wood, but as the centuries-old Pagodas in Japan and China demonstrate, care for wood properly and there’s no real limit to how long you can make it last.

So, wood is sturdy. But so is steel – why change?

Green giant

Construction with concrete and steel produces an enormous carbon footprint. Concrete production on its own accounts for 5% of all our carbon emissions. But building with wood can change that. UNBC’s Innovation and Design centre saved 400 tonnes of carbon by using wood instead of concrete and steel.

On top of that, building with wood ‘freezes’ the carbon captured by the trees as they grow. When trees die naturally in the forest they decompose and release the carbon they have absorbed during growth back in the atmosphere. But wood felled and used to construct a building has captured that carbon for as long as it stands in place. A city of wooden buildings could be a considerable carbon sink.

This can have further ripple effects. The more timber is required for construction, the more it increases the market for wood and the responsibly-managed forests that material comes from. And the more forests that are planted, and managed with proper governance, the more carbon is absorbed from the atmosphere.

According to research from Yale university, a worldwide switch to timber construction would, on its own, cut the building industry’s carbon emissions by 31%.

Granted, that will be a difficult task. But if even a fraction of that can be achieved, it could mean a future of timber buildings and greener cities.

Fourth biomass unit conversion

RNS Number : 1114C
Drax Group PLC

Drax welcomes the UK Government response to the consultation on cost control for further biomass conversions under the Renewable Obligation scheme, which will enable Drax to convert a fourth unit to biomass.

The response proposes that, rather than imposing a cap on ROC(1) support for any future biomass unit conversions, a cap would be applied at the power station level across all ROC(1) units. This would protect existing converted units and limit the amount of incremental ROCs attributable to additional unit conversions to 125,000 per annum.

The response would enable Drax to optimise its power generation from biomass across its three ROC units under the cap, whilst supporting the Government’s objective of controlling costs under the Renewable Obligation scheme.

Drax will now continue its work to deliver the low cost conversion of a fourth biomass unit, accelerating the removal of coal-fired generation from the UK electricity system, whilst supporting security of supply.

Drax plans to complete the work on this unit as part of a major planned outage in the second half of 2018, before returning to service in late 2018. The capital cost is significantly below the level of previous conversions, re-purposing the existing co-firing facility on site to deliver biomass to the unit.

The unit will likely operate with lower availability than the three existing converted units, but the intention is for it to run at periods of higher demand, which are often those of higher carbon intensity, allowing optimisation of ROC(1) generation across three ROC(1) accredited units. The CfD(2) unit remains unaffected.

Will Gardiner, Chief Executive of Drax Group, commented:

“We welcome the Government’s support for further sustainable biomass generation at Drax, which will allow us to accelerate the removal of coal from the electricity system, replacing it with flexible low carbon renewable electricity.”

“We look forward to implementing a cost-effective solution for our fourth biomass unit at Drax.”

Enquiries:

Investor Relations:

Mark Strafford

+44 (0) 1757 612 491

Media:

Ali Lewis

+44 (0) 1757 612 165


Website: www.drax.com/uk

Notes

  1. Renewable Obligation Certificate
  2. Contract for Difference

END


Do electric vehicles actually reduce carbon emissions?

Redcar Sunset

Electric vehicles (EVs) are often seen as a key driver towards a greener future. Indeed, transport accounts for roughly a quarter of the UK’s greenhouse gas emissions and seriously affects air quality in major cities.

To tackle pollution problems, governments around the world are implementing ambitious policies to promote the electrification of transport and phase out ICE (internal combustion engine) vehicles. The UK and France both plan to ban the sale of petrol- and diesel-only cars by 2040 while India is setting an even more ambitious end date of 2030.

Added to this are EVs’ growing popularity with drivers. There are now almost 110,000 electric cars and vans on UK roads spurred on by lowering battery costs and a growing range of models. Including plug-in hybrid vehicles, EVs now account for 2% of new registrations.

Switching to EVs is an obvious way to massively cut pollution in areas of dense traffic. But the question remains – how clean are EVs on the broader scale, when you look at the electricity used to charge them? 

Electric vehicle

Electric vehicles are getting cleaner

EVs don’t give off the same exhaust emissions as engines, but the power in their batteries has to come from somewhere. Follow the flow back from the car, through the charging point, all the way back to the power station and it’s likely some of that electricity is coming from fossil fuels. And that means emissions.

“They weren’t as green as you might think up until quite recently,” says Dr Iain Staffell, a researcher at Imperial College London and author of Electric Insights – a study commissioned by Drax that analyses electricity generation data in Britain. “Now, thanks to the rapid decarbonisation of electricity generation in the UK, EVs are delivering much better results,” he continues.

In fact, year-round average emissions from EVs have fallen by half in the last four years thanks to greener electricity generation. Today, they are twice as efficient as conventional cars.

Take the Tesla Model S. In the winter of 2012, producing the electricity for a full charge created 124g of carbon emissions per km driven, roughly the same as a 2L Range Rover Evoque. Now the carbon intensity of charging a Tesla has nearly halved to 74g/km in winter and 41 g/km in summer, as the UK continues to break its own renewable energy records. For smaller EVs, the results are even better. The Nissan Leaf and BMW i3 can now be charged for less than half the CO2 of even the cleanest non-plug-in EV, the Toyota Prius Hybrid.

Carbon intensity of electric vehicles

So, the current outlook for EVs is hugely positive – but as their numbers continue to increase, will the demand they add to the grid put their clean credentials at risk?

Will EVs accelerate electricity demand?

The National Grid suggests there could be as many as nine million EVs on UK roads by 2030, which could lead to an additional 4-10 GW of demand on the system at peak times. This, in some cases, could lead to a rise in emissions.

Electricity demand in Britain typically peaks between 6pm and 10pm, when people arrive home and switch on lights and appliances. If you were to charge your EV between those evening hours, the emissions would be 8% higher than reported in the chart above. If you charged between midnight and 6am, they would be 10% lower.

Today, this demand is met by the existing mix of power stations (which last quarter included more than 50% renewable and low-carbon sources). But when there are sudden spikes in demand above this typical usage, the National Grid must call in the help of carbon-intensive reserve generators, such as coal-powered stations. Polluting diesel generators are also on standby around the UK, ready to turn on and feed into regional distribution grids at a moment’s notice.

To meet the challenge of peak-time EV charging, less carbon intensive power generation, storage and smart power management systems are needed. These include rapid response gas power stations such as the four Drax OCGTs planned to come online in the early 2020s, as well as grid-scale batteries, home-based batteries and demand-side response schemes. As the share of intermittent renewable capacity on the grid increases, more back-up power needs to be available for when the wind doesn’t blow and the sun doesn’t shine.

Keeping our future fuels clean

A future increasingly relying on back-up generators is far from inevitable, especially if the use of smart technology and smart meters increases. By analysing electricity costs and country-wide demand, smart meters have the potential to ensure EVs only charge outside peak times (unless absolutely necessary), when electricity is more likely to come from renewable or low-carbon and cheaper sources.

If the grid continues to decarbonise through advances in renewable technologies and lower-cost coal-to-biomass conversions, the potential of EVs’ electricity coming with associated emissions is diminished even further.

There is no doubt that EVs will make up a significant part in the future of our mobility. That they will also play a part in the future of cleaning up that mobility is as good as assured, but on this journey, it’s imperative we keep our eyes on the road.

Commissioned by Drax, Electric Insights is produced independently by a team of academics from Imperial College London, led by Dr Iain Staffell and facilitated by the College’s consultancy company – Imperial Consultants.

What you need to know about Britain’s electricity last quarter

Drax EI header

For an hour over lunch on Wednesday, 7th June, more than 50% of Britain’s electricity came from renewables. It was only the second time this had ever happened – the first had come just two months earlier, in April.

The second quarter (Q2) of 2017 was a period largely made up of firsts for Britain’s electricity system. While there were only two instances of renewable power tipping the 50% mark between April and June, overall, wind, solar, biomass and hydro energy made up more than a quarter of all Britain’s electricity for the first time ever.

These findings come from Electric Insights, research on Britain’s power system, commissioned by Drax and written by top university academics. Over the past year, the quarterly report has shown breaking renewable records is becoming the new normal for Britain’s electricity. Last quarter was no different.

Here, we look at the key findings from Q2 2017 and what they mean for the changing nature of the energy sector.

Daily electricity generation graph

More than half Great Britain’s electricity came from renewables. Twice

Wind, solar, biomass and hydro accounted for 51.5% of the UK’s electricity for an hour on 7th June, generating 19.1 gigawatts (GW). Combined with nuclear power and imports from France, low-carbon output was a record 28.6 GW – a massive 89% of total demand. This followed 30th April, when Britain’s electricity edged over the 50% renewable mark for a shorter, but no less significant, period.

The percentage of renewables making up our power supply is set to grow as additional renewable capacity comes onto the grid. There is currently 6 GW of additional wind capacity being constructed in Britain. Solar capacity has already hit 12.4 GW – more solar panels than analysts thought would be installed by 2050. Plans to convert more of Britain’s coal units to biomass will increase the availability of renewable power further, still.

25% electricity infographic

Electricity was cleaner than ever

There was a key date in the history of coal during Q2. On 21st April, Britain recorded the first full day it had gone without burning any coal since 1882 – the year Holborn Viaduct power station became the world’s first coal-fired public electricity station.

While that date is symbolic of the UK’s shift away from coal, in practice, it means carbon emissions are also dropping to historically low levels. Carbon intensity reached a new low in Q2, averaging 199 g/kWh over the quarter – 10% lower than the previous minimum set last year. For context, carbon intensity averaged 740 g/kWh in the 1980s and 500 g/kWh in the 2000s.

An important indicator of this falling carbon intensity is that Britain’s electricity now regularly drops below 100 g/kWh, and reached an all-time low of 71 g/kWh on the sunny and windy Sunday of 11th June.

100,000 electric vehicles infographic

Electric cars are cleaner than before

One of the greatest decarbonisation challenges moving forward is how we transform transport. Electrification is the primary driver of change in this sector, and Q2 saw Britain hit a significant milestone as the total number of electric vehicles (EVs) in the country surpassed 100,000.

The potential of EVs in cleaning up transport is significant, but there are also concerns they could, in some cases, increase CO2 levels due to pollution from power stations. However, as the last quarter’s data shows, EVs are in fact twice as carbon efficient as conventional cars thanks to the amount of renewable and low carbon electricity on the system.

“According to our analysis, looking at a few of the most popular models, EVs weren’t as green as you might think up until quite recently,” says Dr Iain Staffell From Imperial College London. “But now, thanks to the rapid decarbonisation of electricity generation in the UK they are delivering much better results.”

25% solar infographic

The most solar power a quarter has ever seen

The longer days in Q2 enabled solar power to become a key source of electricity, and for eight hours over the quarter it generated more than all fossil fuels combined. It also set output records by supplying 25% of total demand on 8th April, and producing 8.91 GW on 26th May.

While wind remains the largest source of renewable energy generation in the UK, solar’s influence is growing – especially as decentralisation of the power system continues to proliferate.

Of Britain’s 12.4 GW solar capacity, 57% is concentrated in 1,400 solar farms of around 5 MW each, while the rest is distributed across almost one million rooftop arrays in homes, businesses and other institutions. In fact, during June, 10% of all Britain’s electricity came from these sorts of decentralised sources – sources of power not on the national grid.

This is unlikely to spell a fundamental shift to an entirely decentralised power grid in the short term, but it does hint at the changes the sector is seeing. From its carbon profile, to its variety, to its flexibility, Britain’s power system is changing – and that’s a good thing.

10% decentralised energy infographic

Explore the data in detail by visiting ElectricInsights.co.uk

Commissioned by Drax, Electric Insights is produced independently by a team of academics from Imperial College London, led by Dr Iain Staffell and facilitated by the College’s consultancy company – Imperial Consultants.

A flexible energy future

Renewable technologies now account for a larger proportion of Great Britain’s electricity sources than ever before. And they’re growing.

The first quarter of 2017 was another record-breaking one for renewables. Biomass, wind and hydro all registered their highest energy production ever, while solar recorded its highest ever peak output. Drax’s own generation is now 68% renewable and accounted for 17% of the country’s overall renewable generation in the first half of 2017 – enough to power over four million homes.

We’ve made great progress over a relatively short period. However, with every step forward we need to ensure our approach is helping enhance stability. In a power system increasingly made up of intermittent renewables, what will become more and more important for security of electricity supply will be technologies that respond quickly to spikes in demand and drops in supply – for example, when the sun isn’t shining and the wind isn’t blowing.

In short, what the power system of today needs is flexibility.

 The flexibility factor

A recent report by Imperial College London for the Committee on Climate Change (CCC) highlights the significance of increasing system-wide flexibility in achieving decarbonisation. Imperial’s analysis emphasises the cost savings this can have, projecting that flexibility in a 50 g/kWh system – the lower-end of the CCC’s 2030 target for a decarbonised system – could save between £7.1 billion and £8.1 billion a year in system integration costs.

Without flexibility, the costs of balancing the system will rise significantly. This, in turn, could lead to the current fast-pace of grid decarbonisation stalling.

The need for flexibility in our energy system is too financially and environmentally significant to ignore. But what sources and technologies will we need to create it?

The next big thing in system flexibility

There are a number of technologies that are often touted as key to a flexible system, including storage (principally batteries), interconnectors, rapid response gas plants, renewable technologies such as biomass, and demand side response. All are indeed crucial to a flexible future, but alone each one still has its challenges.

Millions of pounds are being invested in battery and storage research – both in the ambition of driving down costs and in increasing capacity. However, there is a way to go on both fronts. For example, consider the scale at which batteries must operate.

The storage domes at Drax Power Station hold up to 300 kt of wood pellets – enough to generate roughly 600 GWh of electricity. At the current battery prices of around £350 per kWh it would cost £210 billion to replace their capacity with batteries. Even if prices fell dramatically we are still talking about a £60 billion price tag.

Greater interconnection is something energy industry regulator Ofgem and the National Infrastructure Commission (NIC) are calling for, but National Grid has voiced concerns that wholesale market price swings could lead to changes in power flows across interconnectors. This, in turn, could impact Great Britain’s system.

However, they remain a potential solution to solving flexibility, not just for their ability to deliver power, but in their ability to deliver ancillary services – something which will become increasingly important in a more volatile power system. For example, if built, Hinkley Point C will have some of the biggest single units on the system (1,600 MW), which will create more demand for ancillary services such as frequency response.

Technologies such as biomass and gas are well placed to provide this as well as quickly respond to changes in demand and supply. They also highlight why it is important to consider each megawatt coming onto the system. Not all technologies offer electricity and system stability tools (ancillary services), and so each one should be assessed from a whole system cost perspective, and according to how they fit into the overall supply mix.

Each type of generation can bring diverse services, so to achieve true flexibility we can’t rely on one technology – instead, we will need to rely on many.

Better together

To achieve full system flexibility we will need a coordinated combination of sources. This means maintaining a stable system that includes increasing levels of intermittent renewables, and flexible generation sources like biomass and gas that will supply baseload megawatts, plug the gaps left by intermittent renewables, and provide ancillary services.

The four rapid response gas power plants we are developing will play a key role once they are consented, secure Capacity Market contracts and become operational in the early 2020s. They will be crucial to plugging gaps in power supply as a result of unfavourable weather conditions.

Creating a system that is sufficiently flexible will make Britain much more effective in responding to stresses such as very low wind speeds over several hours, unexpected power station unit outages, or high demand. More than this, it will keep us on track to meeting carbon-reduction challenges.

For an affordable, decarbonised power system we need to be stable. To be stable we need to be flexible. And to be flexible we need to be varied and we need to work together.

How quickly will these countries reach their climate targets?

It was no surprise when President Donald Trump echoed his election campaign stance and announced his intention to renegotiate – or failing that withdraw the US – from the Paris Agreement on Climate Change. It raised the question, would other countries back away from their own climate change targets?

In fact, many reaffirmed their commitment to the pact and continue their progress towards becoming low carbon economies. For those in the European Union, this means meeting the 2030 climate and energy framework, which sets three key targets for member states: cut greenhouse gas (GHG) emissions by at least 40% from 1990 levels, produce at least 27% of their energy through renewable sources, and improve energy efficiency by at least 27%.

Many countries across Europe, however, have set climate objectives that go beyond these. Whether they can meet those goals is another matter.

Portugal

What are its climate targets?

The Portuguese government has pressed the EU to go further than its 2030 targets and is aiming for 40% of total energy consumption to come from renewables by 2030. This target is part of its Green Growth Commitment 2030, which also sets out to create more green – or low carbon economy – jobs and improve overall energy efficiency across the country.

How is it achieving this?

Portugal has rapidly increased its renewable energy production by investing in wind (mainly onshore) and hydro power, although it is rapidly developing its solar capabilities. It is also looking at small scale renewable energy generation through wave, thermal and biomass power.

Portugal has two operational coal plants that together are responsible for 16% of the country’s carbon emissions. However, the government is seeking to phase these out prior to 2025.

How is it doing so far?

The growth in renewable energy within the power industry specifically has been a big success story for Portugal. In 2005, renewables accounted for only 16% of total electricity production – by 2015 they produced an average of 52%.

The country made headlines in May 2016 for running on 100% renewable electricity for four days in a row. Unsurprisingly, this means the government is confident of achieving a target of 31% renewables in gross final energy consumption by 2020, which would mean 57.4% renewable electricity generation.

Germany

What are its climate targets?

Germany set its current climate targets as far back as 2007. It subsequently agreed to the Paris Agreement and the EU’s 2014 climate and energy framework.

Added to this, the country has its own ambitious aims for 2050: cut GHG emissions by up to 95% compared to 1990 levels (with an interim target of 40% by 2020), increase the share of renewables in gross final energy consumption to 60%, and increase all electricity generated from renewables to 80%.

How does it plan to achieve this?

Germany’s Climate Action Programme 2020 and Climate Action Plan 2050, set out its plans for reducing GHG emissions. Much of this is based around the Energiewende (energy transition), a strategy that will see the country phase-out nuclear power and decarbonise the economy through renewable energy initiatives.

According to these plans, Germany’s energy supply must be almost completely decarbonised by 2050, with coal power slowly phased out and replaced with renewables, especially wind power. The utilisation of biomass will be limited and sourced mostly from waste. It also stresses the role of the European Union Emission Trading System to meet targets.

How is it doing so far?

Between 1990 and 2015, emissions reduced by 27%. In 2015, the share of renewable sources in German domestic power consumption amounted to 31.6%.

However, German energy-related CO₂ emissions rose almost 1% in 2016, despite a fall in coal use and the ongoing expansion of renewable energy sources. This rise is due in part to an overall increase in energy consumption and an increase in natural gas use and diesel for electricity, heat and transport.

Projections from the environment ministry in September 2016 indicated that Germany will likely miss its 2020 climate target.

UK

What are its climate targets?

Alongside its EU and Paris commitments, the UK Houses of Parliament approved the Climate Change Act in 2008, which commits to reducing GHG emissions by at least 80% of 1990 levels by 2050.

The Act requires the government to set legally-binding carbon budgets, a cap on the amount of GHG emitted in the UK over a five-year period. The first five carbon budgets have been put into legislation and will run up to 2032. These include reducing emissions 37% below 1990 levels by 2020 and 57% by 2030.

A key milestone in the UK’s decarbonisation is to entirely phase out coal by 2025, which will mean either closing or converting (as in the case of Drax Power Station) existing coal power stations.

How does it plan to achieve this?

Under its legally binding carbon budget system, every tonne of GHG emitted between now and 2050 will count. Where emissions rise in one sector of the economy (be it agriculture, heavy industry, power, transport, etc.), the UK must achieve corresponding falls in another.

The UK’s initial focus has been to transition to renewable electricity production. Wind, biomass and solar power have all grown significantly, aided by government support, and by initiatives like the carbon price floor.

How is it doing so far?

The UK’s progress towards its targets is positive, but leaves room for improvement. Renewables generated 14.9% of the UK’s electricity in 2013. In 2015 they accounted for nearly a quarter of electricity generation and by 2016, low carbon power sources contributed an average of 40% of the UK’s power, with wind generating more power than coal for the first time ever.

The Department for Business, Energy and Industrial Strategy estimates that as of 2016 GHG emissions fell 42% since 1990. Despite this, the Committee on Climate Change (CCC) has said that the government is not on track to meet its pledge of cutting emissions 80% by 2050.

However, it points out the UK is likely to meet the target of making electricity almost entirely low-carbon by early 2030s, but only if further steps are taken such as including increasing investment in more low-carbon generation (such as biomass), and developing carbon capture and storage (CCS) technologies. The UK government is due to publish an emissions reduction plan in the autumn of 2017. 

Norway

What are its climate targets?

Norway’s climate policy is based on agreements reached in the Storting (the Norwegian Parliament) in 2008 and 2012. They stipulate a commitment to reduce global GHG emissions by at least 30% by 2020 from 1990 levels. The government also approved the goal of achieving carbon neutrality by 2050.

As well as signing the Paris Agreement, Norway has aligned itself with the European Union’s climate target and intends to fulfil its commitment collectively with the EU (of which it is not a member state). This means using the EU emissions trading market, international cooperation on emissions reductions, and project-based cooperation.

How does it plan to achieve this?

Around 98% of Norway’s electricity production already comes from renewable energy sources, mostly through its more than 900 hydropower plants. The remainder is through wind and thermal power.

Norway exports hydropower to the Netherlands and exchanges renewable energy with Denmark, Sweden and Finland. There are plans for similar green exchanges with Germany and the United Kingdom via interconnectors within the next five years.

Norway is also aided by a substantial carbon sink in its forests which cover 30% of its land surface. They sequester (absorb and store) carbon from the atmosphere to such an extent that it equals approximately half of the Scandinavian country’s annual emissions.

How is it doing so far?

While Norway already has one of the world’s most carbon neutral electricity sectors, its significant domestic oil and gas sector means it still struggles to reduce its overall emissions. As such, the government is expected to rely on carbon trading with the EU or international offsets to meet its ambitious goals.

Nonetheless, earlier this year the government said that GHG emissions will fall to around 1990 levels by 2020, although it did not stipulate whether this included buying carbon credits from abroad or not.

3 ways decarbonisation could change the world

Mitigating climate change is a difficult challenge. But it’s one well within the grasp of governments, companies and individuals around the world if we can start thinking strategically.

On the behalf of the German government, The Internal Energy Agency (IEA) and the International Renewable Energy Agency (IRENA) have jointly published a report outlining the long-term targets of a worldwide decarbonisation process, and how those targets can be achieved through long-term investment and policy strategies.

At the heart of the report is a commitment to the ‘66% two degrees Celsius scenario’, which the report defines as, ‘limiting the rise in global mean temperature to two degrees Celsius by 2100 with a probability of 66%’. This is in line with the Paris Agreement, which agreed on limiting global average temperature increase to below two degrees Celsius.

Here are three of the findings from the report that highlight how decarbonisation could change the world.

The energy landscape will change – and that’s a good thing

Decarbonisation will by definition mean reducing the use of carbon-intensive fossil fuels. Today, 81% of the world’s power is generated by fossil fuels. But by 2050, that will need to come down to 39% to meet the 66% two degrees Celsius scenario, according to the report. But, this doesn’t mean all fossil fuels will be treated equally.

Coal will be the most extensively reduced, while other fossil fuels will be less affected. Oil use in 2050 is expected to stand at 45% of today’s levels, but will likely still feature in the energy landscape due its use in industries like petrochemicals.

Gas will likely also remain a key part of the energy makeup, thanks to its ability to provide auxiliary grid functions like frequency response and black-starting in the event of grid failure.

Renewables like biomass will likely play an increasing role here as well, particularly when combined with carbon capture and storage (CCS) technology.

Overall, renewable energy sources will need to increase substantially. In the report’s global roadmap for the future, renewables make up two thirds of the primary energy supply. Reaching this figure will be no mean feat – it will mean renewable growth rates doubling compared with today.

Everyday electricity use will become more efficient 

The report highlights the need for ‘end-use’ behaviour to change. This can mean everyday energy users choosing to use a bit less heat, power and fuel for transport in our day-to-day activities, but a bigger driver of change will be by investment in better, more efficient end-use technology – the technology, devices and household appliances we use every day.

In fact, the study argues that net investment in energy supply doesn’t need to increase beyond today’s level – what needs to increase is investment in these technologies. For instance, by 2050, 70% of new cars must be electric cars to meet decarbonisation targets.

Infrastructure design could also be improved for energy efficiency – smart grids, battery storage and buildings retrofitted with energy efficient features such as LED lighting will be essential. There’s also the possibility of increased use of cleaner building materials and processes – for example, constructing large scale buildings out of wood rather than carbon-intensive materials such as concrete and steel.

Decarbonisation will cost, but not decarbonising will cost more

The upfront costs of meeting temperature targets will be substantial. A case study used in the report estimates that $119 trillion would need to be spent on low-carbon technologies between 2015 and 2050. But it also suggests another $29 trillion may be needed to meet targets.

However, failure to act could mean the world will pay out an even higher figure in healthcare costs, or in other economic costs associated with climate change, such as flood damage or drought. Therefore, the sum for decarbonisation could end up costing between two and six times less than what failing to decarbonise could cost.

On top of this, the new jobs (including those in renewable fuel industries that will replace those lost in fossil fuels) and opportunities that will be created between 2015 and 2050 could add $19 trillion to the global economy. More than that, global GDP could be increased by 0.8% in 2050, thanks to added stimulus from the low carbon economy.

Achieving a cleaner future won’t be easy – it requires planning, effort, and the will to see beyond short-term goals and think about the long-term benefits. But as the report demonstrates, get it right and the results could be considerable.

Everything you ever wanted to know about cooling towers

Close up image of Drax cooling tower

Cooling towers aren’t beautiful buildings in the traditional sense, but it’s undeniable they are icons of 20th century architecture. They’re a ubiquitous part of our landscape – each one a reminder of our industrial heritage.

Yet despite the familiarity we have with them, knowledge about what a cooling tower actually does remains limited. A common misconception is that they release pollution. In fact, what they actually release is water vapour – similar to, but nowhere near as hot, as the steam coming out of your kettle every morning. And this probably isn’t the only thing you never knew about cooling towers. 

What does a cooling tower do?

As the name suggests, a cooling tower’s primary function is to lower temperatures – specifically of water, or ‘cooling water’ as it’s known at Drax.

Power stations utilise a substantial amount of water in the generation of electricity. At a thermal power plant, such as Drax, fuel is used to heat demineralised water to turn it to high pressure steam. This steam is used to spin turbines and generate electricity before being cooled by the cooling water, which flows through two condensers on either side of each of the steam turbines, and then returning to the boiler. It is this process that the cooling towers support – and it plays a pivotal role in the efficiency of electricity generation at Drax’s North Yorkshire site.

To optimise water utilisation, some power stations cycle it. To do this, they have cooling towers, of which at Drax there are 12. These large towers recover the warmed water, which then continues to be circulated where chemistry is permitting.

The warmed water (about 40°C) is pumped into the tower and sprayed out of a set of sprinklers onto a large volume of plastic packing, where it is cooled by the air naturally drawn through the tower. The plastic packing provides a large surface area to help cool the water, which then falls in to the large flat area at the bottom of the massive structure called the cooling tower pond.

As the water cools down, some of it (approximately 2%) escapes the top of the tower as water vapour. This water vapour, which is commonly mistakenly referred to as steam, may be the most visible part of the process but it’s only a by-product of the cooling process.

The majority of the water utilised by Drax Power Station is returned back to the environment, either as vapour from the top of the towers or safely discharged back to the River Ouse. Each year, about half of the water removed from the river is returned there. In effect, it is a huge amount of water recycling and in environmental terms, it is not a consumptive process.

Close-up of side of Drax cooling towers

How do you build a cooling tower?

The history of cooling towers as we know them today dates back to the beginning of the 20th century, when two Dutch engineers were the first to build a tower using a ‘hyperboloid’ shape. Very wide on the bottom, curved in the centre and flared at the top, the structure meant fewer materials were required to construct each tower, it was naturally more robust, and it helped draw in air and aid its flow upwards. It quickly became the de facto design for towers across the world.

The Dutch engineers’ tower measured 34 metres, which at the time was a substantial achievement, but as engineering and construction abilities progressed, so too did the size of cooling towers.

Today, each of 12 towers measures 115 metres tall – big enough to fit the dome of St Paul’s Cathedral or the whole of the Statue of Liberty, with room to spare. If scaled down to the size of an egg, the concrete of each cooling tower would be the same thinness as egg shell.

The structures at Drax are dwarfed by the cooling towers at the Kalisindh power plant in Rajasthan, India, the tallest in the world. Each stands an impressive 202 metres tall – twice the height of the tower housing Big Ben and just a touch taller than the UK’s joint fifth tallest skyscraper, the HSBC Tower at 8 Canada Square in London’s Canary Wharf.

The industrial icon of the future

Today’s energy mix is not what is used to be. The increased use of renewables means we’re no longer as reliant on fossil fuels, and this has an effect on cooling towers. Already a large proportion of the UK’s most prominent towers have been demolished, going the same way as the coal they were once in service to. But this doesn’t mean cooling towers will disappear completely.

Power stations such as Drax, which has upgraded four of its boilers to super-heat water with sustainably-sourced compressed wood pellets instead of coal, the dwindling coal fleet, and some gas facilities still rely on cooling towers. As they continue to be part of our energy mix, the cooling tower will remain an icon of electricity generation for the time being. But it’ll be a mantle it shares with biomass domes, gigantic offshore wind turbines and field-upon-field of solar panels – the icons of today’s diverse energy mix.

View our water cooling towers close up. Drax Power Station is open for individual and group visits. See the Visit Us section for further information.