Tag: electric insights

What happened to Great Britain’s electricity over summer 2017

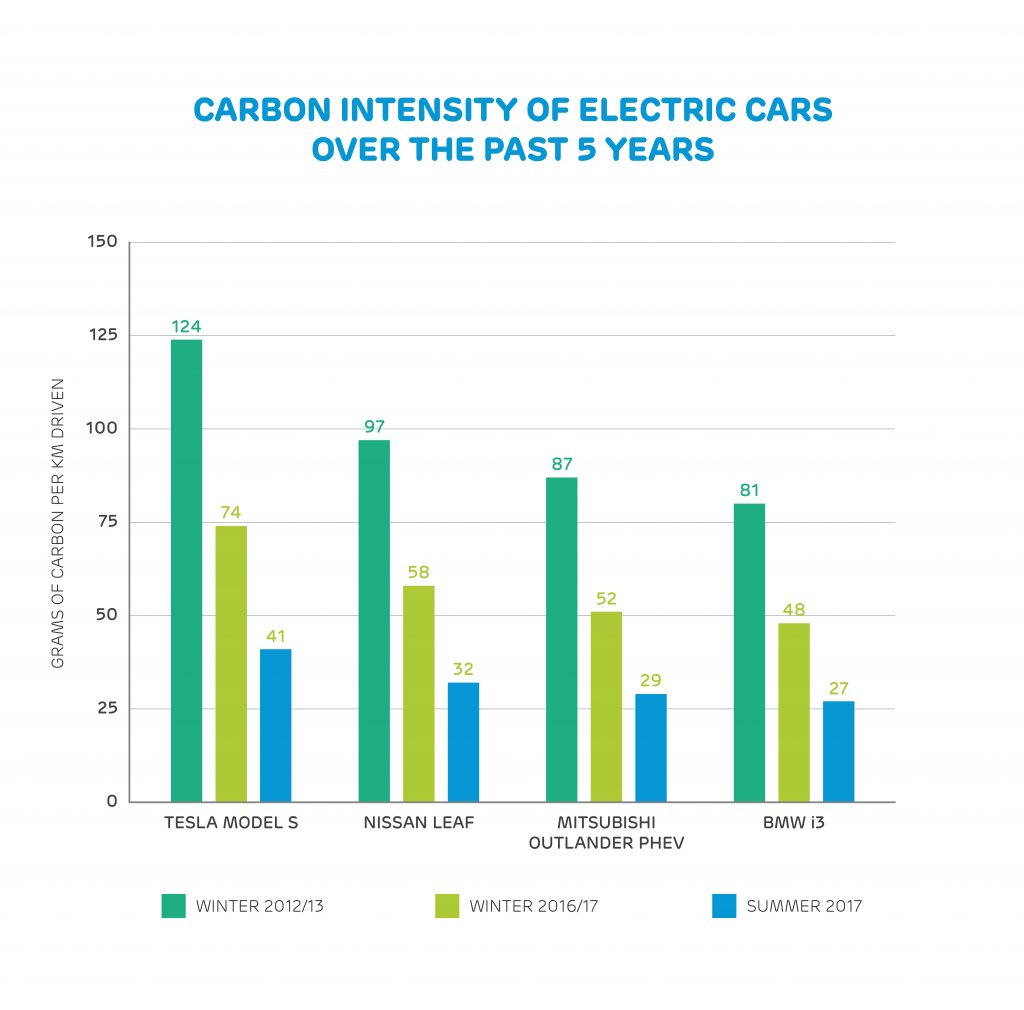
What a difference four years can make. Back in 2012 the carbon intensity of Great Britain’s electricity production was almost 600g per kWh (kilowatt hour). Jump forward to 2016 and this has halved to make Britain one of the least carbon-intense power systems in the world.

This good news comes from Electric Insights, a quarterly research paper on Britain’s power system, commissioned by Drax and written by Imperial College London academics. The latest report’s key finding is just how much Britain’s energy system has decarbonised compared to other nations.

Here is what the data from Q3 2017 tell us about Great Britain’s energy system today and how it will continue to change into the future.

 Climbing the low carbon league tables

Comparing the electricity mix and carbon intensity of nations producing more than 100 TWh (terawatt hours) a year, the report has established a ‘league table’ that tracks the progress (or regress) of countries’ efforts. It shows Britain’s energy system has decarbonised at a greater pace than any other nation.

In 2012 Britain was ranked 20th, sitting mid-table alongside Italy and Saudi Arabia. But in the four years following, Britain rocketed up to become the seventh least-carbon intense energy system in the world in 2016.

The 47% drop in carbon intensity is the biggest change of any of the countries analysed, and puts Britain just behind Norway and Sweden, which have the resources to support substantial hydropower generation, as well as nuclear-dependent France.

The most any other country moved was eight places – in the opposite direction to Britain. This was the Netherlands where new coal power stations were built at a time when use of coal across England, Scotland and Wales combined reduced by around 80%. The additional coal capacity and power generated from that fuel in the Netherlands led to a dramatic increase in carbon emissions.

A major force in helping drive Britain’s rapid move away from coal is the Carbon Price Floor. This currently sits at £18 per tonne of carbon dioxide (CO2) emitted, on top of just £5 per tonne in the rest of Europe.

Read the full analysis at The low carbon electricity league table and view full chart here.
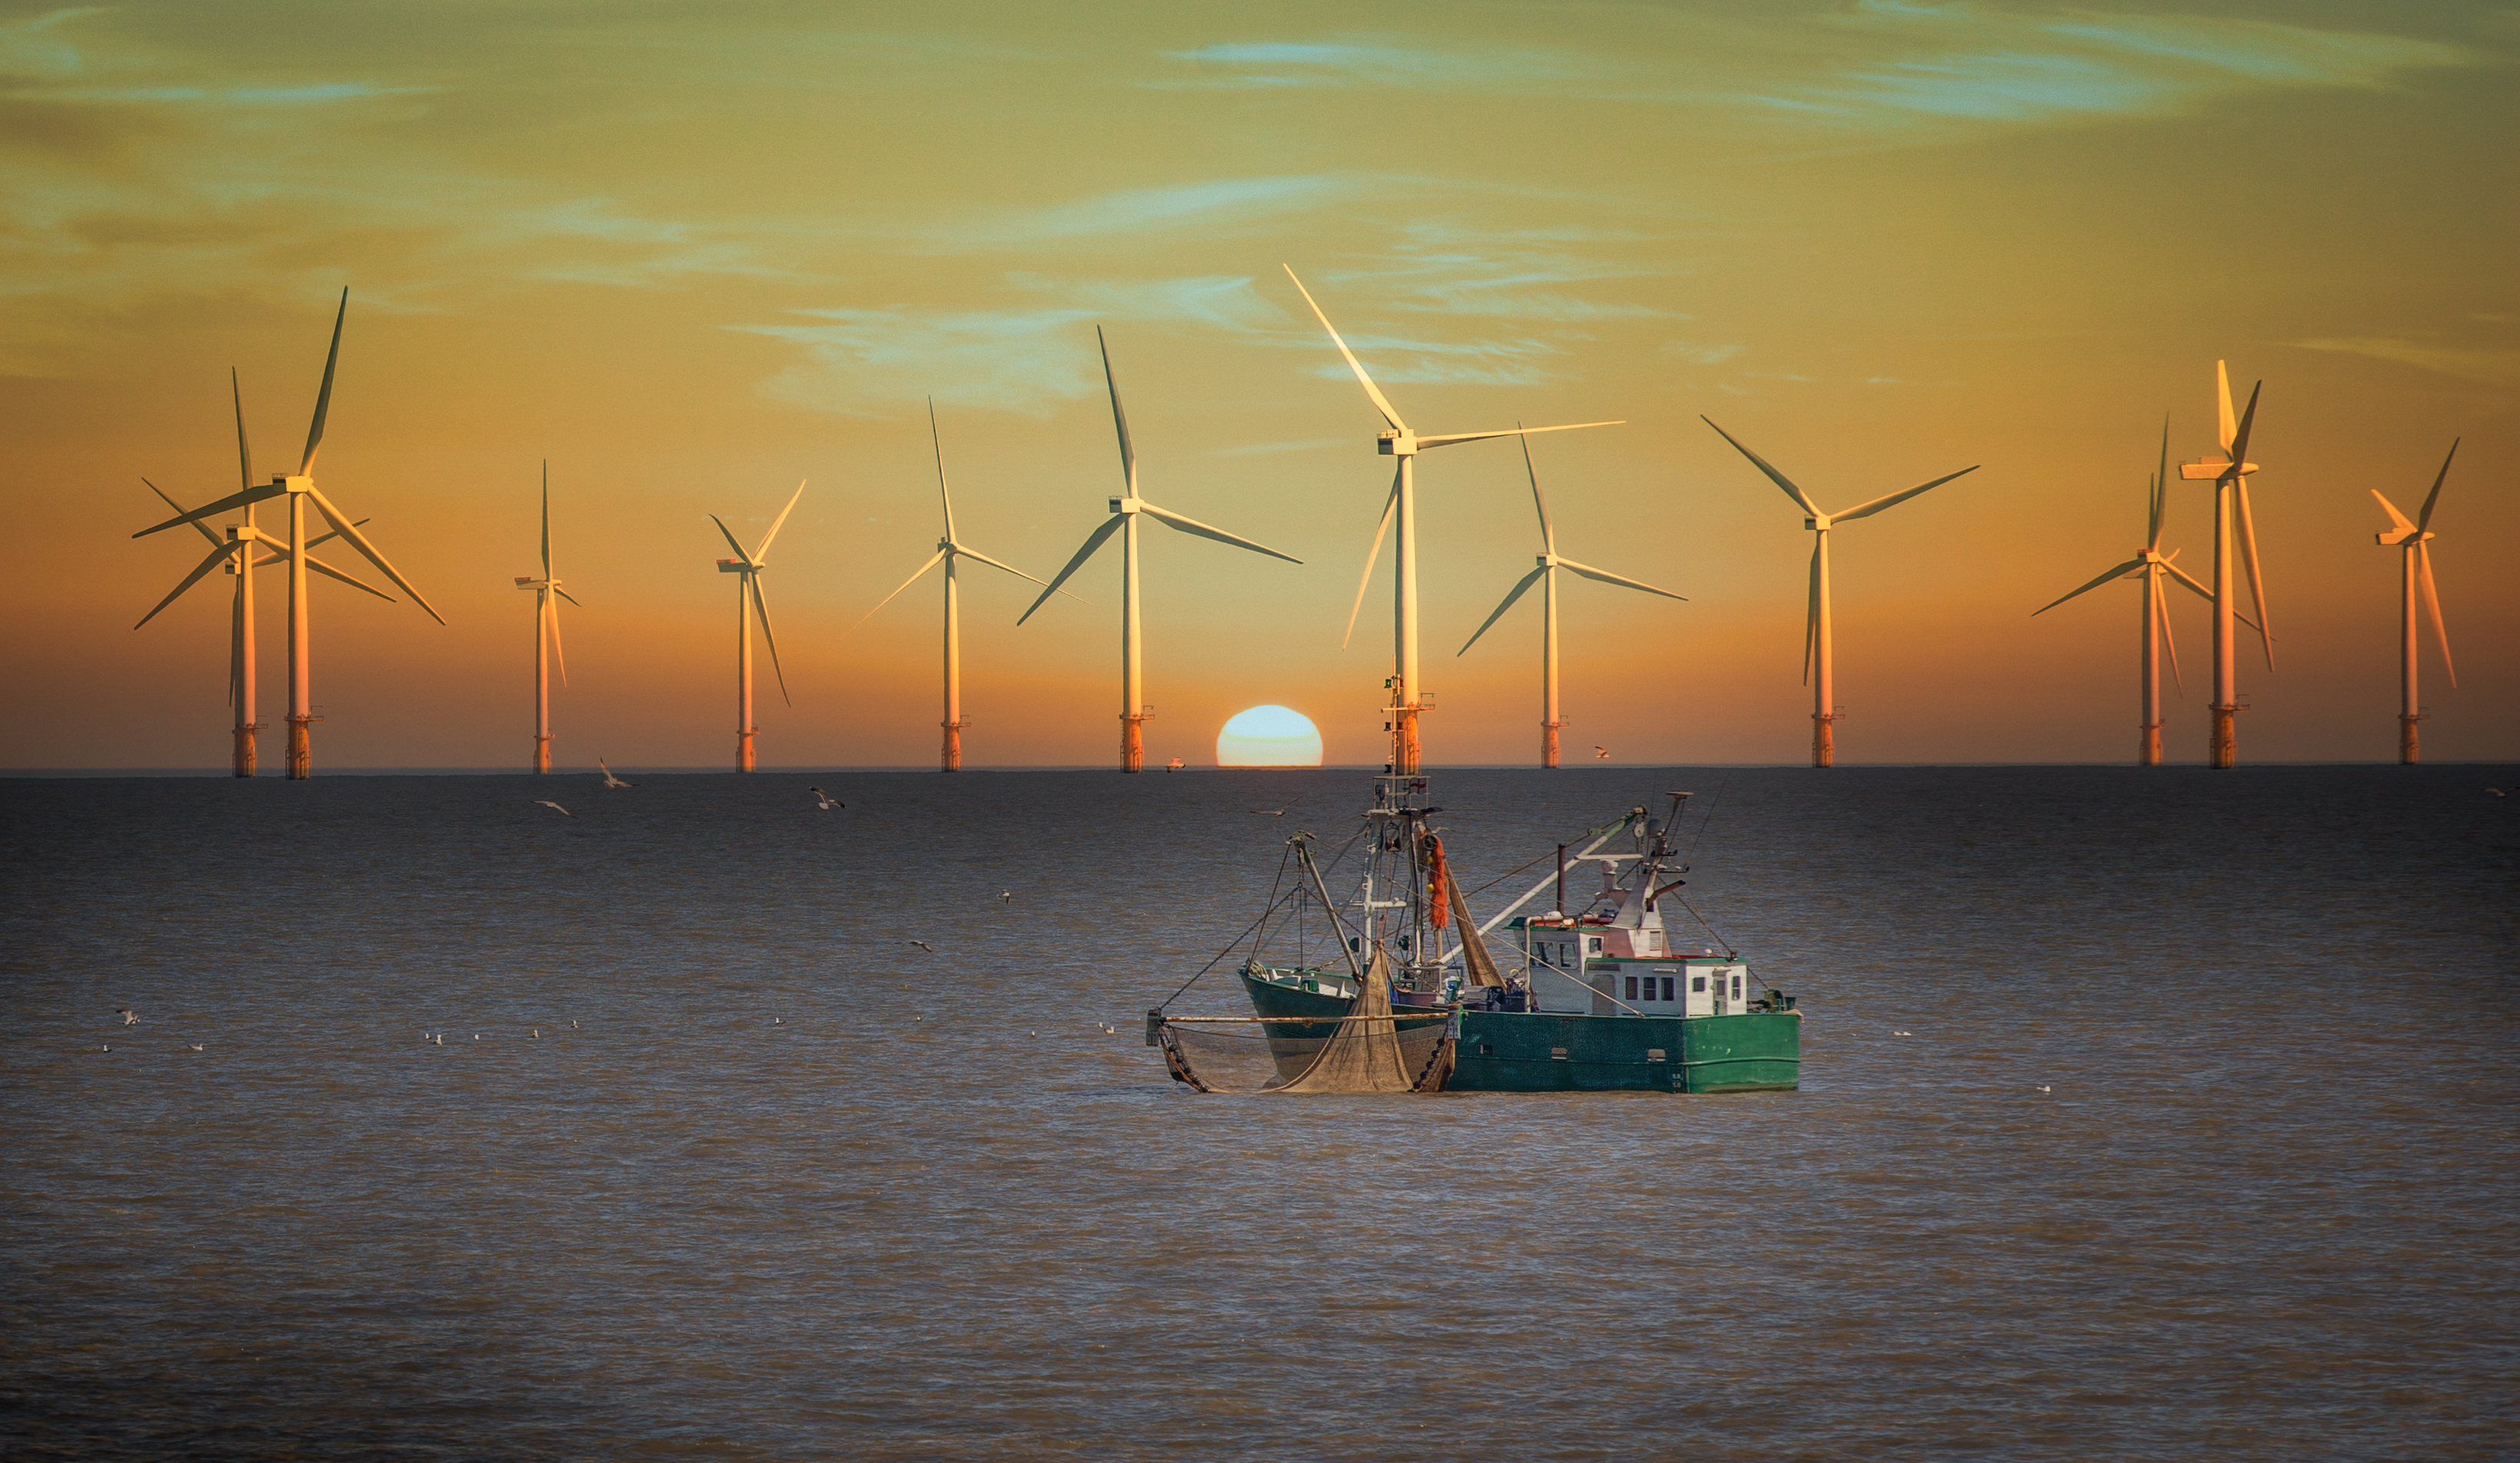
Importing problems?

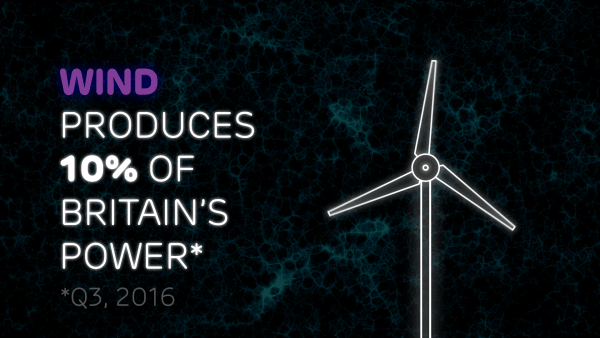
Imports are making up an increasing amount of the UK’s electricity mix, and in July and August they reached an all-time high of 9%. The majority (60%) of these imports in Q3 2017 came from France, while 30% was from the Netherlands and 10% from Ireland.

However, while importing electricity from overseas has become crucial in helping meeting demand and maintaining a flexible grid, questions remain around the practice’s carbon intensity.

France generates much of its electricity from low-carbon nuclear sources, however, Irish and Dutch exports rely heavily on fossil fuels. As a result, the electricity Britain imported had a 30% higher carbon intensity than that generated domestically – 314 vs 245 g/kWh over the last 12 months.

Over the next five years 7 GW (gigawatts) of new interconnectors are planned for construction (including with France, Norway and Denmark), which could increase electricity imports to provide as much as 10-24% of the country’s electricity. As these continue to play a bigger role in our electricity mix, it is important we ensure it comes from lower-carbon sources where possible and supports the continuing decarbonisation of electricity rather than ‘exporting emissions’.

Read two articles on the topic of interconnectors in Electric Insights:

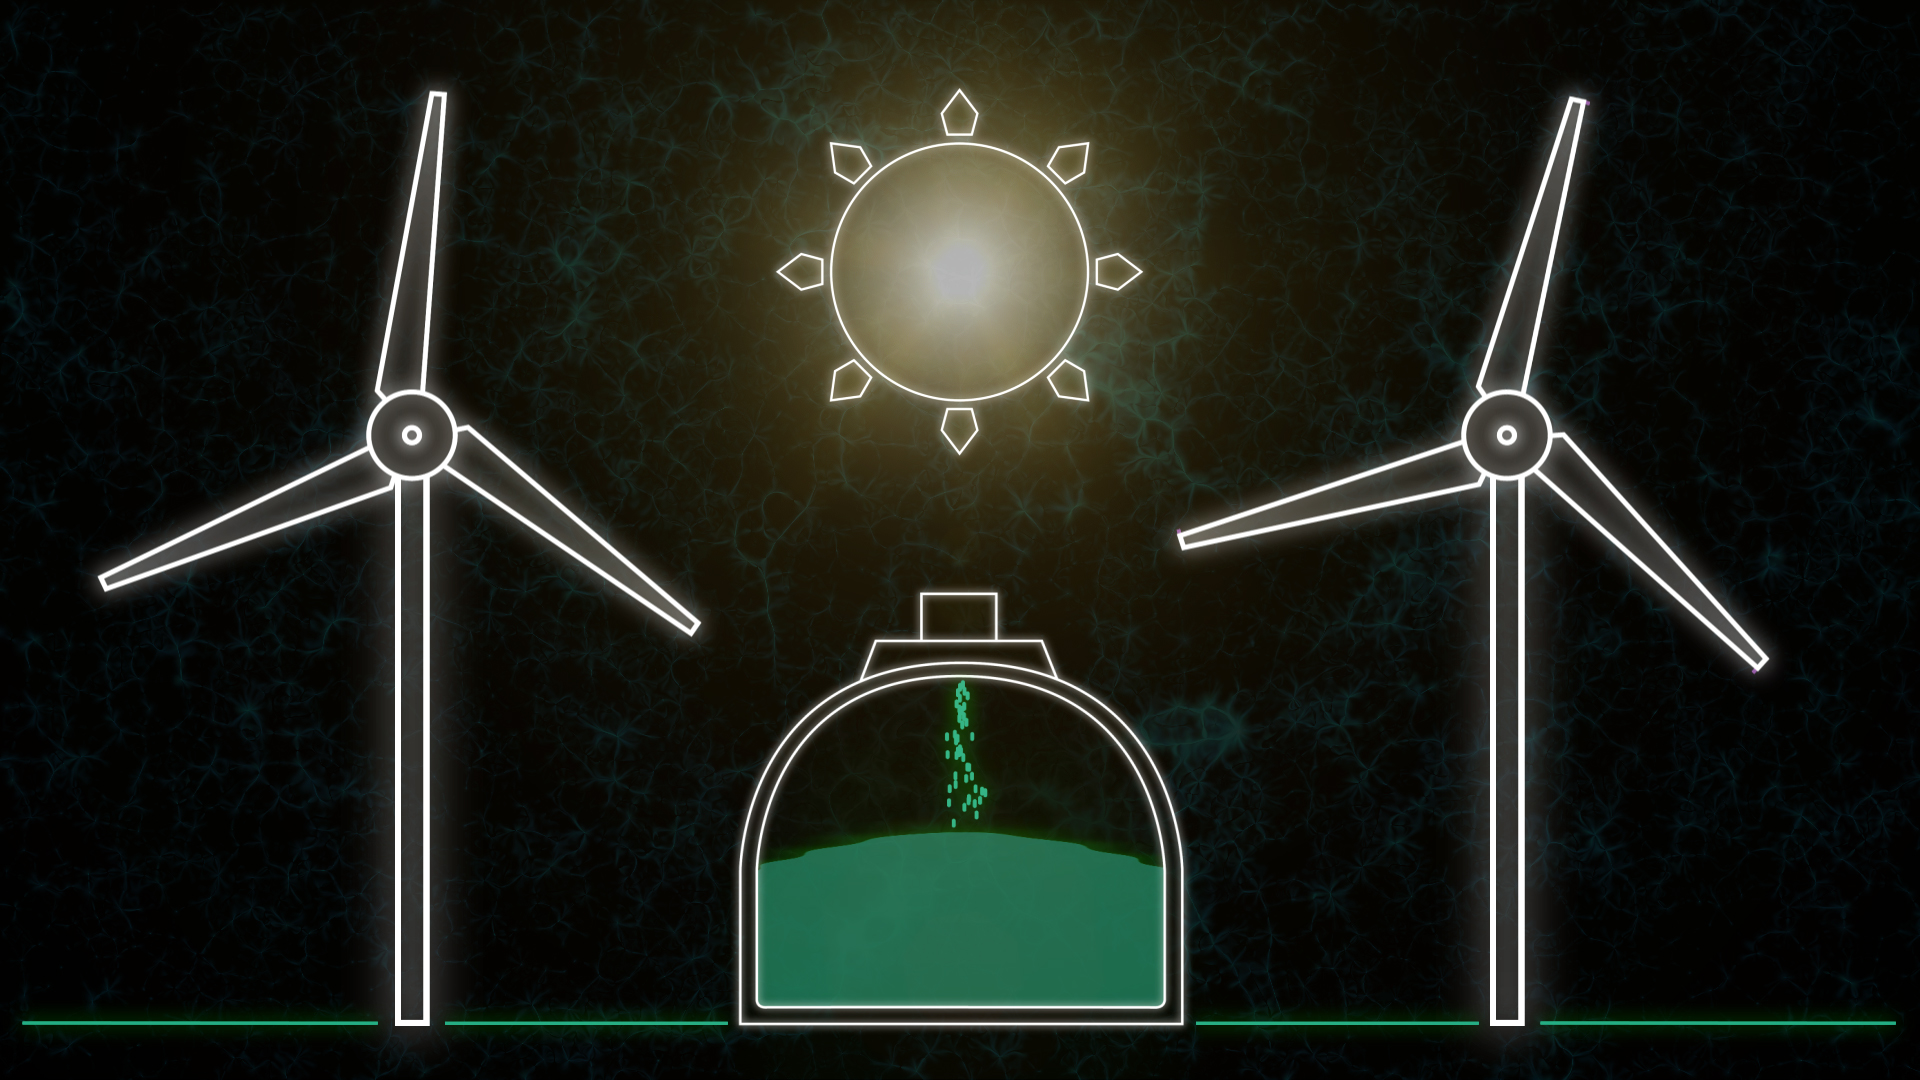
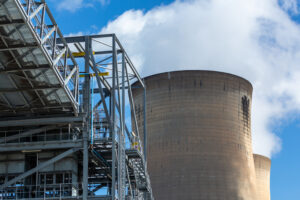
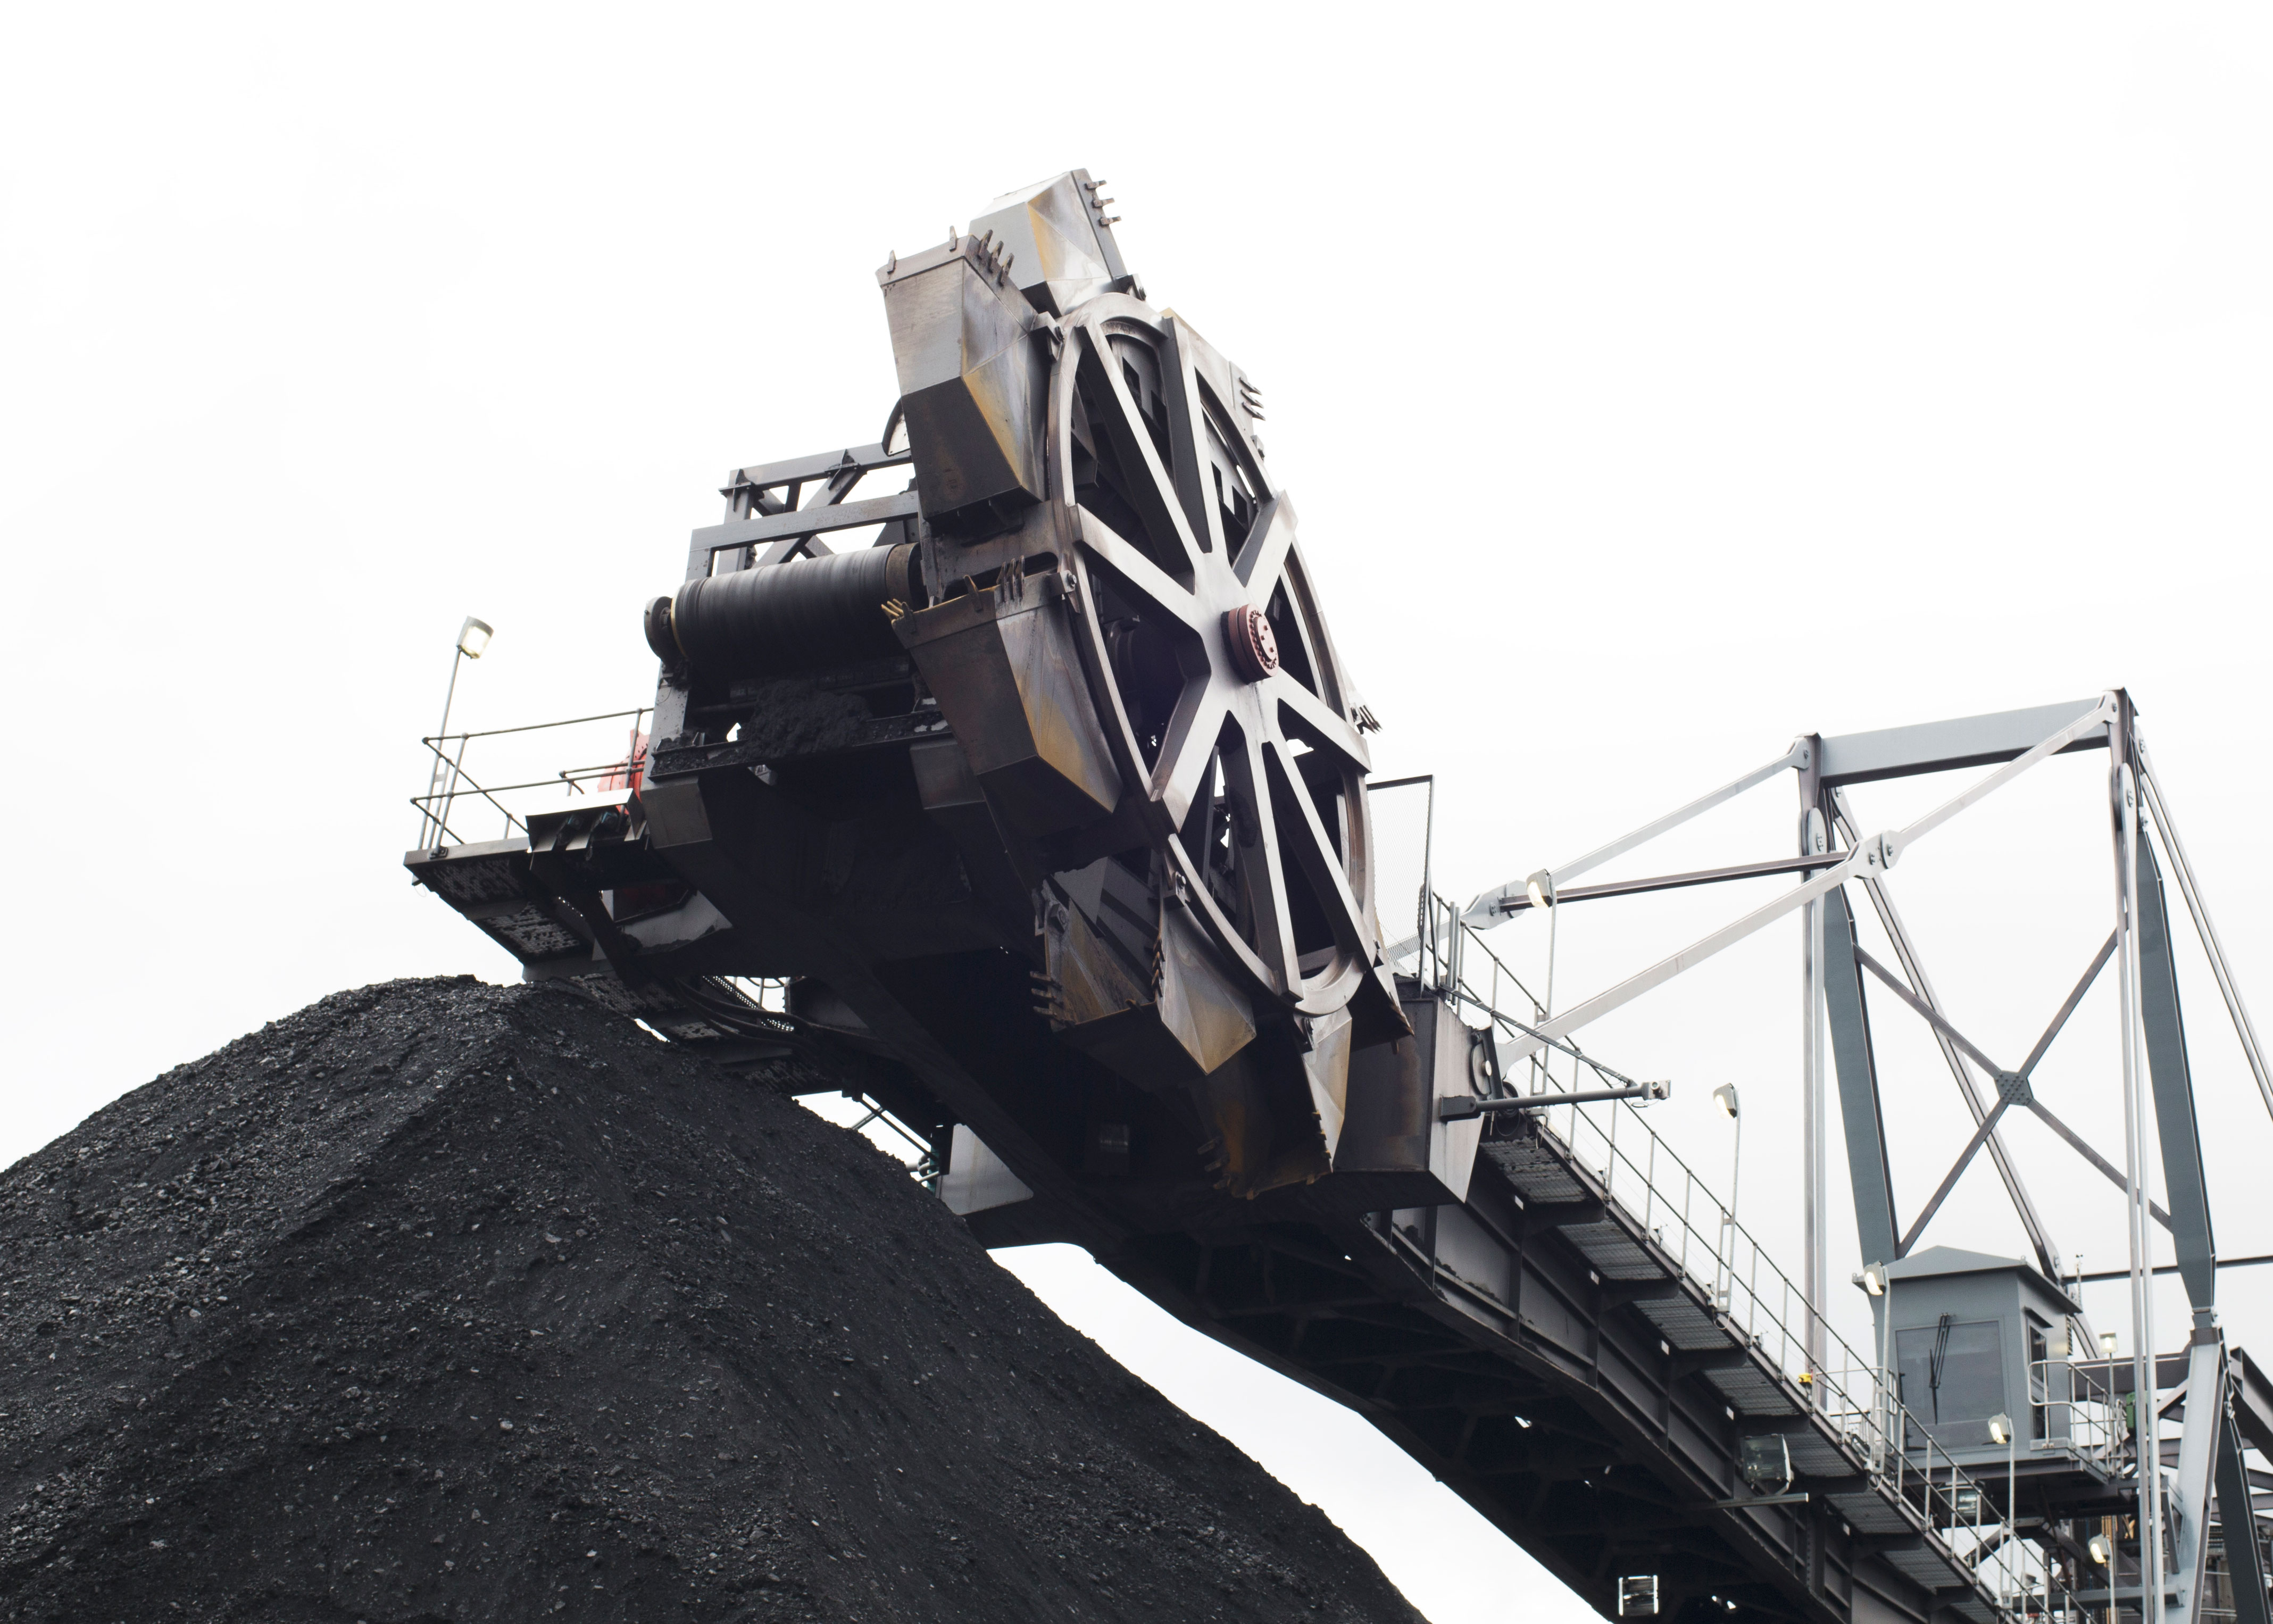
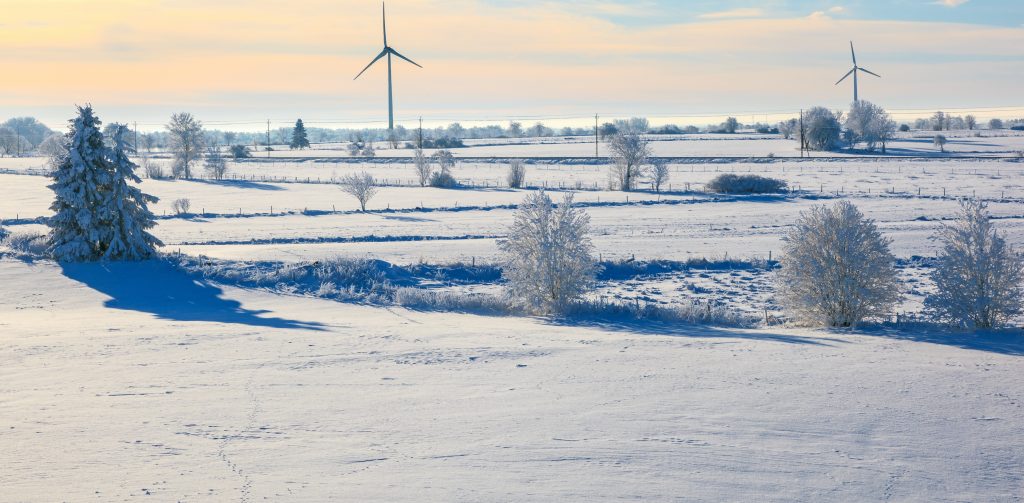
Coal firmly relegated to the bench

The nose-dive of coal generation in Britain since 2012 highlights just how out-of-favour the carbon-intensive fossil fuel has become in the energy system. Now it occupies a role solely as a backup to low-carbon and renewable sources.

Over the summer months coal generation stayed at a historic low of 1.9% of total electricity generation. Between April and August Britain’s 14 GW of installed coal stations only produced 0.6 GW in an average hour. This follows a year of milestones in the decline of coal, most notably in April, when Britain saw its first day without burning any coal since 1882.

But this is not to say it has disappeared completely. As temperatures dropped in late summer, coal was called upon to meet sudden demand. On September 19th 40% of the coal fleet was called upon to produce 5.7 GW on average across that day, showing that even as coal capacity plummets – dropping from 28 GW in 2012 to 14 GW in 2016 – it still plays a necessary role in helping meet peaks in demand.

What’s clear, however, is that this role is only growing smaller and smaller as our power system continues to decarbonise and flexible energy technologies replace it.

Read the full article here: Coal output bottoms out

Explore the data in detail by visiting ElectricInsights.co.uk

Commissioned by Drax, Electric Insights is produced independently by a team of academics from Imperial College London, led by Dr Iain Staffell and facilitated by the College’s consultancy company – Imperial Consultants.

Do electric vehicles actually reduce carbon emissions?

Redcar Sunset

Electric vehicles (EVs) are often seen as a key driver towards a greener future. Indeed, transport accounts for roughly a quarter of the UK’s greenhouse gas emissions and seriously affects air quality in major cities.

To tackle pollution problems, governments around the world are implementing ambitious policies to promote the electrification of transport and phase out ICE (internal combustion engine) vehicles. The UK and France both plan to ban the sale of petrol- and diesel-only cars by 2040 while India is setting an even more ambitious end date of 2030.

Added to this are EVs’ growing popularity with drivers. There are now almost 110,000 electric cars and vans on UK roads spurred on by lowering battery costs and a growing range of models. Including plug-in hybrid vehicles, EVs now account for 2% of new registrations.

Switching to EVs is an obvious way to massively cut pollution in areas of dense traffic. But the question remains – how clean are EVs on the broader scale, when you look at the electricity used to charge them? 

Electric vehicle

Electric vehicles are getting cleaner

EVs don’t give off the same exhaust emissions as engines, but the power in their batteries has to come from somewhere. Follow the flow back from the car, through the charging point, all the way back to the power station and it’s likely some of that electricity is coming from fossil fuels. And that means emissions.

“They weren’t as green as you might think up until quite recently,” says Dr Iain Staffell, a researcher at Imperial College London and author of Electric Insights – a study commissioned by Drax that analyses electricity generation data in Britain. “Now, thanks to the rapid decarbonisation of electricity generation in the UK, EVs are delivering much better results,” he continues.

In fact, year-round average emissions from EVs have fallen by half in the last four years thanks to greener electricity generation. Today, they are twice as efficient as conventional cars.

Take the Tesla Model S. In the winter of 2012, producing the electricity for a full charge created 124g of carbon emissions per km driven, roughly the same as a 2L Range Rover Evoque. Now the carbon intensity of charging a Tesla has nearly halved to 74g/km in winter and 41 g/km in summer, as the UK continues to break its own renewable energy records. For smaller EVs, the results are even better. The Nissan Leaf and BMW i3 can now be charged for less than half the CO2 of even the cleanest non-plug-in EV, the Toyota Prius Hybrid.

Carbon intensity of electric vehicles

So, the current outlook for EVs is hugely positive – but as their numbers continue to increase, will the demand they add to the grid put their clean credentials at risk?

Will EVs accelerate electricity demand?

The National Grid suggests there could be as many as nine million EVs on UK roads by 2030, which could lead to an additional 4-10 GW of demand on the system at peak times. This, in some cases, could lead to a rise in emissions.

Electricity demand in Britain typically peaks between 6pm and 10pm, when people arrive home and switch on lights and appliances. If you were to charge your EV between those evening hours, the emissions would be 8% higher than reported in the chart above. If you charged between midnight and 6am, they would be 10% lower.

Today, this demand is met by the existing mix of power stations (which last quarter included more than 50% renewable and low-carbon sources). But when there are sudden spikes in demand above this typical usage, the National Grid must call in the help of carbon-intensive reserve generators, such as coal-powered stations. Polluting diesel generators are also on standby around the UK, ready to turn on and feed into regional distribution grids at a moment’s notice.

To meet the challenge of peak-time EV charging, less carbon intensive power generation, storage and smart power management systems are needed. These include rapid response gas power stations such as the four Drax OCGTs planned to come online in the early 2020s, as well as grid-scale batteries, home-based batteries and demand-side response schemes. As the share of intermittent renewable capacity on the grid increases, more back-up power needs to be available for when the wind doesn’t blow and the sun doesn’t shine.

Keeping our future fuels clean

A future increasingly relying on back-up generators is far from inevitable, especially if the use of smart technology and smart meters increases. By analysing electricity costs and country-wide demand, smart meters have the potential to ensure EVs only charge outside peak times (unless absolutely necessary), when electricity is more likely to come from renewable or low-carbon and cheaper sources.

If the grid continues to decarbonise through advances in renewable technologies and lower-cost coal-to-biomass conversions, the potential of EVs’ electricity coming with associated emissions is diminished even further.

There is no doubt that EVs will make up a significant part in the future of our mobility. That they will also play a part in the future of cleaning up that mobility is as good as assured, but on this journey, it’s imperative we keep our eyes on the road.

Commissioned by Drax, Electric Insights is produced independently by a team of academics from Imperial College London, led by Dr Iain Staffell and facilitated by the College’s consultancy company – Imperial Consultants.

What you need to know about Britain’s electricity last quarter

Drax EI header

For an hour over lunch on Wednesday, 7th June, more than 50% of Britain’s electricity came from renewables. It was only the second time this had ever happened – the first had come just two months earlier, in April.

The second quarter (Q2) of 2017 was a period largely made up of firsts for Britain’s electricity system. While there were only two instances of renewable power tipping the 50% mark between April and June, overall, wind, solar, biomass and hydro energy made up more than a quarter of all Britain’s electricity for the first time ever.

These findings come from Electric Insights, research on Britain’s power system, commissioned by Drax and written by top university academics. Over the past year, the quarterly report has shown breaking renewable records is becoming the new normal for Britain’s electricity. Last quarter was no different.

Here, we look at the key findings from Q2 2017 and what they mean for the changing nature of the energy sector.

Daily electricity generation graph

More than half Great Britain’s electricity came from renewables. Twice

Wind, solar, biomass and hydro accounted for 51.5% of the UK’s electricity for an hour on 7th June, generating 19.1 gigawatts (GW). Combined with nuclear power and imports from France, low-carbon output was a record 28.6 GW – a massive 89% of total demand. This followed 30th April, when Britain’s electricity edged over the 50% renewable mark for a shorter, but no less significant, period.

The percentage of renewables making up our power supply is set to grow as additional renewable capacity comes onto the grid. There is currently 6 GW of additional wind capacity being constructed in Britain. Solar capacity has already hit 12.4 GW – more solar panels than analysts thought would be installed by 2050. Plans to convert more of Britain’s coal units to biomass will increase the availability of renewable power further, still.

25% electricity infographic

Electricity was cleaner than ever

There was a key date in the history of coal during Q2. On 21st April, Britain recorded the first full day it had gone without burning any coal since 1882 – the year Holborn Viaduct power station became the world’s first coal-fired public electricity station.

While that date is symbolic of the UK’s shift away from coal, in practice, it means carbon emissions are also dropping to historically low levels. Carbon intensity reached a new low in Q2, averaging 199 g/kWh over the quarter – 10% lower than the previous minimum set last year. For context, carbon intensity averaged 740 g/kWh in the 1980s and 500 g/kWh in the 2000s.

An important indicator of this falling carbon intensity is that Britain’s electricity now regularly drops below 100 g/kWh, and reached an all-time low of 71 g/kWh on the sunny and windy Sunday of 11th June.

100,000 electric vehicles infographic

Electric cars are cleaner than before

One of the greatest decarbonisation challenges moving forward is how we transform transport. Electrification is the primary driver of change in this sector, and Q2 saw Britain hit a significant milestone as the total number of electric vehicles (EVs) in the country surpassed 100,000.

The potential of EVs in cleaning up transport is significant, but there are also concerns they could, in some cases, increase CO2 levels due to pollution from power stations. However, as the last quarter’s data shows, EVs are in fact twice as carbon efficient as conventional cars thanks to the amount of renewable and low carbon electricity on the system.

“According to our analysis, looking at a few of the most popular models, EVs weren’t as green as you might think up until quite recently,” says Dr Iain Staffell From Imperial College London. “But now, thanks to the rapid decarbonisation of electricity generation in the UK they are delivering much better results.”

25% solar infographic

The most solar power a quarter has ever seen

The longer days in Q2 enabled solar power to become a key source of electricity, and for eight hours over the quarter it generated more than all fossil fuels combined. It also set output records by supplying 25% of total demand on 8th April, and producing 8.91 GW on 26th May.

While wind remains the largest source of renewable energy generation in the UK, solar’s influence is growing – especially as decentralisation of the power system continues to proliferate.

Of Britain’s 12.4 GW solar capacity, 57% is concentrated in 1,400 solar farms of around 5 MW each, while the rest is distributed across almost one million rooftop arrays in homes, businesses and other institutions. In fact, during June, 10% of all Britain’s electricity came from these sorts of decentralised sources – sources of power not on the national grid.

This is unlikely to spell a fundamental shift to an entirely decentralised power grid in the short term, but it does hint at the changes the sector is seeing. From its carbon profile, to its variety, to its flexibility, Britain’s power system is changing – and that’s a good thing.

10% decentralised energy infographic

Explore the data in detail by visiting ElectricInsights.co.uk

Commissioned by Drax, Electric Insights is produced independently by a team of academics from Imperial College London, led by Dr Iain Staffell and facilitated by the College’s consultancy company – Imperial Consultants.

More power per pound

As the country moves towards a lower carbon future, each renewable power generation technology has its place. Wind, solar, hydro and wave can take advantage of the weather to provide plentiful power – when conditions are right.

Reliable, affordable, renewable power

But people need electricity instantly – not just when it’s a windy night or a sunny day. So, until a time when storage can provide enough affordable capacity to store and supply the grid with power from ample solar and wind farms, the country has to rely, in part, on thermal generation like gas, coal and biomass. Reliable and available on demand, yes. But renewable, low carbon and affordable too? It can be.

A year ago, a report by economic consultancy NERA and researchers at Imperial College London highlighted how a balanced mix of renewable technologies could save bill payers more than £2bn. Now, publicly available Ofgem data on which its newly published Renewables Obligation Annual Report 2015-16 is based reinforces the case for government to continue to support coal-to-biomass unit conversions within that technology mix. Why? Because out of all renewables deployed at large scale, biomass presents the most value for money – less public funding is required for more power produced.

Renewable costs compared

Drax Power Station’s biomass upgrades were the largest recipient of Renewable Obligation (RO) support during the period 2015-16. The transformation from coal to compressed wood pellets has made Drax the largest generator of renewable electricity in the country. And by a significant margin. Drax Power Station produced more than five times the renewable power than the next biggest project supported under the RO – the London Array.

Dr Iain Staffell, lecturer in Sustainable Energy at the Centre for Environmental Policy, Imperial College London, and author of Electric Insights, who has analysed the Ofgem data commented:

“Based on Ofgem’s Renewables Obligation database, the average support that Drax Power Station received was £43.05 per MWh generated. This compares to £88.70 per MWh from the other nine largest projects.”

“Biomass receives half the support of the UK’s other large renewable projects, which are all offshore wind. The average support received across all renewable generators in the RO scheme – which includes much smaller projects and all types of technology – is £58 per MWh. That is around £15 per MWh more than the support received by Drax.”

Ending the age of coal

Drax Group isn’t arguing for limitless support for coal-to-biomass conversions. And Drax Power Station, being the biggest, most modern and efficient of power stations built in the age of coal, is a special case. But if the RO did exist just to support lots of biomass conversions like Drax but no other renewable technologies, then in just one year, between 2015-16, £1bn of costs saving could have been made for the public purse.

Drax Power Station may be the biggest-single site recipient of support under the RO – but it does supply more low carbon power into the National Grid than any other company supported by Renewable Obligation Certificates (ROCs). In fact, 65% of the electricity generated at its Selby, North Yorkshire site, is now renewable. That’s 16% of the entire country’s renewable power – enough to power four million households.

Thanks to the support provided to Drax by previous governments, the current administration has a comparatively cost effective way to help the power sector move towards a lower carbon future. Biomass electricity generated at Drax Power Station has a carbon footprint that is at least 80% less than coal power – supply chain included. Drax Group stands ready to do more – which is why research and development continues apace at the power plant. R&D that the company hopes will result in ever more affordable ways to upgrade its remaining three coal units to sustainably-sourced biomass, before coal’s 2025 deadline.

Commissioned by Drax, Electric Insights is produced independently by a team of academics from Imperial College London, led by Dr Iain Staffell and facilitated by the College’s consultancy company – Imperial Consultants.

Taxing coal off the system

In the Spring Budget 2017, the Chancellor announced that the Government remains committed to carbon pricing. Philip Hammond’s red book revealed that from 2021-22 ‘the Government will target a total carbon price and set the specific tax rate … giving businesses greater clarity on the total price they will pay.’ Further details on carbon prices are to be ‘set out at Autumn Budget 2017’.

Researchers at Imperial College London have modelled what would have happened during 2016 with no carbon tax and also with an increased carbon tax. They have compared both with what actually happened. Their conclusion?

No carbon tax would mean:

  • More coal
  • Less gas
  • Higher emissions.

A higher carbon tax would mean:

  • Less coal
  • More gas
  • Lower emissions

Since it was announced in 2011, the Carbon Price Support (CPS) has encouraged generators and industry to invest in lower carbon and renewable technologies. It has also forced coal generators to fire their boilers only when they are really needed to meet demand, such as during the winter months or at times of peak demand and still or overcast weather conditions during the summer months.

The introduction of the carbon price has meant that gas power stations, which are less carbon intensive than coal, have jumped ahead of coal in the economic merit order of energy generation technologies and produced a greater share of the UK’s power. The same is the case for former coal generation units that have since upgraded to sustainable biomass – three such units at Drax Power Station result in savings in greenhouse gas (GHG) emissions of at least 80%.

A coal cliff edge?

The Carbon Price Support has resulted in significant savings in the country’s greenhouse gas emissions, helping the UK meet its international climate change commitments. Removing or reducing the CPS too soon and Britain’s power mix risks going back in time. It would improve the economics of coal and encourage Britain’s remaining coal power stations to stay open for longer creating a risk to security of supply through a ‘cliff edge’ of coal closures in the mid-2020s. Changing the economics to favour coal also makes it harder to reach the UK government’s goal of bringing a new fleet of gas power stations online.

What if …

Dr Iain Staffell from the Centre for Environmental Policy at Imperial College London has modelled a scenario in which the Carbon Price Support did not exist in 2016. “If the government had abolished all carbon pricing, we would probably have seen a 20% increase in the power sector’s carbon emissions,” said Staffell.

“Removing the Carbon Price Support would have the equivalent environmental impact of every single person in the UK deciding to drive a car once a year from Land’s End to John o’Groats.”

Without the Carbon Price Support, emissions from electricity consumption would be 20% higher, meaning an extra 250 kg per person (equivalent to driving a car 800 miles).

Running the numbers

The Carbon Price Support is capped at £18/tCO2 until 2021. In his Budget on 8th March 2017, Chancellor Philip Hammond – rightly, in the view of Drax – confirmed the government’s commitment to carbon pricing. Using data from National Grid and Elexon and analysis from Dr Iain Staffell, Electric Insights shows how coal power generation was only needed last winter when electricity demand was greater than could be produced by other technologies alone. Coal was only used at times of peak demand because it was among the most expensive energy technologies, in part due to the CPS.

What if that wasn’t the case and the government had decided to scrap the CPS before that point in time? More coal is burnt, particularly during the daytimes – on average coal produces 2,500 MW more over this week (equivalent to four of Drax Power Station’s six generation units).

And what does Dr Iain Staffell’s model suggest would have happened if the cap was doubled to £36/tCO2? The change is stark. Even for a week in the winter, with an average temperature across the country of 8.6oC, to see coal generation reduced so much compared to the actual CPS of £18/tCO2 or the £0/tCO2 scenario model, illustrates the impact of the Carbon Price Support.

Could bill payers save?

One argument for reducing the Carbon Price Support – or scrapping it altogether – is the possibility that consumers and non-domestic electricity bill payers would save money. It’s worth noting that apparent savings for electricity bill payers are lowered when the whole way that power is priced is accounted for, by the time it reaches homes and businesses.

“Carbon price support does increase the cost of wholesale power,” says Staffell. “But if you add the extra taxes, other renewable and low carbon support measures, transmission and balancing charges and fees imposed by electricity suppliers, the overall impact on consumer bills is modest. So, if the government abolished all carbon pricing, we could expect a 1 p/kWh reduction in our tariffs, but a 21% increase in our carbon emissions.”

As a report by economic consultancy NERA and researchers from Imperial College London has already shown, there are other ways to save bill payers money, while encouraging a low carbon future. Their analysis published in early 2016 found that households and businesses could save £2bn if the government considered the whole system cost of electricity generation and supply when designing its competitions for support under its Contracts for Difference (CfD) scheme.

2016, redux

Without the Carbon Price Support, the UK wouldn’t have managed to send carbon emissions back to 19th century levels.

So if 2016 was played out one more time but with no Carbon Price Support:

  • Coal generation would have increased by 102% (28 terawatt-hours) to 56 TWh
  • Gas generation would have decreased by 21% (-27 TWh) to 101 TWh
  • Carbon emissions would have risen by 21% (16 million tonnes of carbon dioxide) to 92MT CO2
  • The carbon intensity of the grid would have increased by 20% from 290 gCO2/kWh to 349 gCO2/kWh

And if 2016 had seen a doubling of the CPS to £36/tCO2:

  • Coal generation would have decreased by 47% (-12.9 TWh) to 14.7 TWh
  • Gas generation would have increased by 9% (11.8 TWh) to 139.5 TWh
  • Carbon emissions would have decreased by 10% (7.3 MT CO2) to 68.6 MT CO2
  • The carbon intensity of the grid would have decreased by 9% from 290 gCO2/kWh to 263 gCO2/kWh

The two scenarios presented above only modelled the impact of no or a higher Carbon Price Support on nuclear, coal and gas power supply. In the real-world, changes to the Carbon Price Support would also impact on energy technologies that operate under the Renewables Obligation (RO) such as two of Drax’s three biomass units and much of the country’s other renewable capacity. CPS changes would also likely impact imports and storage.

While no analysis is perfect this clearly illustrates the significantly negative impact that scrapping or reducing the Carbon Price Support would have on the UK’s decarbonisation agenda. It also highlights the benefits that the government’s decision to remain committed to carbon pricing will deliver.

Commissioned by Drax, Electric Insights is produced independently by a team of academics from Imperial College London, led by Dr Iain Staffell and facilitated by the College’s consultancy company – Imperial Consultants.

4 firsts for Britain’s power system

fishing boat and wind turbines

It’s no secret 2016 was a year of change. But beyond the high stakes political changes were events that indicate a shift of a similar size (if far less controversial) – the move to a decarbonised power network.

In the last three months of 2016 this change was characterised by four ‘firsts’ in the history of Britain’s power network. Each one signals a continuing trend that could offer a sign of what’s to come in the future.

The findings come from Electric Insights, a quarterly report from researchers at Imperial College London, commissioned by Drax. It tracks the rises and falls of the power generation system in England, Scotland and Wales, plus its environmental impact.

4_common_renewable_myths_full_size

1. Wind power reached record output but was down overall

One of the most interesting events was the way the wind blew – both a lot and not very much. 2016 was the first ever year that wind generated more power than coal. And a large part of that was thanks to the weather.

On the 23rd December, Storm Barbara hit the UK, bringing strong winds of up to 90 miles per hour. As a result, wind output produced more than 10GW for the first time ever, beating the previous record of 9.4GW set in 2014. At its peak, wind power met 37% of British demand, generating enough electricity for 15 million people – or everyone (and everything) north of Nottingham.

But despite these peaks, over the full quarter wind output was in fact 7% lower than the same time period in 2015. So while it was a quarter that showed how important a part of our power make up wind is right now and will be in the future, it also showed how much it depends on the weather.

The cliffs at Dover, UK

2. Britain exported more power to France than it imported

For the first time in six years Britain exported more electricity to France than it imported. Electricity flows between the two countries via an undersea interconnector called the Interconnexion France-Angleterre – and normally we accept more from the French nuclear generators and its other power sources than we send back. That changed at the end of 2016.

More than a dozen of France’s nuclear power stations where turned off after safety checks found a flaw in their design. While urgent maintenance took place during the last few months of 2016, British electricity generators exported power to meet French demand – taking advantage of higher-than-usual electricity prices on the other side of the English Channel. In fact, Britain exported more in one week in November than over the whole of 2014 and 2015 combined.

Coal spinner

3. Carbon emissions were at a 60-year low

Low carbon energy sources keep on rising as a proportion of the UK’s total output and in the last quarter of 2016 this meant carbon emissions fell to their lowest autumn level for 60 years. Overall in 2016, coal generation fell by 61% as a mixture of low gas prices and the Carbon Price Floor continued to force it off the system. Low carbon power sources grew to fill the gap, contributing an average of 40% of the UK’s power, while gas generation was up by more than 50%.

More than that, the quarter also saw another record – Britain’s cleanest Christmas in history. Up to 81% of Britain’s power was generated by low carbon sources, and the share of nuclear, biomass, hydro, wind and solar did not fall below 60% during the three days between Christmas Eve and Boxing Day.

8th November 2016 electricity peaked at more than £1500 per MWh

4. Electricity prices hit a new peak, but also dipped below zero

Electricity prices reached their highest in a decade: £1,528 per MWh. But they didn’t stay there – for nineteen hours during the quarter, they also dropped below zero. Negative energy prices occur when there is low demand and power being generated from inflexible sources (for example the current British nuclear fleet, plus wind and solar), exceeds the amount needed. When this happens, generators have to pay to offload the excess electricity, which means Elexon – the body that handles payments in the balancing market – is essentially managing a market that’s paying below zero for electricity.

These extremes raise the question of whether such price volatility is the new normal. As more renewable energy comes onto the network, its sensitivity to the elements increases, which in turn can increase volatility. The answer is: possibly.

A man at Drax Power Station looking at a biomass storage dome

What does this mean for the future?

The number of firsts in Britain’s power system signifies the scale of change it’s currently seeing. With the end date for coal coming ever closer, the country is increasingly realising the importance of exploring – and using – lower-carbon fuels to generate its electricity. Given the pace of change we’ve already seen, by the time we reach the last few months of 2017, Britain may well be welcoming in another new range of electricity firsts.

Explore the data in detail by visiting www.ElectricInsights.co.uk

Commissioned by Drax, Electric Insights is produced independently by a team of academics from Imperial College London, led by Dr Iain Staffell and facilitated by the College’s consultancy company – Imperial Consultants.

Your Christmas lights were powered by more renewables than ever before

A single strand of Icicle Christmas Lights.

Late into the evening of Christmas Day, 2016, millions of people sat down to watch Rowan Atkinson solve a grisly murder. It was the TV drama Maigret’s Dead Man, and although it wasn’t the most watched TV show on Christmas Day (that honour went to the Strictly Come Dancing finale), it did cause the biggest television-related sudden surge in electricity demand of the day, says Sumit Gumber, Energy Forecasting Analyst at National Grid.

During a critical ad break in the show, demand jumped 400 MW – roughly equivalent to 160,000 kettles being switched on – as viewers raced to make cups of tea or go to the bathroom. This is known as a TV pickup.

While this may have provided the biggest sudden rise in electricity usage of the day, it was not the overall peak. As is typical on Christmas Day, this year’s spike in demand came just before one o’clock, when families were preparing their festive feasts.

At 37.1 GW, this peak was not only lower than previous years, the power used to supply it was generated by more renewables than any Christmas before it. More than 40% of the electricity generated on Christmas Day came from renewable sources.

What characterises Christmas day?

Christmas is a day when electricity usage is at one of its lowest points. To put this year’s 37.1 GW peak into context, an average weekday during December (weekday electricity use is higher than on weekends) has an electricity peak of nearly 50 GW, usually occurring between five and seven o’clock, when people arrive home and street lighting is switched on.

The cause for the lower demand during Christmas is simple – over the festive period schools, as well as a number of offices, shops and factories are closed.

Over the last few years average Christmas Day demand has been fairly typical, sitting in a bracket of between 29 GW and 39 GW. In 2010, however, extreme cold (hitting minus three degrees Celsius) drove lunchtime peak demand as high as 46 GW, showing just how important a driver of our electricity use temperature is.

But while demand on Christmas in 2016 may not have deviated largely from the average over the last few years, there were some major leaps forward in how it was generated.

Winter landscape with wind turbines

A greener Christmas than ever before

This year, Christmas was characterised by a huge jump in renewable electricity generation.  On average, 12.4 GW came from renewable sources – more than ever before. Of that figure, wind contributed the most, generating on average 9.4 GW – equivalent to 31% of all power supplied on Christmas Day.

Compared to 2015 it’s a 63% increase and a staggering 195% uplift from five Christmases ago in 2012 when just 12% of all electricity generated came from renewable sources. Biomass generation has also increased, providing 2 GW in 2016 compared to the 0.5 GW it averaged on December 25th, 2012.

The increase in renewables also marks an important step towards decarbonisation: at its peak, emissions from electricity generation this 25th December were just 168 g/kWh, a significant drop compared to the 2012 peak of 506 g/kWh and the 303 g/kWh seen in 2015.

This year has been a year of impressive stats in clean energy: between July and September, for the first time in its 130-year-old history, more than half of Britain’s power came from low-carbon sources; on 5th May the UK did not burn any coal to generate electricity, the first time since 1881. Now, we’ve seen one of the cleanest Christmases on record. It’s a Christmas tradition that is likely to continue.

Biggest TV pick-ups, Christmas Day 2016


  1. Maigret’s Dead Man and EastEnders (22:30) – 400 MW (equivalent to 160,000 2.5 kW kettles switched on)

  2. Paul O’Grady: For the Love of Dogs at Christmas (19:45) – 275 MW (110,000 kettles)

  3. The Great Christmas Bake Off  (17:45) – 210 MW (84,000 kettles)

  4. Emmerdale and Doctor Who (18:45) – 200 MW (80,000 kettles)

Thanks to National Grid for this data

Explore how Britain was powered over the festive period by visiting electricinsights.co.uk.

Some like it hot: how temperature affects electricity prices

misty-british-county-landscape

In 2012, Europe faced an extreme cold wave. Temperatures in France dropped to minus four degrees Celsius, far below its average of five above.

As people huddled indoors, electric heaters were dialled up and lights were switched on. Electricity demand soared. It topped at 102 GW, surpassing the country’s previous peak by more than 20 GW. France had to import power from neighbouring countries.

The low temperatures drove demand so high the country couldn’t manage on its own. It’s something we see across the world – temperature peaks drive how and when we use electricity, increasing demand in the colder Northern European countries as the temperature falls, and acting inversely in hotter Southern countries.

But more than just driving up how much electricity we need, the temperature can affect how much we pay for it, too.

Putting a price on electricity

In the UK electricity is bought and sold by power generators, energy suppliers and the National Grid by the megawatt hour (MWh). One MWh is roughly enough power to boil 400 kettles and although prices fluctuate significantly, on average one MWh costs roughly £50 in the UK. In winter, when UK electricity demand peaks it’s estimated that for every degree the temperature drops below 15 Celsius, demand rises by 820 MW.

Electric Insights, an independent report produced by researchers at Imperial College London and commissioned by Drax via Imperial Consultants, looks at the UK’s publicly available electricity data and clearly shows the trend.

Electricity demand, temperature and prices

As the temperature drops, demand rises.

This raised demand affects the price of electricity in one obvious way: consumers’ bills rise because they’re using more of it. A less obvious impact is its effect on the production and supply cost of electricity from generator to the high voltage electricity transmission grid.

How temperature affects supply

In cold weather power plants work better. Cooling towers are more efficient, power cables are more conductive, and less energy is needed to help keep generating equipment from overheating. This all adds to small cost savings, which in turn can make electricity cheaper.

However, during colder weather the amount of gas used in the UK goes up – largely due to the rise in heating – which raises its price and this has a knock effect on electricity. For every 1p increase in the cost of gas, the cost of generating 1 MWh by a CCGT (combined cycle gas turbine) power station increases by around 70p. As CCGTs generate a large percentage of Britain’s electricity, the overall price of electricity also goes up.

But a bigger cost-determining factor is the increasing variety in today’s energy make up. Renewables like wind and solar are intermittent energy sources. Solar can’t function at night or when it’s overcast; wind turbines don’t rotate when it’s still, so when it is especially cold, dark or without much wind, the Grid needs to bring in additional flexible power generated by sources like biomass, gas and coal. These technologies can either deliver power to the Grid all the time – known as baseload – or just when demand rises, when they can be dialled up quickly.

But in the event of extreme weather, the demand for power can surge and the Grid needs to bring in additional generation capacity. In Britain, there are smaller power stations fuelled by diesel, oil or gas that lie dormant for much of the year but can start up at short notice to provide this boost of generation to meet demand.

Activating and running these plants quickly for short amounts of time can be expensive, and this can subsequently affect electricity price and lead to spikes in the winter.

Pylons in the countryside with the sun behind themThe effect on the bottom line

This leads to the following trend: for every degree Celsius the temperature falls below 10, there is a corresponding rise of £1.10 MWh. It is also possible for increases in temperature to cause increased prices, but this is usually in countries where air conditioners and electrically-powered cooling units are hooked up to their own national or regional electricity grid. For better or worse, this is not a problem that affects the UK, but it’s important to understand that maintaining grid stability will always have its costs, whatever the weather.


The cleanest year in Britain’s electricity

Cleanest year in Britain's electricity history

Amid the political upheaval that is characterising 2016 you may have missed the quiet victory of the UK’s low-carbon energy sector: for the first time ever, the third quarter (Q3) of 2016 saw more than 50% of the Britain’s power come from low-carbon energy sources. Five years ago, low-carbon sources made up just over a quarter.

This doesn’t necessarily mean that renewable energy sources made up the full 50% – in fact, nuclear made up a considerable chunk – but it hints at the big changes we’re seeing in the way the country is sourcing its power.

For one, it’s a further sign of coal’s diminishing life. During the period July to September 2012 coal supplied 38% of Britain’s electricity – during this year’s Q3 it supplied just 3%. As a result, per-unit carbon emissions from electricity consumption are at their lowest levels ever. The Carbon Price Floor – also known as the carbon tax and designed to assist energy companies like Drax invest in renewable and lower carbon generation – has played a big role in reducing coal’s contribution.

The findings come from Electric Insights, an independent report produced by researchers from Imperial College London and commissioned by Drax, that looks at the UK’s publicly available electricity data and aims to inform the debate on Britain’s electricity system.

Beyond the continued decline of coal, it shows there’s a growing diversity in low-carbon energy sources fuelling the country and that there’s a positive outlook for a cleaner electricity future.

Here we look at those low-carbon sources and how their use has changed over the last five years.

Nuclear produces 26% of Britain's power (Q3, 2016)

Nuclear

At 26% of the total, nuclear made up the largest proportion of low-carbon power generation across Q3 2016.

That was good news for the sector, which went through a turbulent summer after plans for the Hinkley Point C reactor were momentarily threatened following the dissolution of the Department for Energy and Climate Change (DECC) after the Brexit vote.

The eventual decision to continue with Hinkley C, however, means that more baseload nuclear power, in the form of large power stations and also possibly small modular nuclear reactors (SMRs), will be coming on to the system in the coming years. They will in the main replace older nuclear power stations set to be decommissioned.

Wind produces 10% of Britain's power (Q3, 2016)

Wind

Wind power made up 10% of total low-carbon power generation between July and September, and was the largest renewable source of the quarter.

As recently as 2011, electricity generated by wind accounted for just 4% of Britain’s low carbon energy supplies – a 150% increase in just five years. This is in part due to huge offshore projects such as the 630 MW London Array in the Thames Estuary and the 576MW Gwynt y Môr situated off the coast of North Wales, which have contributed to bringing the UK’s installed capacity to around 14 GW

The UK is now the world’s sixth largest producer of wind power behind China, the USA, India, Germany and Spain.

Solar produces 5% of Britain's power (Q3, 2016)

Solar

Following wind power as the second largest renewable contributor to the country’s low-carbon energy needs was solar.

Five years ago solar’s contribution was so negligible it didn’t even chart in the Electric Insights data. Fast forward to 2016 and Britain has a total installed solar capacity of nearly 10 GW. Again, this places the country sixth in the world for capacity behind China, Germany, Japan, the USA and Italy.

Biomass produces 4% of Britain's power (Q3, 2016)

Biomass

Biomass – a unique low-carbon fuel in that it can deliver both baseload and flexible power – made up 4% of the UK’s power needs in Q3 2016. A good proportion of that came from Drax, which has over the last five years been upgrading from coal to run on compressed wood pellets.

Like solar, biomass generation didn’t even chart in 2011, but today. In fact, between July and September biomass, along with solar and wind, supplied 20% of the country’s electricity – a huge proof point for the rise of renewables. Where biomass sits apart from those two sources, however, is that it isn’t dependent on weather and even though the country has less much less biomass generation capacity than the two intermittent technologies, it produces nearly as much energy as them. This makes it an ideal baseload partner for sources that do (i.e. wind and solar) as it can be dialled up and down to meet the energy demand of the country in seconds.

In the future there’s potential to increase this biomass capacity while saving bill payers money. Three of Drax’s six generating units run on biomass, but if all were to be upgraded as they could be in less than three years – Drax plus Lynemouth power station and one or two smaller biomass power stations – could generate roughly 10% of Britain’s electricity using compressed wood pellets by the time unabated coal power stations come off the system before the end of 2025.

Hydro produces 1% of Britain's power (Q3, 2016)

Hydro

Hydropower made up just 1% of Britain’s power generation over the quarter. However, this is still up by 20% since 2011, when hydropower contributed just 0.8%. Total installed hydropower capacity is around 1.65GW.

However, studies have found the country has a potential hydropower capacity of close to double this amount, but as many of these sources are located in mountainous, rural landscape areas of natural importance, it’s doubtful whether hydropower will be deployed up to its full capabilities in the coming years.

Closing an historic year

May the 5th was an historic day in the UK – it was the first time since 1881 Britain burnt no coal to produce its electricity. It wasn’t an isolated incident, either. In the third quarter of 2016 Britain was completely coal free for nearly six days.

It’s a situation that is likely to continue in the future as low carbon energy sources – and in particular renewables – continue to grow in the country’s energy makeup. The outlook is a positive one. 2016 may have been the cleanest year in UK electricity we’ve seen so far, but it won’t be the cleanest year ever.

Explore the data in detail by visiting ElectricInsights.co.uk

Commissioned by Drax, Electric Insights is produced independently by a team of academics from Imperial College London, led by Dr Iain Staffell and facilitated by the College’s consultancy company – Imperial Consultants.