Tag: sustainability

What is bioenergy with carbon capture and storage (BECCS)?

What is bioenergy with carbon capture and storage (BECCS)? 

Bioenergy with carbon capture and storage (BECCS) is the process of capturing and permanently storing carbon dioxide (CO2) from biomass (organic matter) energy generation.

Why is BECCS important for decarbonisation? 

When sustainable bioenergy is paired with carbon capture and storage it becomes a source of negative emissions, as CO2 is permanently removed from the carbon cycle.

Experts believe that negative emissions technologies (NETs) are crucial to helping countries meet the long-term goals set out in the Paris Climate Agreement. As BECCS is the most scalable of these technologies this decade, it has a key role to play in combating climate change.

How is the bioenergy for BECCS generated?

Most bioenergy is produced by combusting biomass as a fuel in boilers or furnaces to produce high-pressure steam that drives electricity-generating turbines. Alternatively, bioenergy generation can use a wide range of organic materials, including crops specifically planted and grown for the purpose, as well as residues from agriculture, forestry and wood products industries. Energy-dense forms of biomass, such as compressed wood pellets, enable bioenergy to be generated on a much larger scale. Fuels like wood pellets can also be used as a substitute for coal in existing power stations.

How is the carbon captured?

BECCS uses a post-combustion carbon capture process, where solvents isolate CO2 from the flue gases produced when the biomass is combusted. The captured CO2 is pressurised and turned into a liquid-like substance so it can then be transported by pipeline.

How is the carbon stored?

Captured CO2 can be safely and permanently injected into naturally occurring porous rock formations, for example unused natural gas reservoirs, coal beds that can’t be mined, or saline aquifers (water permeable rocks saturated with salt water). This process is known as sequestration.

Over time, the sequestered CO2 may react with the minerals, locking it chemically into the surrounding rock through a process called mineral storage.

BECCS fast facts

Is BECCS sustainable?

 Bioenergy can be generated from a range of biomass sources ranging from agricultural by-products to forestry residues to organic municipal waste. During their lifetime plants absorb CO2 from the atmosphere, this balances out the CO2that is released when the biomass is combusted.

What’s crucial is that the biomass is sustainably sourced, be it from agriculture or forest waste. Responsibly managed sources of biomass are those which naturally regenerate or are replanted and regrown, where there’s a increase of carbon stored in the land and where the natural environment is protected from harm.

Biomass wood pellets used as bioenergy in the UK, for example, are only sustainable when the forests they are sourced from continue to grow. Sourcing decisions must be based on science and not adversely affect the long-term potential of forests to store and sequester carbon.

Biomass pellets can also create a sustainable market for forestry products, which serves to encourage reforestation and afforestation – leading to even more CO2 being absorbed from the atmosphere.

Go deeper:

  • The triple benefits for the environment and economy of deploying BECCS in the UK.
  • How BECCS can offer essential grid stability as the electricity system moves to low- and zero-carbon sources.
  • Producing biomass from sustainable forests is key to ensuring BECCS can deliver negative emissions.
  • 5 innovative projects where carbon capture is already underway around the world
  • 7 places on the path to negative emissions through BECCS

Evaluating regrowth post-harvest with accurate data and satellite imagery

  • Drax has been using effective post-harvest evaluations, which includes remote sensing technology and satellite imagery

  • Alongside sustainable forest management, monitoring can help support rapid regrowth after harvesting

  • Evidence shows healthy managed forests with no signs of deforestation or degradation

As part of Drax’s world-leading programme of demonstrating biomass sustainability, including ongoing work on catchment area analysis (CAA), responsible sourcing policy and healthy forest landscapes (HFL). We have also been trialling the use of high-resolution satellite imagery to monitor forest conditions on specific harvesting sites in the years after harvesting has taken place, in addition to the catchment area level monitoring of trends and data. Post-harvest evaluations (PHE) are an essential part of an ongoing sustainability monitoring process, ensuring that the future forest resource is protected and maintained and that landowners restore forests after harvesting to prevent deforestation or degradation.

The most effective form of PHE is for an experienced local forester to walk and survey the harvesting site to check that new trees are growing and that the health and quality of the young replacement forest is maintained.

Rapid regrowth

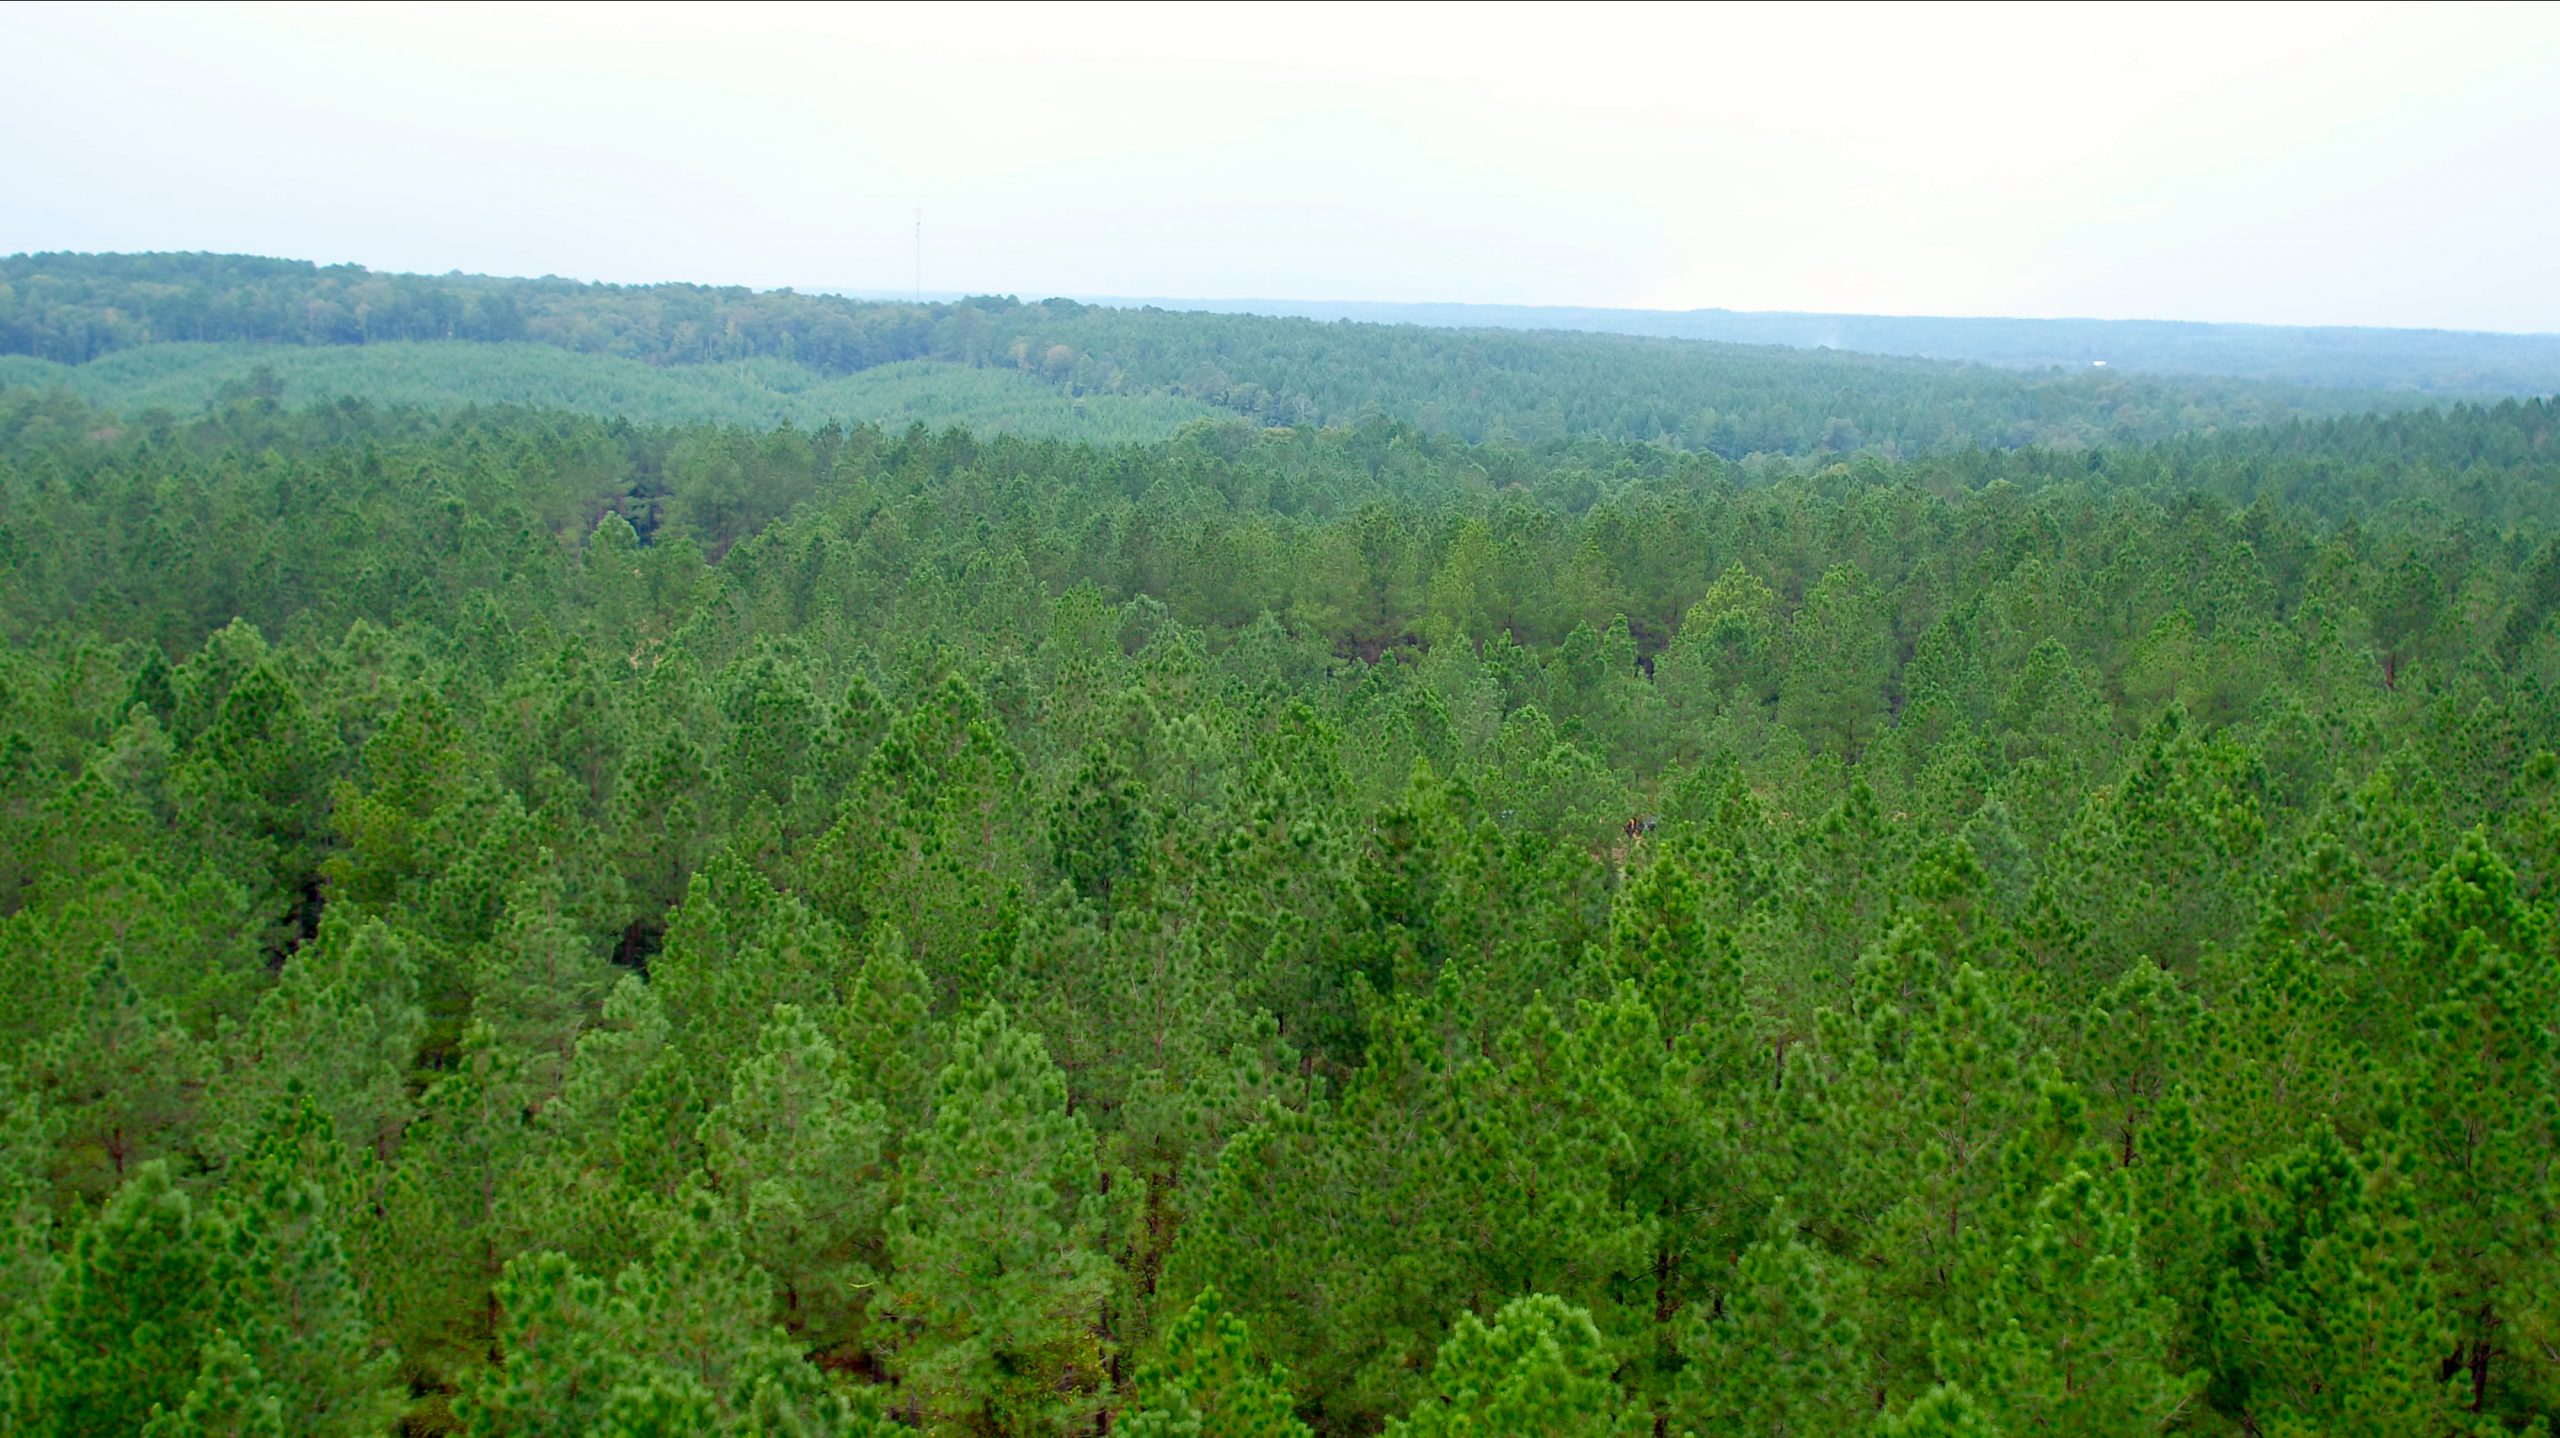
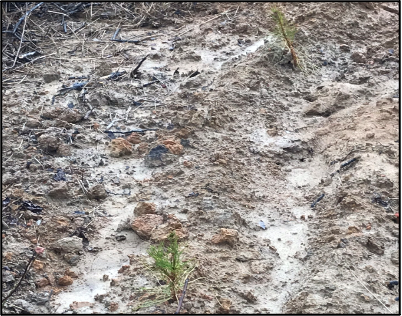
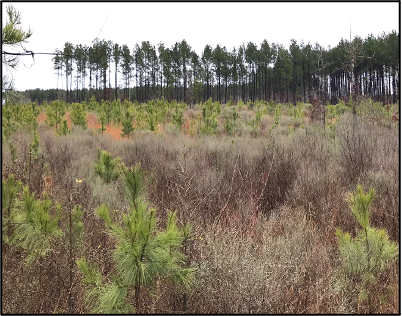
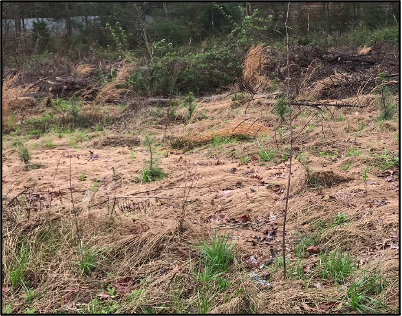
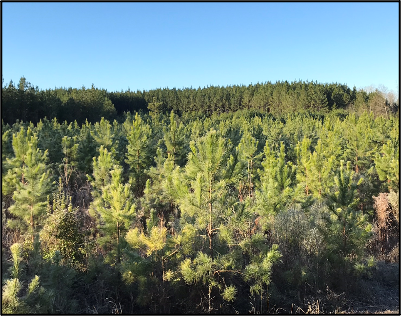
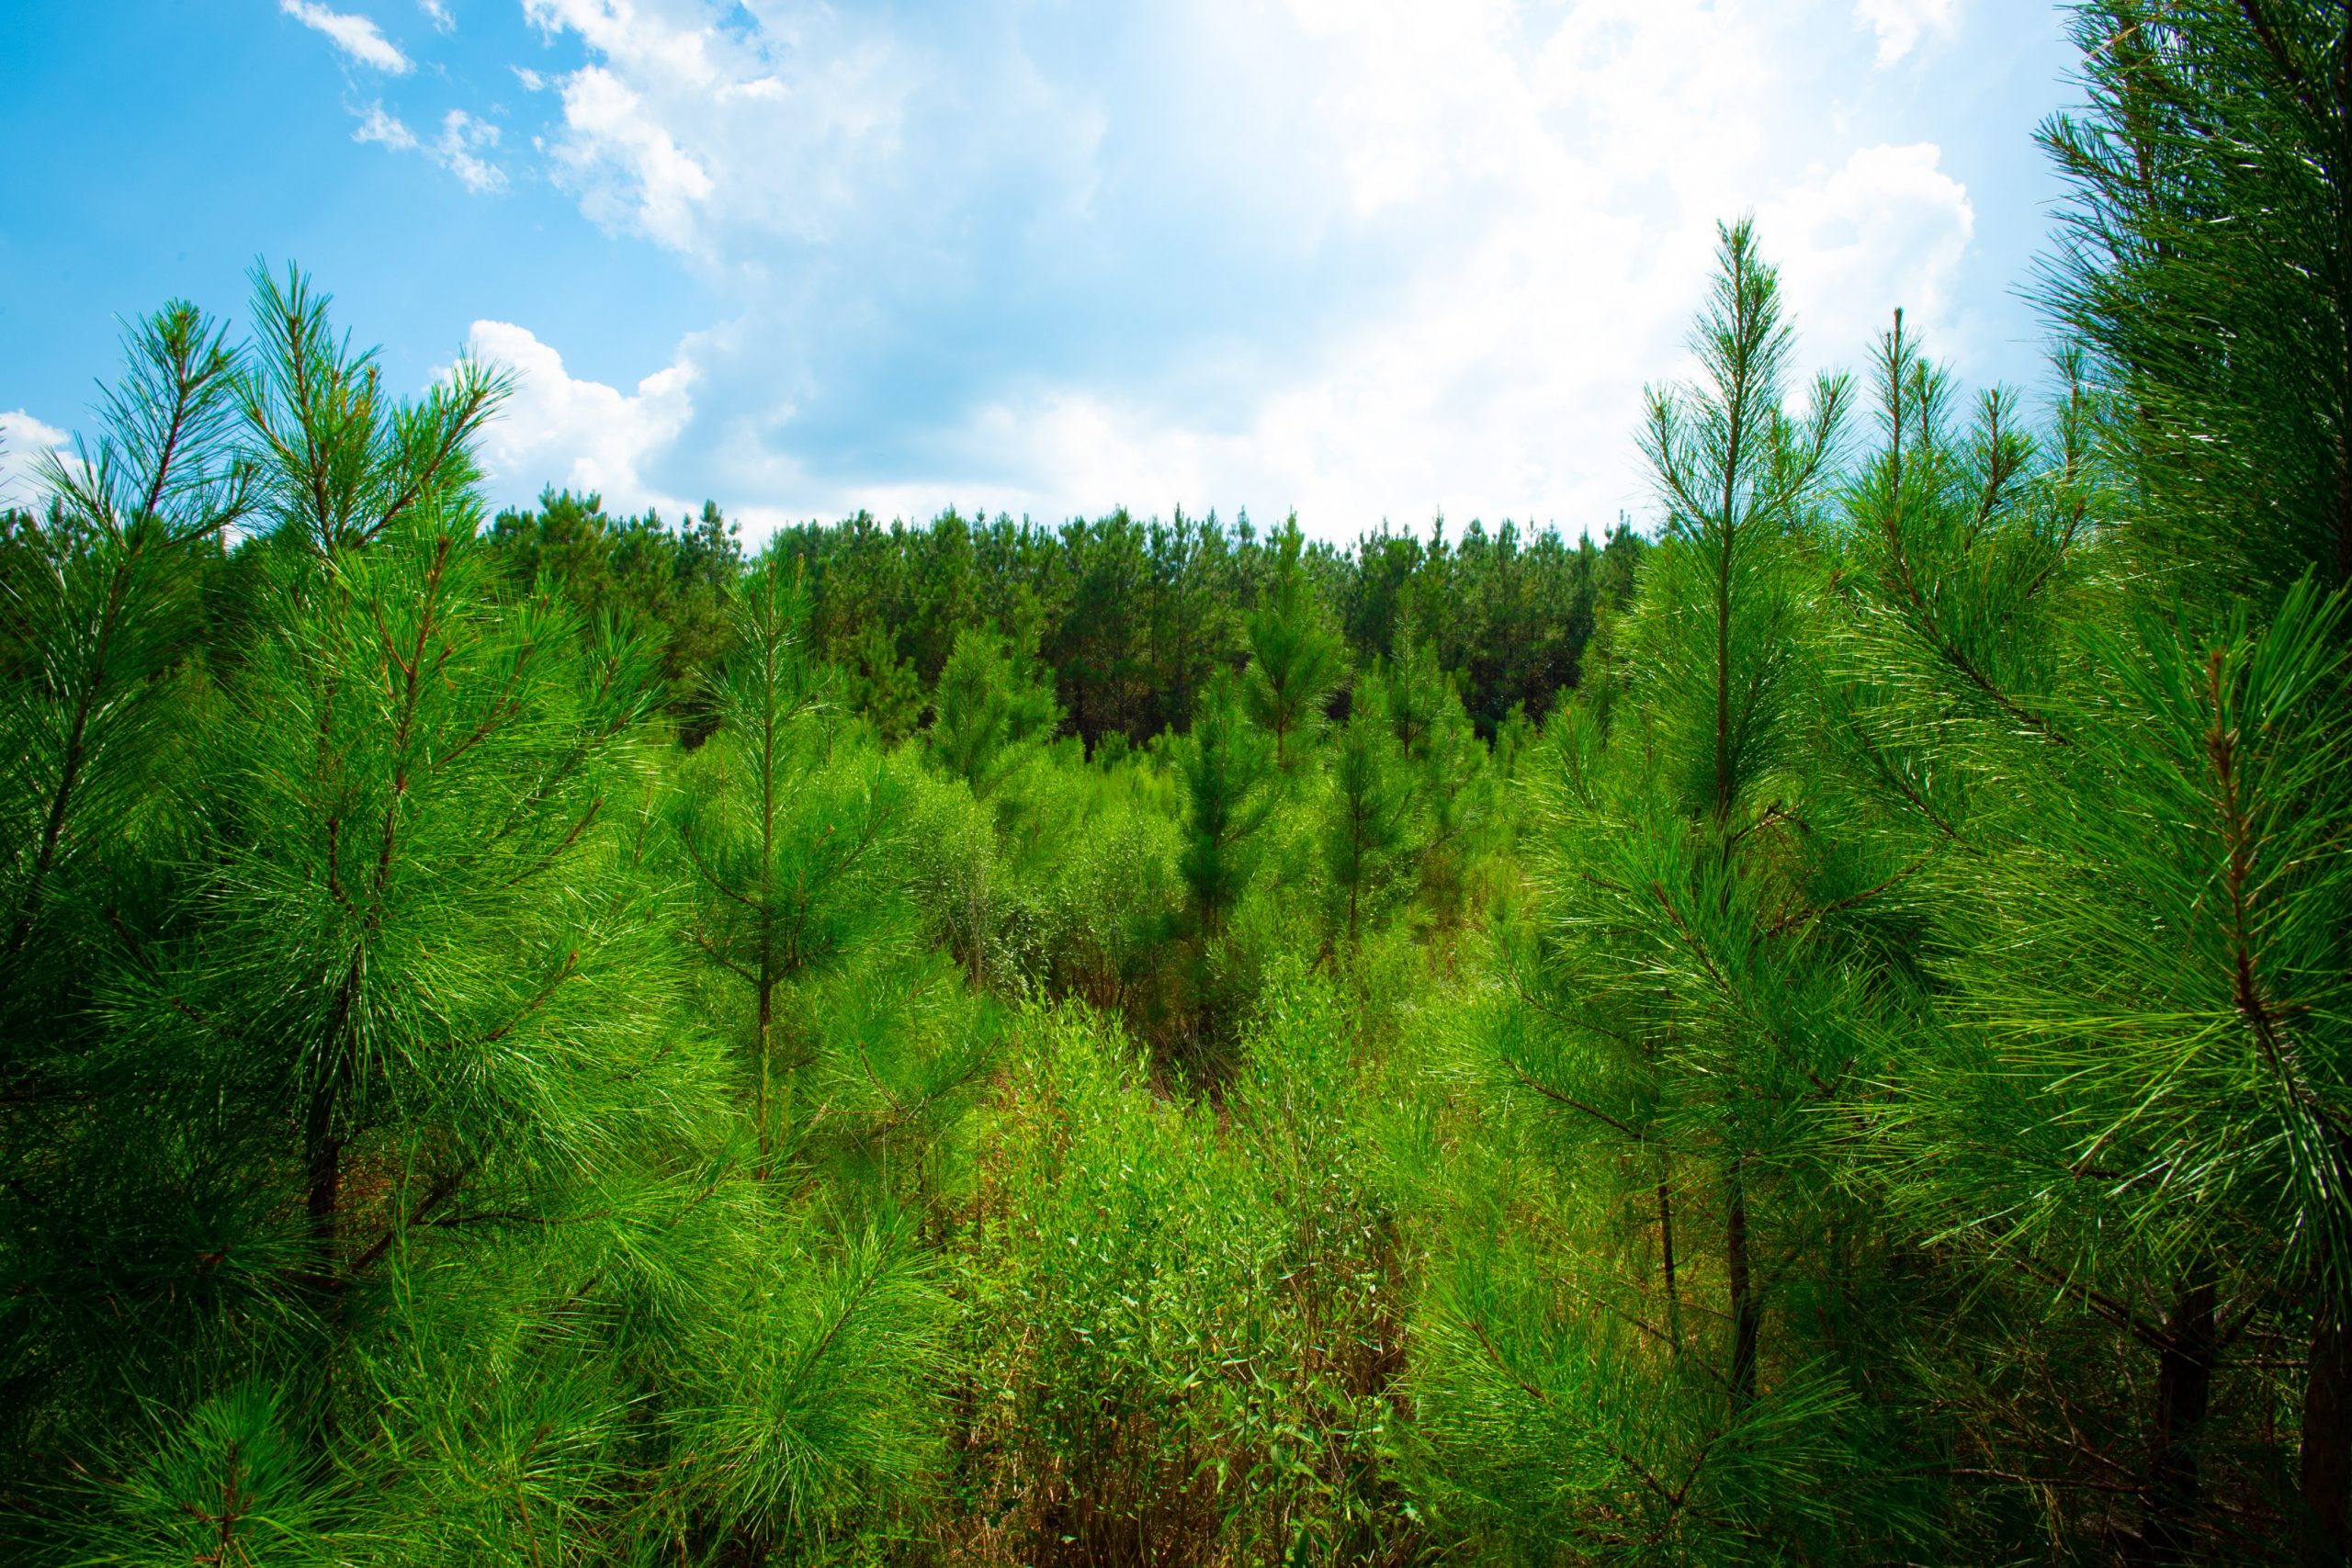
The images below show some of the sites surrounding Drax’s Amite Bioenergy pellet plant in Mississippi, with trees at various stages of regrowth in the years after harvesting.

A full site inspection can therefore enable a forester to determine whether the quantity and distribution of healthy trees is sufficient to make a productive forest, equivalent to the area that was harvested. It can also identify if there are any health problems, pest damage or management issues such as  weed growth or water-logging that should be resolved.

Typically, this will be the responsibility of the forest owner or their forest manager and is a regular part of ongoing forest management activity. This degree of survey and assessment is not practical or cost-effective where a third-party consumer of wood fibre purchases a small proportion (typically 20-25 tonnes per acre) of the low-grade fibre produced at a harvest as a one-off transaction for its wood pellet plant..  It is time consuming to walk every acre of restocked forest and it is not always possible to get an owner’s permission to access their land.

Forests from space

Therefore, an alternative methodology is required to make an assessment about the condition of forest lands that have been harvested to supply biomass, without the need to physically inspect each site.  One option is to use remote sensing and satellite imagery to view each harvested site in the years after biomass sourcing, this helps to monitor restocking and new tree growth.

Drax has been testing the remote sensing approach using Maxar’s commercial satellite imagery.  Maxar has four satellites on orbit that collect more than three million square kilometres of high-resolution imagery every day. Drax accesses this imagery through Maxar’s subscription service SecureWatch.

To test the viability of this methodology, Drax has been looking at harvesting sites in Mississippi that supplied biomass to the Amite Bioenergy pellet plant in 2015 and in 2017.  As part of the sustainability checks that are carried out prior to purchasing wood fibre, Drax collects information on each harvesting tract. This includes the location of the site, the type of harvest, the owner’s long-term management intentions and species and volume details.

This data can then be used at a later date to revisit the site and monitor the condition of the area. Third-party auditors, for instance Through Sustainable Biomass Program (SBP) certification, do visit harvesting sites, however this is typically during the year of harvest rather than after restocking. Maxar has historical imagery of this region from 2010, which is prior to any harvesting for wood pellets.  The image below shows a harvesting site near the pellet plant at Gloster, Mississippi, before any harvesting has taken place.

March 2010 (100m)

Satellite image © 2021 Maxar Technologies.

The image below shows the same site in 2017 immediately following harvesting.

December 2017 (100m)

Satellite image © 2021 Maxar Technologies.

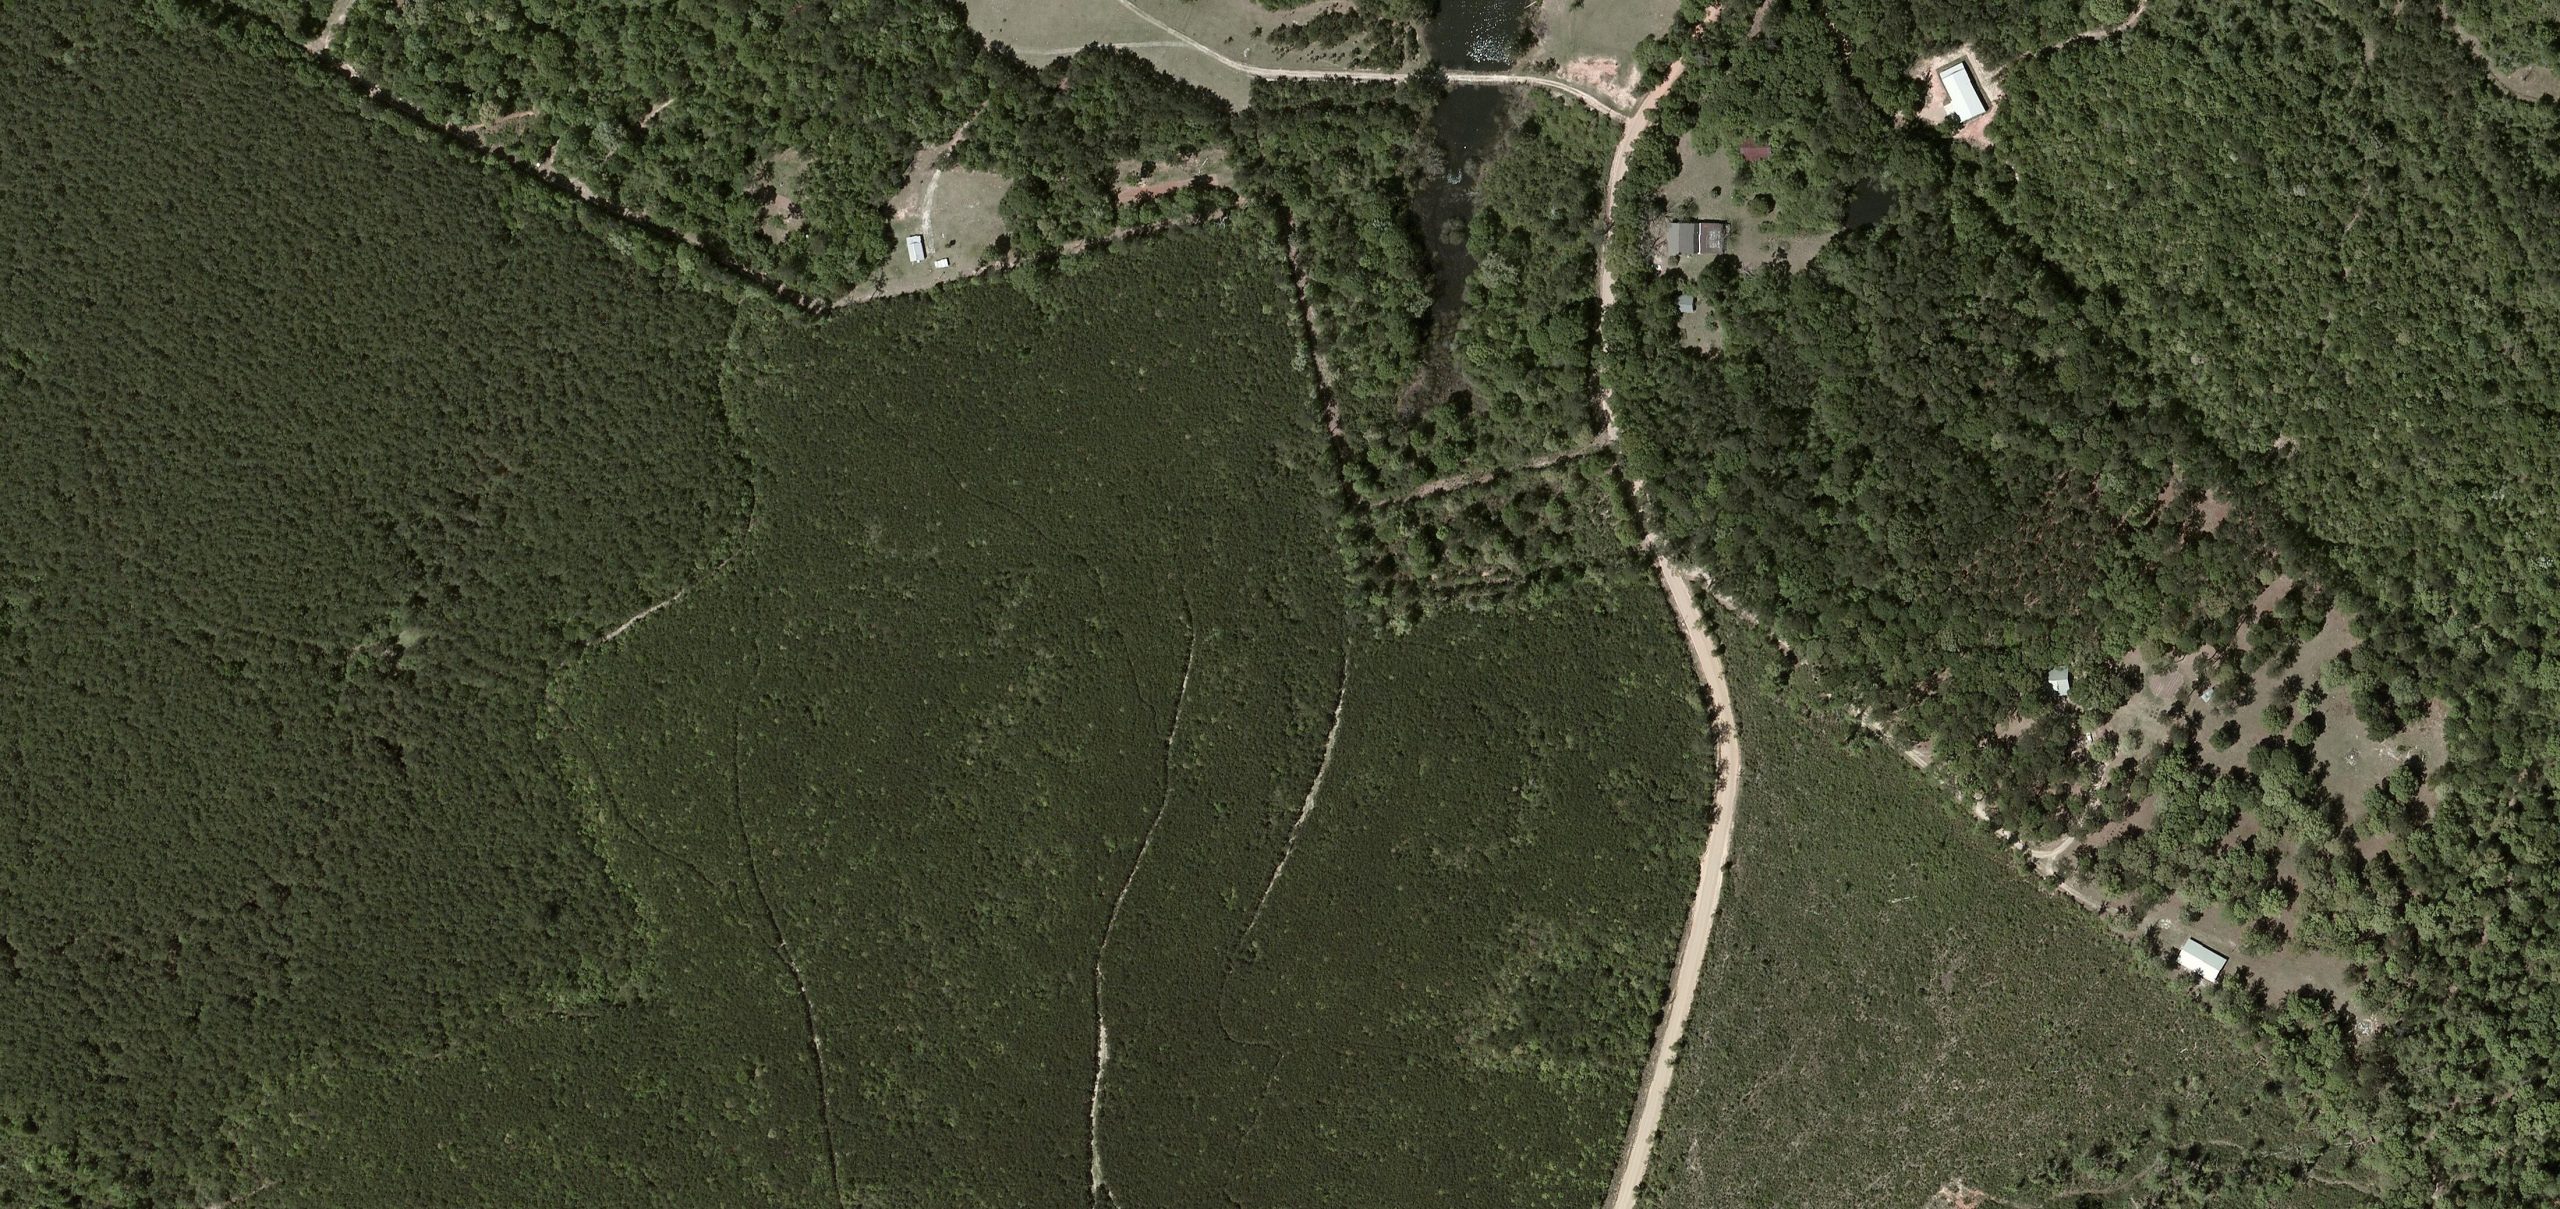
If we look again at this same site three years after harvesting, we can see the rows of trees that have been planted and the quality of the regrowth. This series of images demonstrates that this harvested area has remained a forest, has not been subject to deforestation and that the regrowth appears to be healthy at this stage.

August 2020 (50m)

Satellite image © 2021 Maxar Technologies.

Another site in the Amite catchment area is shown below. The image shows a mature forest prior to harvesting, the site has been previously thinned as can be seen from the thinned rows that are evident in the imagery.

May 2010 (200m)

Satellite image © 2021 Maxar Technologies.

Looking at the same site in the year after harvesting, the clear cut area can be seen clearly. Some green vegetation cover can also be seen on the harvested area, but this is weed growth rather than replanted trees. Some areas of mature trees have been left at the time of harvesting, and are visible as a grey colour in the 2010 image. These are likely to be streamside management zones that have been left to maintain biodiversity and to protect water quality, with the grey winter colouring suggesting that they are hardwoods.

September 2018 (200m)

Satellite image © 2021 Maxar Technologies.

Three years after the harvest, in a zoomed in view from the previous image, clear rows of replanted trees can be seen in the imagery.  This demonstrates that the owner has successfully restocked the forest area and that the newly planted forest appears healthy and well established.

August 2020 (50m)

Satellite image © 2021 Maxar Technologies.

While examining different harvesting sites in satellite imagery, Drax noted that not every site had evidence of tree growth, particularly within the first three years after harvesting. Deliberate conversion of land to non-forest use, such as for conversion to pasture, agricultural crops or urban development, is likely to be evident fairly soon after harvesting.

Preparing for planting

Some forest owners like to leave a harvested site unplanted for a couple of years to allow ground vegetation and weed growth to establish, this can then be treated to ensure that trees can be planted and that the weed growth does not impede the establishment of the new forest, this process can mean that trees are not visible in satellite imagery for three to four years after harvesting.

The image below shows a site three years after harvesting with no evidence of tree growth.  Given that no conversion of land use is evident and that the site appears to be clear of weed growth, this is likely to be an example of where the owners have waited to clear the site of weeds prior to replanting.  This site can be monitored in future imagery from the Maxar satellites to ensure that forest regrowth does take place.

November 2020 (100m)

Satellite image © 2021 Maxar Technologies.

Drax will continue to use Maxar’s SecureWatch platform to monitor the regrowth of harvesting sites and will publish more detailed results and analysis when this process has been developed further.  The platform allows ongoing comparison of a site over time and could prove a more efficient method of analysis than ground survey.  In conjunction with the CAA and HFL work, PHE can add remote sensing as a valuable monitoring and evidence-gathering tool to demonstrate robust biomass sustainability standards and a positive environmental impact.

Go deeper: 

Discover the steps we take to ensure our wood pellet supply chain is better for our forests, our planet and our future here, how to plant more trees and better manage them, our responsible sourcing policy for biomass from sustainable forests and a guide to sustainable forest management of the Southern Working Forest.

Global collaboration
is key to tackling
the climate crisis

Leaders from 40 countries are meeting today, albeit virtually, as part of President Joe Biden’s Leaders’ Summit on Climate. The event provides an opportunity for world leaders to reaffirm global efforts in the fight against climate change, set a clear pathway to net zero emissions, while creating jobs and ensuring a just transition.

Since taking office President Biden has made bold climate commitments and brought the United States back into the Paris Agreement. Ahead of the two-day summit, he announced an ambitious 2030 emissions target and new Nationally Determined Contributions. The US joins other countries that have announced significant reduction goals. For example, the EU committed to reduce its emissions by at least 55%, also South Korea, Japan and China have all set net-zero targets by mid-century.

Here in the UK, Prime Minister Boris Johnson this week outlined new climate commitments that will be enshrined in law. The ambitious new targets will see carbon emissions cut by 78% by 2035, almost 15 years earlier than previously planned. If delivered, this commitment which is in-line with the recommendations of the Climate Change Committee’s sixth carbon budget will put the UK at the forefront of climate action, and for the first time the targets include international aviation and shipping.

What makes climate change so difficult to tackle is that it requires collaboration from many different parties on a global scale never seen before. As a UK-North American sustainable energy company, with communities on both sides of the Atlantic, at Drax we are keenly aware of the need for thinking that transcends borders, creating a global opportunity for businesses and governments to work together towards a shared climate goal. That’s why we joined other businesses and investors in an open letter supporting the US government’s ambitious climate actions.

Collaboration between countries and industries

It’s widely recognised that negative emissions technologies will be key to global efforts to combat climate change.

At Drax we’re pioneering the negative emissions technology bioenergy with carbon capture and storage (BECCS) at our power station in North Yorkshire, which when up and running in 2027 will capture millions of tonnes of carbon dioxide (CO2) per year, sending it for secure storage, permanently locking it away deep under the North Sea.

Experts on both sides of the Atlantic consider BECCS essential for reaching net zero. The UK’s Climate Change Committee says it will play a major role in removing CO2 emissions that will remain in the UK economy after 2050 from industries such as aviation and agriculture that will be difficult to fully decarbonise. Meanwhile, a report published last year by New York’s Columbia University revealed that rapid development of BECCS is needed within the next 10 years in order to curb climate change and a recent report from Baringa, commissioned by Drax, showed it will be a lot more expensive for the UK to reach its legally binding fifth carbon budget between 2028 and 2031 without BECCS.

A shared economic opportunity

Globally as many as 65 million well-paid jobs could be created through investment in clean energy systems. In the UK, BECCS and negative emissions are not just essential in preventing the impact of climate change but will also be a key component of a post-Covid economy.

Government and private investments in clean energy technologies can create thousands of well-paid jobs, new careers, education opportunities and upskill workforces. Developing BECCS at Drax Power Station, for example, would support around 17,000 jobs during the peak of construction in 2028, including roles in construction, local supply chains and the wider economy. It would also act as an anchor project for the Zero Carbon Humber initiative, which aims to create the world’s first net zero industrial cluster. Developing a carbon capture, usage, and storage (CCUS) and hydrogen industrial cluster could spearhead the creation and support of tens of thousands of jobs across the Humber region and more than 200,000 around the UK in 2039.

Under the Humber Bridge

Additional jobs would be supported and created throughout our international supply chain. This includes the rail, shipping and forestry industries that are integral to rural communities in the US South and Western Canada.

A global company

As a British-North American company, Drax embodies the positive impact that clean energy investments have. We directly employ 3,400 people in the US, Canada, and the UK, and indirectly support thousands of families through our supply chains on both sides of the Atlantic. Drax is strongly committed to supporting the communities where we operate by investing in local initiatives to support the environment, jobs, education, and skills.

From the working forests of the US South and Western Canada to the Yorkshire and Humber region, and Scotland, we have a world-leading ambition to be carbon negative by 2030. At Drax, we believe the challenge of climate change is an opportunity to improve the environment we live in. We have reduced our greenhouse gas emissions by over 80% and transformed into Europe’s largest decarbonisation project. Drax Power Station is the most advanced BECCS project in the world and we stand ready to invest in this cutting-edge carbon capture and removal technology. We can then share our expertise with the rest of the world – a world where major economies are committing to a net zero future and benefiting from a green economic recovery.

If we are to reach the targets set in Paris, global leaders must lock in this opportunity and make this the decade of delivery.

The world’s leading sustainable biomass generation and supply business

Today we completed a transformational deal – our acquisition of Canadian biomass pellet producer Pinnacle Renewable Energy.

I’m very excited about this important acquisition and welcoming our new colleagues to the Drax family – together we will build on what we have already achieved, having become the biggest decarbonisation project in Europe and the UK’s largest single site renewable power generator as a result of us using sustainable biomass instead of coal.

The deal positions Drax as the world’s leading sustainable biomass generation and supply business – making us a truly international business, trading biomass from North America to Europe and Asia. It also advances our strategy to increase our self supply, reduces our biomass production costs and creates a long-term future for sustainable biomass – a renewable energy source that the UN’s IPCC says will be needed to achieve global climate targets.

It’s also an important milestone in Drax’s ambition to become a carbon negative company by 2030 and play an important role in tackling the global climate crisis with our pioneering negative emissions technology BECCS.

That’s because increasing our annual production capacity of sustainable biomass while also reducing costs helps pave the way for our plans to use bioenergy with carbon capture and storage (BECCS) at Drax.

Negative emissions from BECCS are vital to address the global climate emergency while also providing the renewable electricity needed for a net zero economy, supporting jobs and clean growth in a post-Covid recovery.

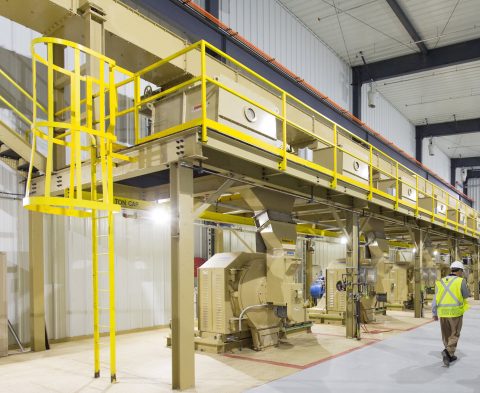
Inside a Pinnacle pellet mill

Inside a Pinnacle pellet mill

We already know Pinnacle well – it is one of our key suppliers and the company is a natural fit with Drax.

Our new colleagues have a wealth of operational and commercial expertise so I’m looking forward to seeing what we can achieve together.

We will benefit from Pinnacle’s scale, operational efficiency and low-cost fibre sourcing, that includes a high proportion of sawmill residues. In 2019, Pinnacle’s production cost was 20% lower than Drax’s.

Completing this deal will increase our annual production capacity to 4.9 million tonnes of sustainable biomass pellets at 17 plants in locations across Western Canada and the US South – up from 1.6Mt now.

It also expands our access to three major North American fibre baskets and four export facilities, giving us a large and geographically diversified asset base, which enhances our sourcing flexibility and security of supply.

This positions us well to take advantage of the global growth opportunities for sustainable biomass. The market for biomass wood pellets for renewable generation in Europe and Asia is expected to grow in the current decade, principally driven by demand in Asia.

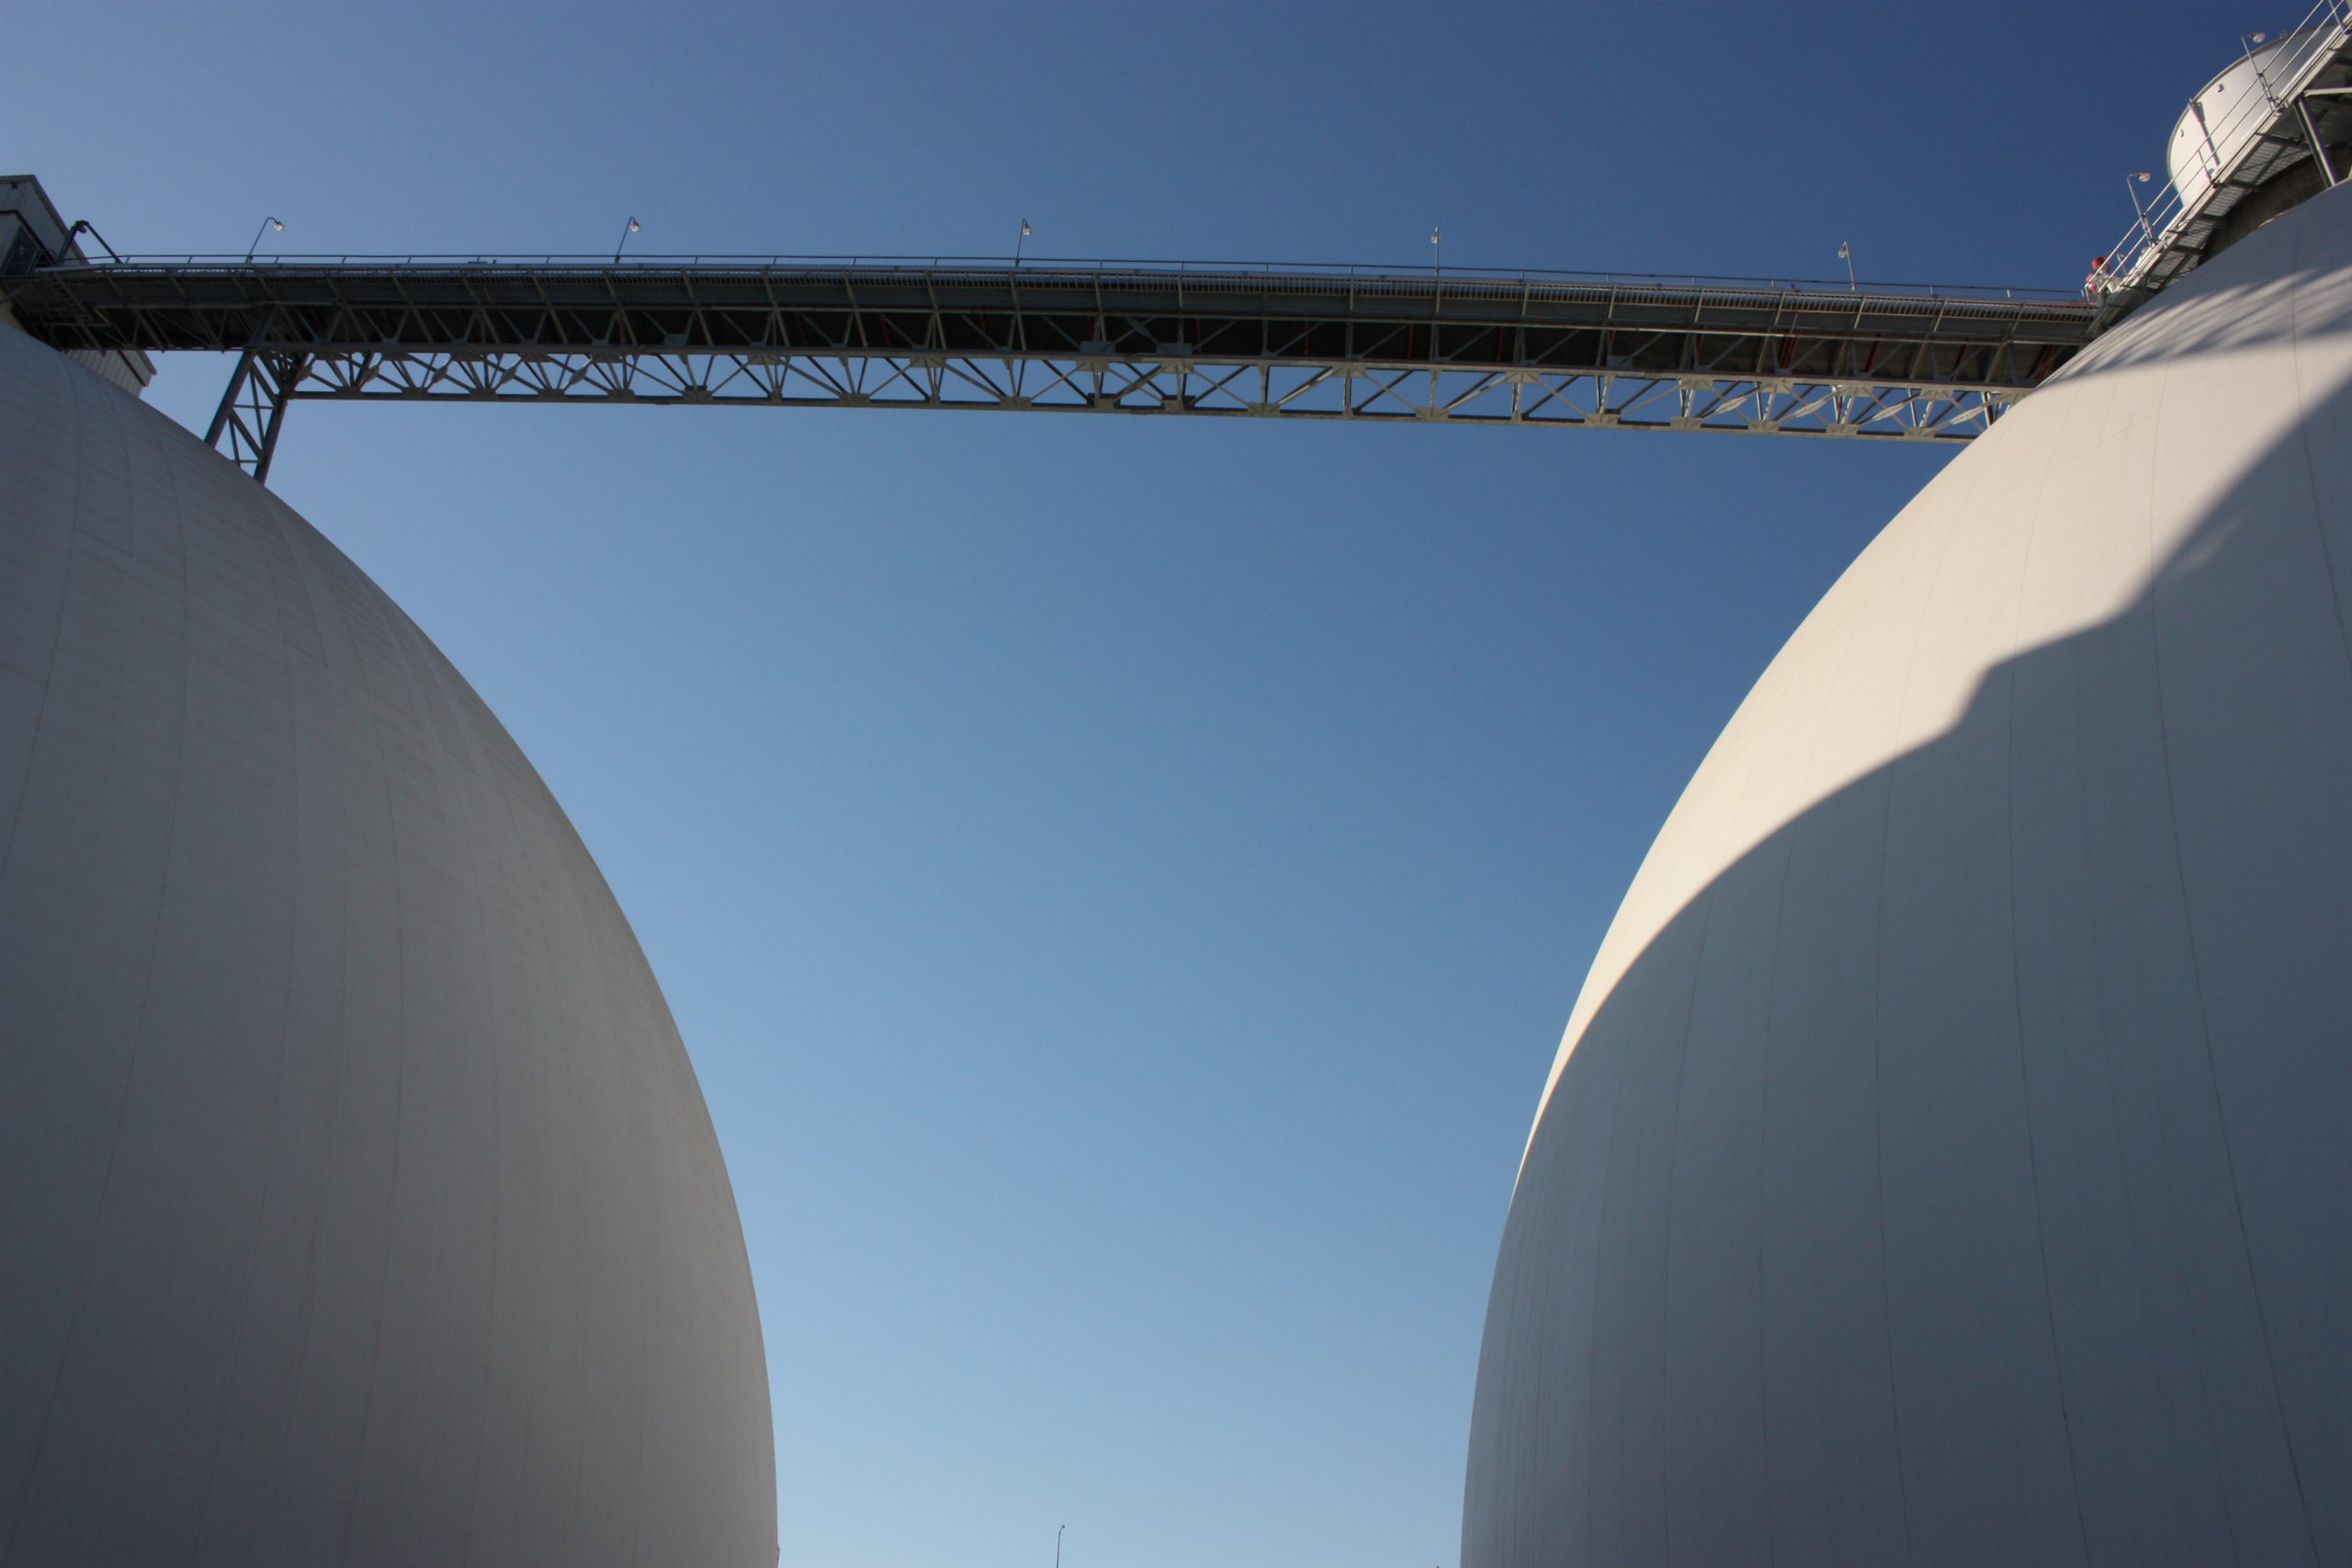
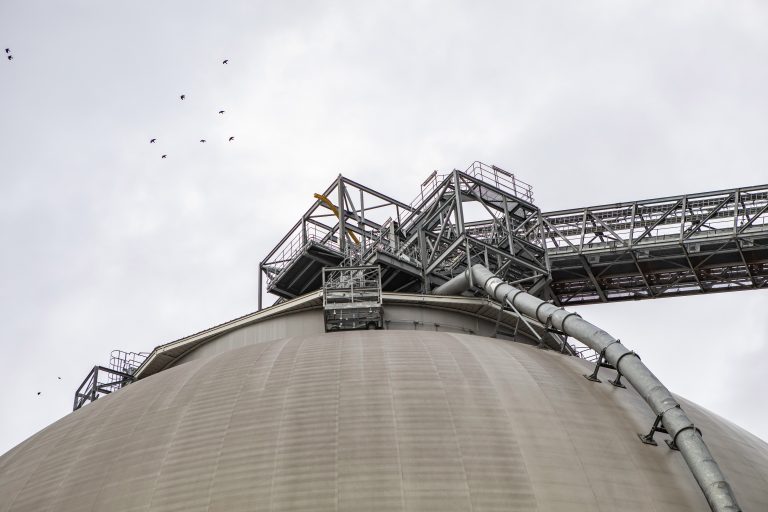
Biomass wood pellet storage dome, Drax Power Station

Biomass wood pellet storage dome, Drax Power Station

We believe that with increasingly ambitious global decarbonisation targets, the need for negative emissions and improved understanding of the role that sustainably sourced biomass can play, will result in continued robust demand.

Pinnacle is already a key supplier of wood pellets to other markets with C$6.7 billion of long-term contracts with high quality Asian and European customers, including Drax, and a significant volume contracted beyond 2027.

Drax aims to leverage Pinnacle’s trading capability across its expanded portfolio. We believe that the enlarged supply chain will provide greater opportunities to optimise the supply of biomass from its own assets and third-party suppliers.

The transport and shipping requirements of the enlarged company will provide further opportunities to optimise delivery logistics, helping to reduce distance, time, carbon footprint and cost.

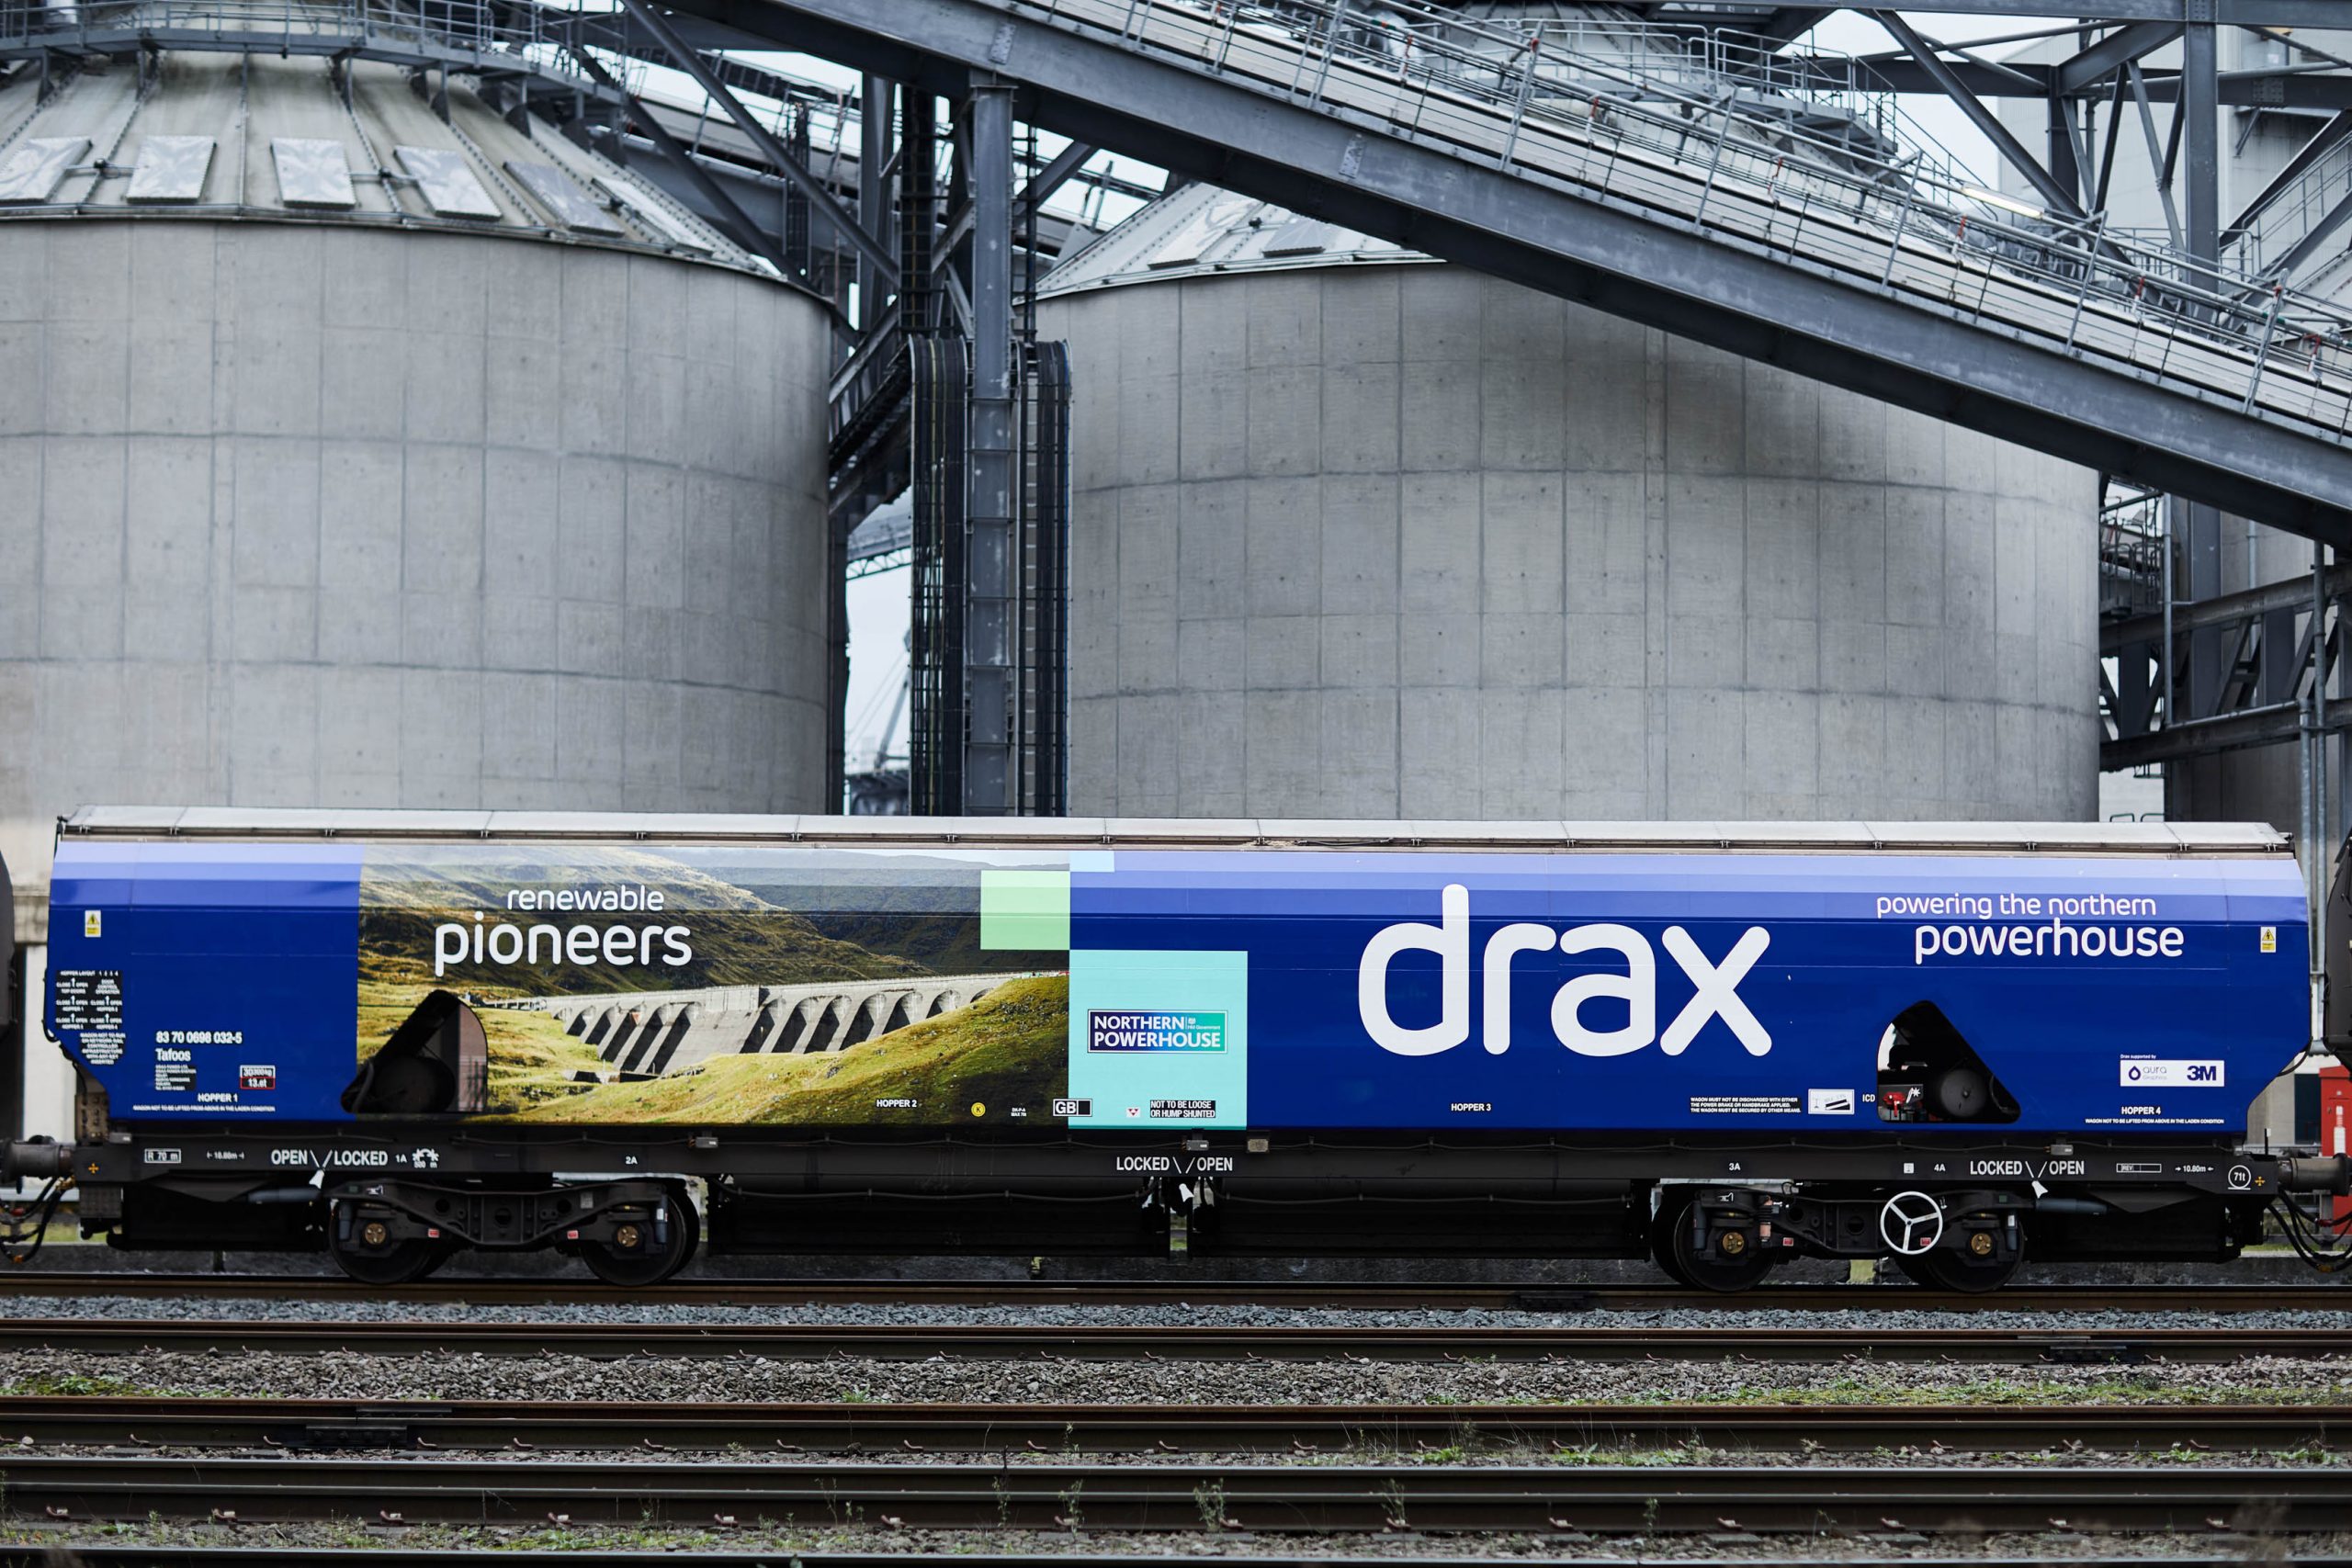
Train transporting biomass wood pellets arriving at Drax Power Station

Importantly – there will also be opportunities to share best practice and drive sustainability standards higher across the group.

We recognise that the forest landscape in British Columbia and Alberta is different to the commercially managed forests in the south eastern US where we currently operate.

In line with our world leading responsible sourcing policy, Drax will work closely with environmental groups, Indigenous First Nation communities and other stakeholders and invest to deliver good environmental, social and climate outcomes in Pinnacle’s sourcing areas.

We are determined to create a long-term future for sustainable biomass and deliver BECCS –  the negative emissions technology that will be needed around the world to meet global climate targets. The acquisition of Pinnacle takes us a big step forward in achieving our goals.


Read press release: Drax completes acquisition of Pinnacle Renewable Energy Inc.


What is renewable energy?

These differ to non-renewable energy sources such as coal, oil and natural gas, of which there is a finite amount available on Earth, meaning if used excessively they could eventually run out.

Renewable resources can provide energy for a variety of applications, including electricity generation, transportation and heating or cooling.

The difference between low-carbon, carbon neutral and renewable energy

Renewables such as wind, solar and hydropower are zero carbon sources of energy because they do not produce any carbon dioxide (CO2) when they generate power. Low-carbon sources might produce someCO2, but much less than fuels like coal.

Bioenergy that uses woody biomass from sustainably managed forests to generate electricity is carbon neutral because forests absorb CO2 from the atmosphere as they grow, meaning the amount of CO2 in the atmosphere remains level. Supply chains that bring bioenergy to power stations commonly use some fossil fuels in manufacturing and transportation. Therefore woody biomass is a low carbon fuel, when its whole lifecycle is considered.

Managing forests in a sustainable way that does not lead to deforestation allows bioenergy to serve as a renewable source of power. Responsible biomass sourcing also helps forests to absorb more carbon while displacing fossil fuel-based energy generation.

Nuclear is an example of a zero carbon source of electricity that is not renewable. It does not produce CO2,but it is dependent on uranium or plutonium, of which there is a finite amount available.

Managing forests in a sustainable way that does not lead to deforestation allows bioenergy to serve as a renewable source of power.

How much renewable energy is used around the world?

Humans have harnessed renewable energy for millions of years in the form of woody biomass to fuel fires, as well as wind to power ships and geothermal hot springs for bathing. Water wheels and windmills are other examples of humans utilising renewable resources, but since the industrial revolution fossil fuels, coal in particular, have been the main source of power.

However, as the effects of air pollution and CO2 produced from burning fossil fuels become increasingly apparent, renewable energy is gradually replacing sources which contribute to climate change.

In the year 2000 renewable energy accounted for 18% of global electricity generation, according to the IEA. By 2019, renewable sources made up 27% of the world’s electrical power.

Why renewable energy is essential to tackling climate change

The single biggest human contribution to climate change is greenhouse gas emissions, such as CO2, into the atmosphere. They create an insulating layer around the planet that causes temperatures on Earth to increase, making it less habitable.

Renewable sources of electricity can help to meet the world’s demand for power without contributing to global warming, unlike carbon-intensive fuels like coal, gas and oil.

Bioenergy can also be used to remove CO2 from the atmosphere while delivering renewable electricity through a process called bioenergy with carbon capture and storage (BECCS).

Forests absorb CO2 from the atmosphere, then when the biomass is used to generate electricity the same CO2 is captured and stored permanently underground – reducing the overall amount of CO2 in the atmosphere.

Humans have used renewable energy for millions for years, from wood for fires to wind powering boats to geothermal hot springs. 

What’s holding renewables back?

The world’s energy systems were built with fossil fuels in mind. This can make converting national grids difficult and installing new renewable energy sources expensive. However, as knowledge grows about how best to manufacture, build and operate renewable systems, the cost of deploying them at scale drops.

There are future changes needed. Renewables such as wind, solar and tidal power are known as intermittent renewables because they can’t generate electricity when there is no sun, wind or the tidal movement. For future energy systems to deliver enough power, large scale energy storage, as well as other flexible, reliable forms of generation will also be needed to meet demand and keep systems stable.

Renewable energy key facts:  

Go deeper

Georgia Mill Cluster catchment area analysis

Forest in LaSalle catchment area

The seventh report in a series of catchment area analyses for Drax looks at the fibre sourcing area surrounding a number of compressed wood pellet plants operated by Georgia Biomass (now owned by Enviva) and Fram Renewable Fuels.

The evidence found in the report by Hood Consulting shows a substantial increase in forest inventory (stored carbon) and a relatively stable forest area. However, with continued pressure from urban development, future losses of timberland area are possible.  Despite this, increasing growth rates can maintain and improve wood supply and carbon stock for the foreseeable future.

Increasing forest growing stock and carbon sequestration

The overall inventory of growing stock in the catchment area has increased by 63 million cubic metres (m3) between 2000 and 2018, a growth of 19.3%.  All of this increase has been in the pine area, which increased by nearly 68 million m3, whereas the hardwood species decreased in volume by 4.5 million m3. Overall, the inventory volume split by species in 2018 was 72% to 28% softwood to hardwood. The breakdown by product category is shown in Figure 3 below.

Figure 1: Change in growing stock by major product category and species (USFS)

The pine saw-timber and chip-n-saw product categories, larger dimension and higher value material, showed the largest increase in inventory, whereas pine pulpwood decreased in total volume.  The most substantial change occurred from 2010 to 2018, where pulpwood went from an increasing trend to a decreasing trend and saw-timber increased in volume much more rapidly – this is shown in Table 1 and Figure 2 below.

Change (cubic metres (m3))Pine SawtimberPine Chip-n-sawPine PulpwoodHardwood SawtimberHardwood PulpwoodTotal
2000-201851,301,62822,277,139-5,835,2301,211,110-5,657,11463,297,533
2000-201014,722,99512,707,6745,262,192-3,740,507-5,76989923,182,455
2010-201836,578,6329,569,465-11,097,4224,951,618112,78440,115078
Table 1: Change in growing stock volume by major product category (USFS)

These changes are likely to reflect an increasing age class in the catchment area, with younger stands of pine (previously classed as pulpwood), growing into a larger size class and being reclassified as saw-timber.  This means that the volume of saw-timber availability in future will be significantly higher, but pulpwood availability will be diminished.  For pellet mill markets any loss in pulpwood availability can be compensated by an increase in sawmill residue production if market demand is maintained or increased.

Figure 2: Change in growing stock by major product category and species (USFS)

Growth rates for both softwood and hardwood species have been increasing since 2000 as shown in Figure 3 below. Softwood growth has increased by 18.5% since 2000 and hardwood by 1.4%. The improved softwood growth rate probably resulted from increased investment in the management of pine forests, the superior quality of seedlings and better management practice (ground preparation, weed control, fertilisation etc.). This is a very positive trend for the sequestration rate of carbon and also for providing landowners with the potential to increase revenue per hectare and encourage the retention and improved management of forests, rather than converting to other land uses. The Georgia catchment area is likely split between passive owners that do not actively manage, where growth rates are slower or decline and the incentive to convert land is greater, and owners that actively manage to improve growth and quality, increasing revenue and maintaining productive forest.  There is likely to be a much greater differential in growth rate between these two management approaches than reflected by the trend in Figure 3, highlighting the importance of active management for carbon abatement.

Average annual growth rate per hectare (USFS)

Figure 3: Average annual growth rate per hectare (USFS)

Stable forest area

At a macro scale, the distribution of land use categories has remained relatively stable since 2000, with no apparent major shifts in land use. The timberland area around the seven mills has decreased by around 135 thousand hectares (ha) between 2000 and 2018 (2.3% of the total land area), whilst the area of arable and urban land increased by 98 thousand (1.7% of total area) and 158 thousand (2.7% of total area) ha respectively.  In 2018, timberland represented 67% of total land area and all forest and woodland 80% of total area, down from 69% and 82% respectively in 2000 (Figure 1).

Change in land use category (USDA)

Figure 4: Change in land use category (USDA)

Looking at this change in land use more closely, the timberland area shows the most pronounced decline between 2010 and 2018, a drop of 117 thousand ha. The largest change in other land use categories over this period was an increase of 97 thousand ha in urban and other land, suggesting that a large proportion of the timberland area has been converted to urban areas.
LaSalle Bioenergy forest area

The most significant change in agricultural land occurred prior to 2010, when the timberland area remained relatively stable, this change appears to have involved the transition of pastureland to arable crops. There may also have been some reclassification of forest and woodland types, with a decrease in the area of woodland and an increase in forestland during the period between 2000 and 2010 (Table 2).

Change (hectares (ha))TimberlandOther ForestlandArable CroplandWoodlandPasturelandUrban & Other Land
2000-2018-135,19570,07398,436-77,904-113,725178,315
2000-2010-18,53953,15073,243-73,077-95,63060,852
2010-2018-116,65616,92225,193-4,827-18,09697,463
Table 2: Timing of land use change in Georgia catchment area (USDA)

These trends are also clear and apparent in Figure 3 below which shows the sharp decline in timberland area, albeit small in absolute area relative to the total catchment area size, and the steady increase in urban land.  Georgia ranks 8th in the list of US States and territories by total population with 10.6 million and 17th by population density at 184 per square mile (mi2) compared to just 63 per mi2  in Mississippi where Drax’s Amite Bioenergy (ABE) pellet plant is located and 108 per mi2 in Louisiana where the Morehouse Bioenergy (MBE) and LaSalle Bioenergy (LBE) mills are located (US Census Bureau). This population pressure and increased development can lead to more forest loss and land use change.

Trends in major land use categories (USDA)

Figure 5: Trends in major land use categories (USDA)

Drax’s suppliers in the Georgia catchment area have made a commitment not to source wood from areas where land use change is taking place. This commitment is monitored and verified through the Sustainable Biomass Program (SBP) certification process that is maintained by each mill.  Any land use change in the catchment area is likely to be a result of prevailing economic drivers in the region rather than due to actions being taken by the pellet producers.

Increasing demand and surplus forest growth

Strong markets are essential for ensuring that forests are managed and restocked to optimum benefit, sawlog markets are particularly important as this is highest revenue stream for forest owners. Figure 6 shows the trend in market demand for each major product category since 2000 and demonstrates the recent increase in softwood sawlog demand as the US economy (particularly housing starts) recovered from the global recession at the end of the last decade. Softwood pulpwood demand increased through the 2000s but has remained relatively stable since 2011, with the exception of a peak during 2018 which resulted from an increase in volume generated by salvage operations after hurricane Michael.

Figure 6: Demand for wood products (USFS, TMS)

Figure 6: Demand for wood products (USFS, TMS)

The comparison of average annual growth and removals in the Georgia catchment area is much more tightly balance than in Drax’s other supply regions, as shown in Figure 7. Since 2000 the average annual surplus of growth has been around 3.6 million m3 with both demand and growth increasing in recent years.

Figure 7: Average annual growth, removals and surplus (USFS)

Figure 7: Average annual growth, removals and surplus (USFS)

As shown in Figures 2 & 3, growth rates are strong and inventory is increasing, this is not a problem in the Georgia area.  The relatively small surplus, as compared to other catchment areas in the US South, is due to the higher concentration of wood fibre markets and the more intense forest industry activity in this region.  As of July 2020, there were over 50 major wood-consuming mills operating within the Georgia catchment area and an additional 80+ mills operating within close proximity, overlapping the catchment area.  Total pulpwood demand in 2019 was 12.9 million tons, of which approximately 87% was attributed to non‐bioenergy‐related sources (predominantly pulp/paper) and 13% was attributed to the bioenergy sector.  Given the bio-energy sector’s low ranking position in the market (with the lowest ability to pay for fibre), combined with the relatively small scale in demand compared to the pulp and paper industry, the influence of biomass markets can be considered to be minimal in this region, particular when it comes to impacts on wood prices and forest management practice.

Wood price trends

Pine sawtimber prices suffered a significant decline between 2000 and 2010, dropping almost $21 per ton as a result of the global financial crisis and the decline in demand due to the collapse in housing markets and construction (Table 3).  Since 2010 pine sawtimber has remained relatively stable, with some minor fluctuations shown in Figure 8 below.

Change ($/ton)Pine SawtimberPine Chip-n-sawPine PulpwoodHardwood SawtimberHardwood Pulpwood
2000-2019-$20.92$15.14$5.95$12.55$4.70
2000-2010-$20.92-$21.41$2.11$11.25$5.67
2010-2019$0.00$6.27$3.84$1.30-$0.97
Table 3: Stumpage price trends (TMS)

Pine pulpwood prices have been on a generally increasing trend since 2000, with a more significant increase since 2011.  This increase does not reflect an increase in demand or total volume, which has remained relatively stable over this period, but a shifting of the geographic distribution of the market with some new mills opening and old mills closing, resulting in increased competition in some localised fibre baskets and leading to an overall increase in stumpage price.

Figure 8: Stumpage price trends (TMS)

Figure 8: Stumpage price trends (TMS)

Figure 9 below shows that, with the exception of the hurricane salvage volume in 2018, pulpwood removals have declined or remained relatively stable since 2010, whereas pulpwood stumpage prices increased by 41% from 2010 to 2018.

Figure 9: Pulpwood demand and stumpage price (USFS, TMS)

Figure 9: Pulpwood demand and stumpage price (USFS, TMS)

Comparing this stumpage price trend with other catchment areas of the US South (Figure 10), where Drax sources wood pellets, the Georgia area is on average 35% higher than the next highest area (Chesapeake) and 87% higher than the lowest cost area (Amite Bioenergy in Mississippi).  This price differential is predominantly due to the scale of demand and availability of surplus low-grade fibre.

Figure 10: Comparison of pine pulpwood stumpage prices in Drax supply areas US South (TMS)

Figure 10: Comparison of pine pulpwood stumpage prices in Drax supply areas US South (TMS)

Hood Consulting summary of the impact of the seven pellet plants on key trends and metrics in this catchment area.

Is there any evidence that bioenergy demand has caused the following…

Deforestation?

No. US Forest Service (USFS) data shows a 108,130-hectare (-2.6%) decrease in total timberland in the Georgia catchment area since Georgia Biomass’ first full year of production in 2012. Specifically, this loss in total area of timberland coincided with a more than 21,000-hectare increase in cropland/pastureland and a more than 73,000-hectare increase in urban land and land classified as having other uses.

However, there is little evidence to suggest that increased wood demand from the bioenergy sector has caused this decrease in total timberland. Furthermore, pine timberland – the primary source of roundwood utilized by the bioenergy industry – has increased more than 17,000 hectares in the catchment area since 2016.

A change in management practices (rotation lengths, thinnings, conversion from hardwood to pine)?

No. Changes in management practices have occurred in the catchment area over the last two decades. However, there is little evidence to suggest that bioenergy demand, which accounts for roughly 10-14% of total pulpwood demand (and only 5-7% of total wood demand in the catchment area), has caused or is responsible for these changes.

Clearcuts and thinnings are the two major types of harvests that occur in this region, both of which are long-standing, widely used methods of harvesting timber. TimberMart-South (TMS) data shows that thinnings accounted for 67% of total reported harvest area in the southeast Georgia market from 2000-2010, but only 43% of total harvest area reported from 2012-2019. Specifically, this downward shift was initiated by the bursting of the US housing bubble in the mid-2000s and had been completed by the early 2010s. We’d like to note that this shift coincided with a nearly 50% decrease in pine sawtimber stumpage price from 2006-2012. This is important because the strength of pine sawtimber markets had been a driving force behind timber management decisions in this region in the early and mid-2000s.

Also, contributing to the decreased prevalence of thinnings was the strengthening of pine pulpwood markets in the mid-2000s, as pine pulpwood stumpage prices increased more than 40% in the Georgia catchment area from 2003-2008. So, with sawtimber markets continuing to weaken and pulpwood markets doing just the opposite, the data suggests that many landowners decided to alter their management approach (to take advantage of strong pulpwood markets) and focus on short pulpwood rotations that typically do not utilize thinnings.

Ultimately, the shift in management approach that occurred in this market can be linked to the weakening of one type of timber market and the strengthening of another. In the early and mid-2000s, timber management was focused on sawtimber production – a type of management that utilizes thinnings. However, for more than a decade now, this market has been driven to a large degree by the pulp/paper industry, with a significant portion of the timber management in this area focused on short pulpwood rotations.

Diversion from other markets?

No. Demand for softwood (pine) sawlogs increased an estimated 39% in the Georgia catchment area from 2011-2019. Also, increased bioenergy demand has caused no diversion from other pulpwood markets (i.e. pulp/paper), as pulpwood demand not attributed to bioenergy held steady and remained nearly unchanged from 2012-2017 before increasing in 2018 and 2019 due to the influx of salvage wood brought about by Hurricane Michael.

We’d like to make special note that increased demand for softwood sawlogs since 2011 has not resulted in a full pine sawtimber (PST) stumpage price recovery in this market. Reduced demand for softwood sawlogs in the late 2000s and early 2010s resulted in oversupply, and this oversupply has remained, despite increased demand the last 6-8 years. As a result, PST stumpage prices have held steady and averaged roughly $30 per ton in the catchment area since 2013 – down approximately 35% from the 2000-2006 average of more than $46 per ton, but up roughly 15% from the 2011-2012 average of approximately $26 per ton.

An unexpected or abnormal increase in wood prices?

No / Inconclusive. The delivered price of pine pulpwood (PPW) – the primary roundwood product consumed by both Georgia Biomass and Fram – increased 26% in the Georgia catchment area over the six years directly following the startup of Georgia Biomass, increasing from $29.16 per ton in 2011 to $36.63 per ton in 2017. And while this 26% increase in delivered PPW price coincided with a roughly 1.1 million metric ton increase in annual pine pulpwood demand from Georgia Biomass and Fram, total demand for pine pulpwood (from both bioenergy and other sources) actually decreased 7% over this period. Moreover, evidence suggest that this increase in PPW price is more closely linked to changes in wood supply, specifically, the 9% decrease in PPW inventory from 2011-2017.

However, there is evidence that links increased demand from the bioenergy sector to an increase in secondary residual (i.e. sawmill chips, sawdust, and shavings) prices. Specifically, the price of pine sawmill chips – a residual feedstock utilized by the bioenergy industry for wood pellet production – held steady and averaged approximately $26 per ton in the Georgia catchment area from 2008-2012. However, from 2012-2016, pine sawmill chip prices increased more than 15% (to $29.55 per ton in 2016). This increase in price coincided with annual pine residual feedstock purchases by Georgia Biomass and Fram increasing from roughly 325,000 metric tons to nearly 1.0 million metric tons over this period. However, note that pine sawmill chip prices have held steady and averaged roughly $29.50 per ton in the catchment area since 2016, despite further increases in pine secondary residual purchases by Georgia Biomass and Fram (to more than 1.2 million metric tons in 2019).

Ultimately, the data suggests that any excess supply of pine secondary residuals in the catchment area was absorbed by the bioenergy sector in the early and mid-2010s, and the additional demand/competition placed on this market led to increased residual prices. However, the plateauing of residual prices since 2015 along with the continued increase in secondary residual purchases by Georgia Biomass and Fram further suggest that an increasing percentage of secondary residual purchases by the bioenergy sector is sourced from outside the catchment area. Specifically, Fram confirmed this notion, noting that 35-40% of its secondary residual purchases come from outside the Georgia catchment area (from six different states in the US South).

A reduction in growing stock timber?

No. Total growing stock inventory in the catchment area increased 11% from 2011 through 2018, the latest available. Specifically, over this period, inventories of pine sawtimber and chip-n-saw increased 35% and 13%, respectively. However, pine pulpwood inventory decreased 11% from 2011-2018.

Note that the decrease in pine pulpwood inventory was not due to increased demand from bioenergy (or other sources) or increased harvesting above the sustainable yield capacity of the forest area – as annual growth of pine pulpwood has exceeded annual removals every year since 2011. Rather, this decrease can be linked to the 24% decline in pine sawtimber removals that occurred from 2005-2014 (due to the bursting of the US housing bubble and Great Recession that followed). In this region, timber is typically harvested via clearcut once it reaches maturity (i.e. sawtimber grade), after which the stand is reestablished, and the cycle repeated. However, with the reduced harvest levels during this period also came a reduction in newly reestablished timber stands – the source of pine pulpwood. So, with less replantings occurring during this period, inventories of pine pulpwood were not replenished to the same degree they had been previously, and therefore this catchment area saw a reduction in pine pulpwood inventory levels.

However, according to the US Forest Service, annual removals of pine sawtimber have increased 50% in the Georgia catchment area since 2014, which would suggest higher clearcut levels and increased stand reestablishment. TimberMart-South data also supports this assertion, as clearcut harvests have constituted approximately 60% of the total harvest area reported to TimberMart-South in this region since 2014, compared to 40% from 2005-2014. Ultimately, these increases in clearcut (and stand reestablishment) levels may not be reflected in increased pine pulpwood inventory levels in the short term – as it can take more than 10 years for a pine seedling to become merchantable and reach the minimum diameter requirements to be classified as pulpwood. However, adequate supply levels are expected to remain in the meantime. Furthermore, pine pulpwood inventory levels are expected to increase in the mid-to-long terms as a result of the increased harvest levels and stand reestablishment levels that have occurred in the catchment area since 2014.

A reduction in the sequestration rate of carbon?

No / Inconclusive. US Forest Service data shows the average annual growth rate of total growing stock timber has remained nearly unchanged (holding between 6.0% and 6.1%) in the catchment area since 2011, which would suggest that the sequestration rate of carbon has also changed very little in the catchment area the last 8-10 years. However, the 11% increase in total growing stock inventory since 2011 does indicate that total carbon storage levels have increased in the Georgia catchment area since Georgia Biomass commenced operations in this market.

An increase in harvesting above the sustainable yield capacity of the forest area?

No. Growth-to-removals (G:R) ratios, which compare annual timber growth to annual harvests, provides a measure of market demand relative to supply as well as a gauge of market sustainability. In 2018, the latest available, the G:R ratio for pine pulpwood, the predominant timber product utilized by the bioenergy sector, equaled 1.06 (a value greater than 1.0 indicates sustainable harvest levels). Note, however, that the pine pulpwood G:R ratio averaged 1.44 from 2012-2017. The significant drop in 2018 was due to a 31% increase in removals (due to Hurricane Michael) and is not reflective of the new norm. Specifically, pine pulpwood removals are projected to be more in line with pre-2018 levels in 2019 and 2020, and so too is the pine pulpwood G:R ratio.

Timber growing stock inventory

Neutral. According to USFS data, inventories of pine pulpwood decreased 11% in the catchment area from 2011-2018. However, that decrease was not due to increased demand from bioenergy. Typically, a reduction in inventory is linked to harvest levels above the sustainable yield capacity of the forest area, but in this case, annual growth of pine pulpwood exceeded annual removals every year during this period.

Ultimately, the decrease in pine pulpwood inventory from 2011-2018 can be linked to decreased pine sawtimber production beginning in the mid-2000s. Specifically, annual removals of pine sawtimber decreased 24% from 2005-2014, and the reduction in harvest levels during this period meant fewer new pine stands were reestablished, and that has led to the current reduction in pine pulpwood inventory. (Note that the decrease in pine sawtimber removals from 2005-2014 was mirrored by a 27% increase in pine sawtimber inventory over this same period). However, USFS data shows that annual removals of pine sawtimber have increased 50% in the Georgia catchment area since 2014, which suggests that pine pulpwood inventory levels will start to increase in the catchment area due to increased harvest levels and the subsequent increase in stand reestablishment levels.

Timber growth rates

Neutral. Timber growth rates have increased for both pine sawtimber and pine chip-n-saw but decreased slightly for pine pulpwood in the catchment area since 2011. Evidence suggests that this decrease in pine pulpwood growth rate is not due to increases in bioenergy demand, but rather linked to changes in diameter class distribution and indicative of a forest in a state of transition, where timber is moving up in product class (i.e. pine pulpwood is moving up in classification to pine chip-n-saw).

Forest area

Neutral. In the Georgia catchment area, total forest area (timberland) decreased more than 115,000 hectares (-2.8%) from 2011 through 2018. Note that this decrease coincided with a roughly 19,000-hectare increase in cropland and 93,000-hectare increase in urban land and land classified as having other uses.

Specifically, pine timberland, the primary source of roundwood utilized by the bioenergy industry, decreased over 34,000 hectares from 2011-2016. However, from 2016-2018, pine timberland stabilized and rather increased more than 17,000 hectares in the catchment area (or a net decrease of roughly 17,000 hectares from 2011-2018). Ultimately, there is little evidence that the decrease in pine timberland from 2011-2016 or increase since 2016 is linked to increased bioenergy demand. Rather, the overall decrease in pine timberland since 2011 appears to be more closely linked to the relative weakness of pine sawtimber markets in the Georgia catchment area and the lack of return from sawtimber.

Wood prices

Positive / Negative. Intuitively, an increase in demand should result in an increase in price, and this is what the data shows in the Georgia catchment area as it relates to increased biomass demand from Georgia Biomass and Fram and the prices of the various raw materials consumed by these mills. Specifically, the 1.4-million metric ton increase in softwood pulpwood demand attributed to Georgia Biomass and Fram coincided with a 20% increase in delivered pine pulpwood price and a 10-15% increase in pine chip prices from 2011-2015. Since 2015, biomass demand has held relatively steady, and, overall, so too have delivered pine pulpwood and pine chip prices. The apparent link between increased bioenergy demand and increased pine raw material prices is supported further by statistical analysis, as strong positive correlations were found between softwood biomass demand and both delivered pine pulpwood and pine chip prices. However, note that biomass demand alone is not responsible for these changes in prices, as softwood biomass demand accounts for only 10-15% of total softwood pulpwood demand in the catchment area. Rather, the prices of these raw materials are impacted to a larger degree by demand from other sources (i.e. pulp/paper), which accounts for 85-90% of total softwood pulpwood demand in the Georgia catchment area.

On the other hand, it’s also important to note that the increase in bioenergy-related wood demand has been a positive for forest landowners in the Georgia catchment area. Not only has bioenergy provided an additional outlet for pulpwood in this market, but the increase in pulpwood prices as a result of increased pulpwood demand has transferred through to landowners (improved compensation). Specifically, since 2015, pine pulpwood (PPW) stumpage price – the price paid to landowners – has averaged more than $17 per ton in the Georgia catchment area. This represents a 70% increase over the approximately $10 per ton averaged by PPW stumpage in the catchment area over the last five years prior to Georgia Biomass’ startup in 2Q 2011.

(Note: Pine pulpwood stumpage prices are notably higher in the Georgia catchment area due to a much tighter balance in supply and demand (in comparison to most other markets across the US South). For instance, in all other areas across the US South2, PPW stumpage prices have averaged less than $9 per ton since 2015, or roughly half that of prices in the Georgia catchment area).

Markets for solid wood products

Positive. In the Georgia catchment area, demand for softwood sawlogs used to produce lumber and other solid wood products increased an estimated 39% from 2011-2019, and by-products of the sawmilling process are sawmill residuals – materials utilized by Georgia Biomass and the Fram mills to produce wood pellets. With the increased production of softwood lumber, so too has come an increase in sawmill residuals, some of which have been purchased/consumed by Georgia Biomass and Fram. Not only have these pellet producers benefited from the greater availability of this by-product, but lumber producers have also benefited, as the Georgia Biomass and Fram mills have provided an additional outlet for these producers and their by-products.

Read the full report: Georgia Biomass Catchment Area Analysis.

This is part of a series of catchment area analyses around the forest biomass pellet plants supplying Drax Power Station with renewable fuel. Others in the series include: ChesapeakeEstonia, Latvia and Drax’s own, other three mills LaSalle BionergyMorehouse Bioenergy and Amite Bioenergy.

What is biomass?

Illustration of a working forest supplying biomass

What is biomass?

In ecological terms, biomass refers to any type of organic matter. When it comes to energy, biomass is any organic matter that can be used to generate energy, for example wood, forest residues or plant materials.

How is biomass used?  

Biomass used and combusted for energy can come in a number of different forms, ranging from compressed wood pellets – which are used in power stations that have upgraded from coal – to biogas and biofuels, a liquid fuel that can be used to replace fossil fuels in transport.

The term biomass also refers to any type of organic material used for energy in domestic settings, for example wood burned in wood stoves and wood pellets used in domestic biomass boilers.

Biomass is organic matter like wood, forest residues or plant material, that is used to generate energy.

Where does biomass come from?

Biomass can be produced from different sources including agricultural or forestry residues, dedicated energy crops or waste products such as uneaten food.

Drax Power Station uses compressed wood pellets sourced from sustainably managed working forests in the US, Canada, Europe and Brazil, and are largely made up of low-grade wood produced as a byproduct of the production and processing of higher value wood products, like lumber and furniture.

Biomass producers and users must meet a range of stringent measures for their biomass to be certified as sustainable and responsibly sourced.

Key biomass facts

Is biomass renewable?

 Biomass grown through sustainable means is classified as a renewable source of energy because of the process of its growth. As biomass comes from organic, living matter, it grows naturally, absorbing carbon dioxide (CO2) from the atmosphere in the process.

It means when biomass is combusted as a source of energy – for example for heat or electricity production – the CO2 released is offset by the amount of CO2 it absorbed from the atmosphere while it was growing.

Fast facts

  • In 2019 biomass accounted for 6% of Great Britain’s electricity generation, more than 1/6 of the total generation of all renewable sources
  • There is about 550 gigatonnes of biomass carbon on Earth in total. Humans make up around 1/10,000th of that mass.
  • Modern biomass was first developed as an alternative for oil after its price spiked as a result of the 1973 Yom Kippur War
  • The International Energy Agency (IEA) estimates bioenergy accounts for roughly 1/10th of the world’s total energy supply

Biomass is a renewable, sustainable form of energy used around the world.

How long has biomass been used as a source of energy?

Biomass has been used as a source of energy for as long as humans have been creating fire. Early humans using wood, plants or animal dung to make fire were all creating biomass energy.

Today biomass in the form of wood and wood products remains a widely used energy source for many countries around the world – both for domestic consumption and at grid scale through power stations, where it’s often used to replace fossil fuels with much higher lifecycle carbon emissions.

Drax Power Station has been using compressed wood pellets (a form of biomass) since 2003, when it began research and development work co-firing it with coal. It fully converted its first full generating unit to run only on compressed wood pellets in 2013, lowering the carbon footprint of the electricity it produced by more than 80% across the renewable fuel’s lifecycle. Today the power station runs mostly on sustainable biomass.

Go deeper

Read next: What is reforestation and afforestation?

What is carbon capture usage and storage?

Carbon capture

What is carbon capture usage and storage?

Carbon capture and storage (CCS) is the process of trapping or collecting carbon emissions from a large-scale source – for example, a power station or factory – and then permanently storing them.

Carbon capture usage and storage (CCUS) is where captured carbon dioxide (CO2) may be used, rather than stored, in other industrial processes or even in the manufacture of consumer products.

How is carbon captured?

Carbon can be captured either pre-combustion, where it is removed from fuels that emit carbon before the fuel is used, or post-combustion, where carbon is captured directly from the gases emitted once a fuel is burned.

Pre-combustion carbon capture involves solid fossil fuels being converted into a mixture of hydrogen and carbon dioxide under heat pressure. The separated CO2 is

captured and transported to be stored or used.

Post-combustion carbon capture uses the addition of other materials (such as solvents) to separate the carbon from flue gases produced as a result of the fuel being burned. The isolated carbon is then transported (normally via pipeline) to be stored permanently –  usually deep underground – or used for other purposes.

Carbon capture and storage traps and removes carbon dioxide from large sources and most of that CO2 is not released into the atmosphere.

 What can the carbon be used for?

Once carbon is captured it can be stored permanently or used in a variety of different ways. For example, material including carbon nanofibres and bioplastics can be produced from captured carbon and used in products such as airplanes and bicycles, while several start-ups are developing methods of turning captured CO2 into animal feed.

Captured carbon can even assist in the large-scale production of hydrogen, which could be used as a carbon-neutral source of transport fuel or as an alternative to natural gas in power generation.

Key carbon capture facts

Where can carbon be stored?

Carbon can be stored in geological reserves, commonly naturally occurring underground rock formations such as unused natural gas reservoirs, saline aquifers, or ‘unmineable’ coal beds. The process of storage is referred to as sequestration.

The underground storage process means that the carbon can integrate into the earth through mineral storage, where the gas chemically reacts with the minerals in the rock formations and forms new, solid minerals that ensure it is permanently and safely stored.

Carbon injected into a saline aquifer dissolves into the water and descends to the bottom of the aquifer in a process called dissolution storage.

According to the Global CCS Institute, over 25 million tonnes of carbon captured from the power and industrial sectors was successfully and permanently stored in 2019 across sites in the USA, Norway and Brazil. 

What are the benefits of carbon storage?

CO2 is a greenhouse gas, which traps heat in our atmosphere, and therefore contributes to global warming. By capturing and storing carbon, it is being taken out of the atmosphere, which reduces greenhouse gas levels and helps mitigate the effects of climate change.

Carbon capture fast facts

  • CCUS is an affordable way to lower CO2 emissions – fighting climate change would cost 70% more without carbon capture technologies
  • The largest carbon capture facility in the world is the Petra Nova plant in Texas, which has captured a total of 5 million tonnes of CO2, since opening in 2016
  • Drax Power Station is trialling Europe’s biggest bioenergy carbon capture usage and storage project (BECCS), which could remove and capture more than 16 million tonnes of CO2 a year by the mid 2030s, delivering a huge amount of the negative emissions the UK needs to meet net zero

Go deeper


Button: What are negative emissions?