


We have published independent Catchment Area Analysis (CAA) reports for around 68% of the total biomass wood pellet supply to Drax Power Station in 2019. Within that, 73% of the pellets were manufactured in the US South accounting for 49% of that year’s total supply quantity.
A key component of CAA analysis are measurements, data and calculations provided by the National Forest Inventory (NFI). Bespoke wood price data, mill production capacity, market trends and interviews with local experts complete the picture.
The NFI in each country or region can be quite different in its intensity and frequency of measurement and overall degree of accuracy. In this article we examine the Forest Inventory and Analysis (FIA) database produced by the US Department of Agriculture Forest Service (USDA FS).
FIA traces its origin back to the McSweeney – McNary Forest Research Act of 1928 and began the first inventory in 1930. Since that time, it has been in continuous operation with a stated mission to: make and keep current a comprehensive inventory and analysis of the present and prospective conditions of and requirements for the renewable resources of the forest and rangelands of the US.
The fundamental science behind measuring tree height and diameter to calculate growth and volume has not changed much over the decades. A girth tape is used to measure the diameter at breast height (DBH), which is a point on the tree stem 1.37m above the base of the tree or the root collar (the exact height can vary by country). The height of a standing tree is conventionally measured using a clinometer or hypsometer, which measures the angle from the top of the tree to a measured distance away from the base. This forms a triangle from which the tree height can be calculated.
-
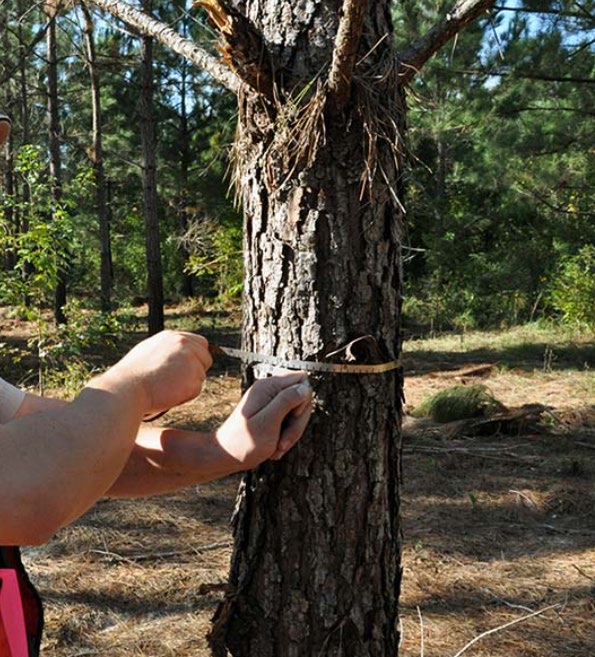
- DBH measurement using girth tape
-
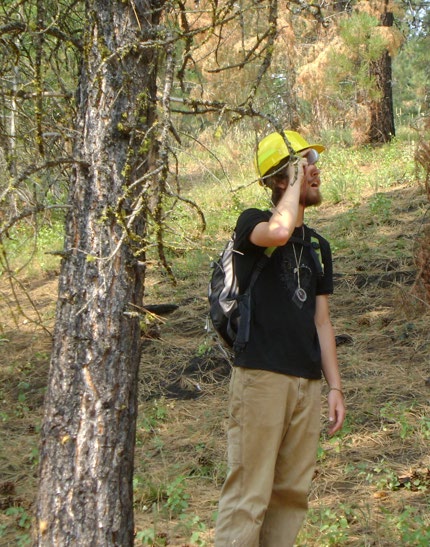
- Tree height measurement using clinometer
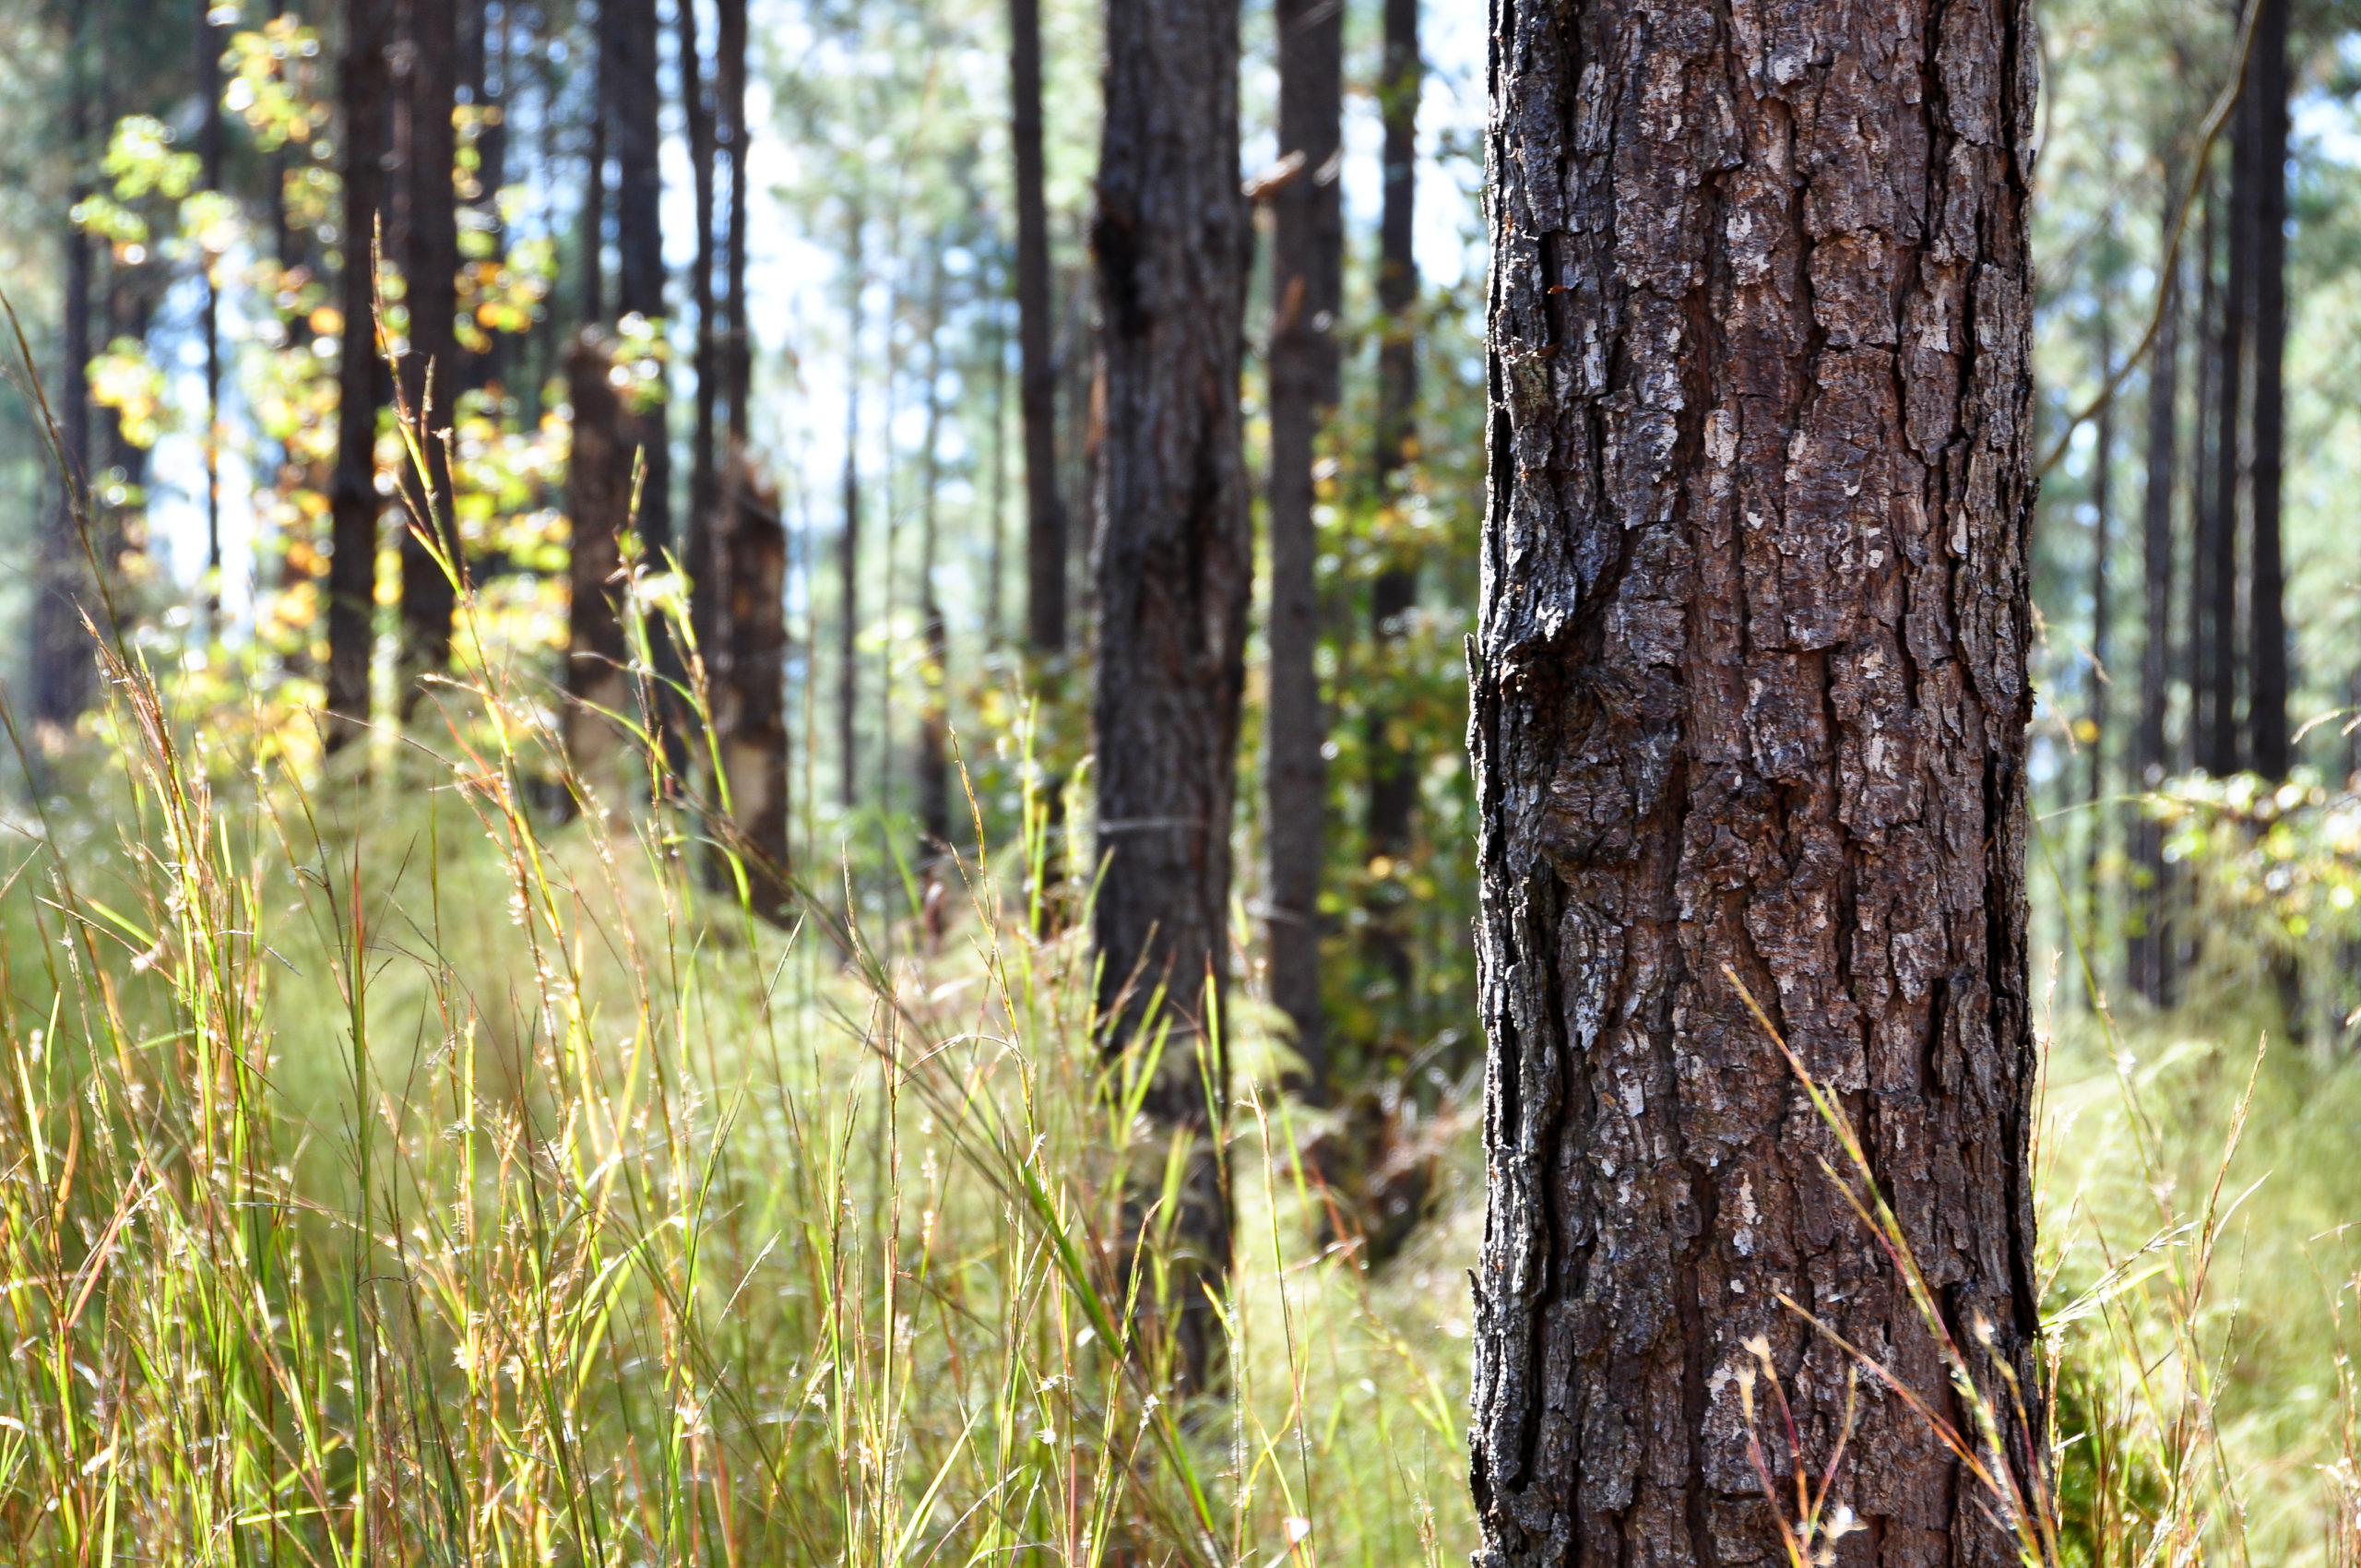
Example of girth and height measurement in the US South
The combination of height and girth are then used to estimate total tree volume based on historical models for that particular species in that country or region. Many decades worth of data measurements and modelling have been used to develop complex equations to estimate volume for each species and circumstance. This calculation process needs to estimate the rate of taper of the stem, or the difference in diameter between the base and the top of the tree. This can be consistent within a single species, but it can depend on growth rates and planting density (for example closely stocked trees may grow taller and thinner but more openly planted trees tend to be shorter and wider). Whether the site has been thinned, how many times, and at what age, can impact the degree of taper in the stem. Through many years of research, measuring and modelling the Southern Research Station (SRS) FIA team has developed the following formula for under-bark volume calculation:
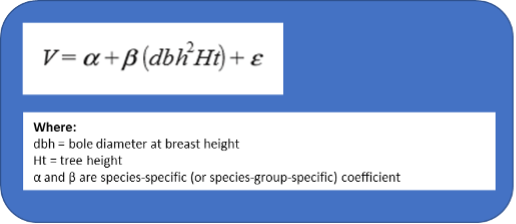
This is then modified according to the parameters shown below, depending on species and stem characteristics.
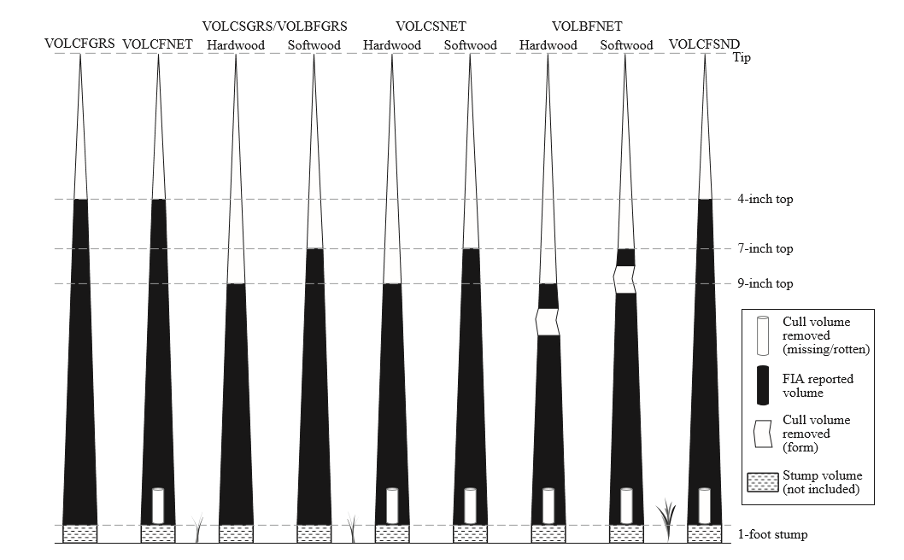
Example of volume
Once the volume has been calculated, the basic density (solid wood per cubic metre) and moisture content can be used to calculate wet and dry weight, fibre content and yield.
A comprehensive record of data
The US Forest Service has built up an extensive historical record of data points through years of physical measurements – from both sampling and cutting down individual sample trees to determine the actual dimensions and statistics to compare against the estimated values. Over time, forest scientists are able to build up reasonably accurate tables for each tree species that can be used to estimate growth and volume based on the DBH and estimated tree height.
In the UK we have a forester’s handbook known as The Blue Book which contains a vast quantity of modelled data to help a forester calculate volume and growth in a range of different forest types across the country. This data has been collected and modelled by the Forestry Commission’s Forest Research branch. In the US they have a similar system of data collection and modelling but on a bigger scale, given the much larger forest area and greater variety in tree species and site type.
How can you measure an entire forest?
The forestland area of the US South covers more than 100 million hectares (ha) in total which can present quite a challenge to measure, survey and accurately predict forest growth and health. The FIA does this through a network of sample plots randomly but sequentially distributed across the forestland in each State with undisclosed locations so as to avoid biased management. Field crews collect data on forest type, site attributes, tree species, tree size, and overall tree condition on accessible forest land.
Recently, the programme has involved a five-year rolling measurement system where 20% of the plots are measured in each State, on an annual basis. At the end of a five-year period all plots will have been measured and the process begins again. This process is overseen by a robust quality assurance system to maintain and ensure the quality and accuracy of the fieldwork.
Plots are distributed at a rate of 1 plot per 6,000 acres of land (or one per 2,400 ha). This degree of plot distribution is at an extremely course scale if attempting to understand the growth of an individual stand or forest area. For example, The Blue Book recommends using 8-12 plots (and top height measurements) for a relatively uniform stand of around 10 ha. This degree of accuracy would be required to calculate the volume of standing wood for sale. In comparison, the FIA data would be completely inaccurate if trying to monitor growth and trends at an individual forest level or even at county level. This sampling intensity and the scale of measurement are the most critical factors in assessing the validity of data and trends that are identified through the FIA and through the CAA analysis.
Quantifying the level of accuracy
The physical measurement procedure and volume modelling are well established processes with data and analysis collected over many decades to support the findings; this leads to a clearly quantifiable degree of error for each measured plot. The challenge comes when using plot data to estimate the values in the surrounding forest. At this scale, the level of accuracy will depend on the ratio of plots to total forest area and the total number of plots measured. The ratio of plots per ha in the US South is pre-determined, limited by the physical and financial constraints of actually measuring trees on the ground. However, the total number of plots used to evaluate trends can vary according to how large an area is assessed.
Fundamentally, if a single county is assessed then the total number of sample plots will be low and the potential for error will be high. If an entire State is assessed, then the number of plots is much larger (despite the same ratio of plots per ha) therefore the data and the trend is statistically much more accurate. Drax’s CAA analysis falls somewhere in between these two points, with each catchment area including multiple counties but not quite at the same scale as State level analysis. An example of the variation in error is shown in the table below.
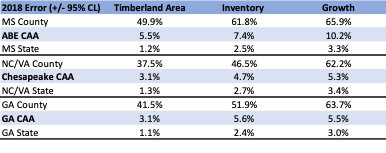
Degree of error for key metrics in Drax’s CAA analysis
The data showing total inventory (volume of wood growing in the forest) has been assessed for the Chesapeake catchment area in North Carolina and Virginia. When looking at each individual county, the data error calculation is +/- 46.5%, therefore not very accurate. If looking at State level, the data error is only +/- 2.7%. This degree of error is much more accurate and demonstrates more credible and reliable data due to the much larger number of plots available across the entire State. The Drax CAA analysis for inventory in the Chesapeake area is +/- 4.7% which is reasonably close to the State level accuracy due to the large number of countries that are included in the CAA analysis.
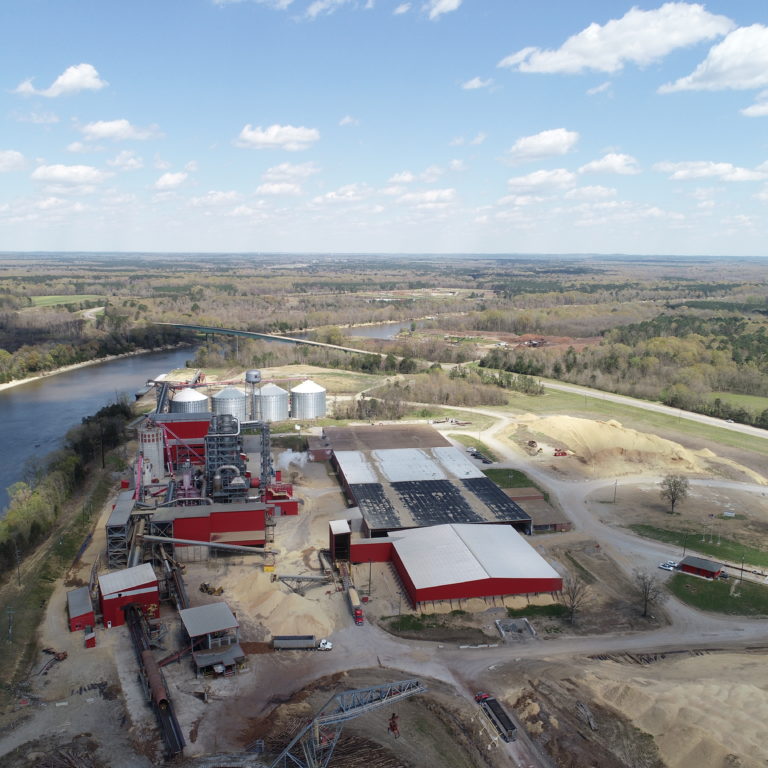
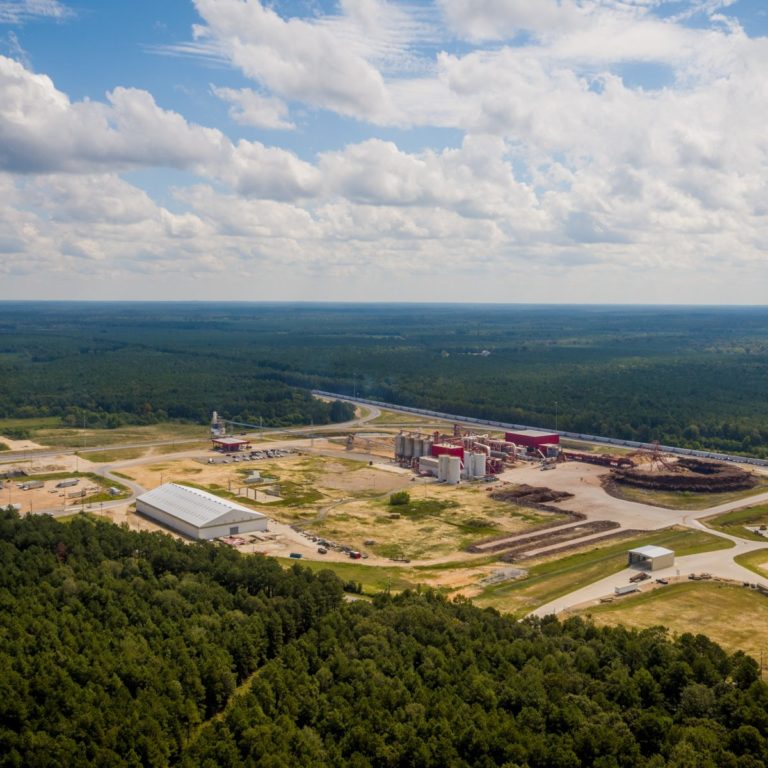
Since the catchment area boundary is defined by the pellet mill’s historical and future sourcing pattern, this can vary in size according to each mill’s procurement strategy and local market conditions. For example, the Amite BioEnergy pellet plant sources from a much smaller area close to the mill and therefore the catchment area includes fewer counties. This can lead to a higher degree of error than in the other CAA reports as the total number of plots used is smaller.
A long history of measurement and analysis
Despite this, the overall degree of error is still in single figures and can be considered reasonable in each CAA report by the standards of forest measurement and modelling, an error of under 10% is generally considered acceptable. Measuring standing trees that are still growing is not an exact science – it is an estimation. Trees cannot be accurately weighed or measured until they are cut down. Therefore, there will always be degree of error in estimated data. In the US South, the long history of measurement, analysis and data modelling and the relatively homogenous nature of the main commercial species (southern yellow pine), mean that the error is relatively uniform and predictable if a large sample area is considered.
The potential for remote sensing data collection and analysis to replace traditional field measurement is an interesting and developing field. At an individual forest or stand level, it is possible to carry out intensive measurement with Laser or Lidar, to calculate volume and growth. However, there is currently no reliable, accurate and cost-effective way to do this at a large-scale across several million hectares. This may be a possibility as the technology and data interpretation tools continue to develop and Drax is working closely with remote sensing specialists to trial and develop this process. Until then, we can rely on boots on the ground and traditional fieldwork for an accurate view of the forest trends across our supply chain.
This blog supports a series of catchment area analyses around the forest biomass pellet plants supplying Drax Power Station with renewable fuel. Read more.