


It’s been another record-breaking quarter for Britain’s power system. During the first three months of 2017, biomass, wind and hydro all registered their highest energy production ever, while solar recorded its highest ever peak output.
And while this is all worth celebrating, it shouldn’t come as a surprise – the last few years have seen Britain’s power system take several significant steps toward decarbonisation and this year is no different. Electric Insights, the quarterly report on Britain’s power system by Dr Iain Staffell from Imperial College London, commissioned by Drax via Imperial Consultants, documents the new gains and confirms the trend: renewables are fast becoming the new norm and in 2017 they continued their growth.

The renewable record breakers
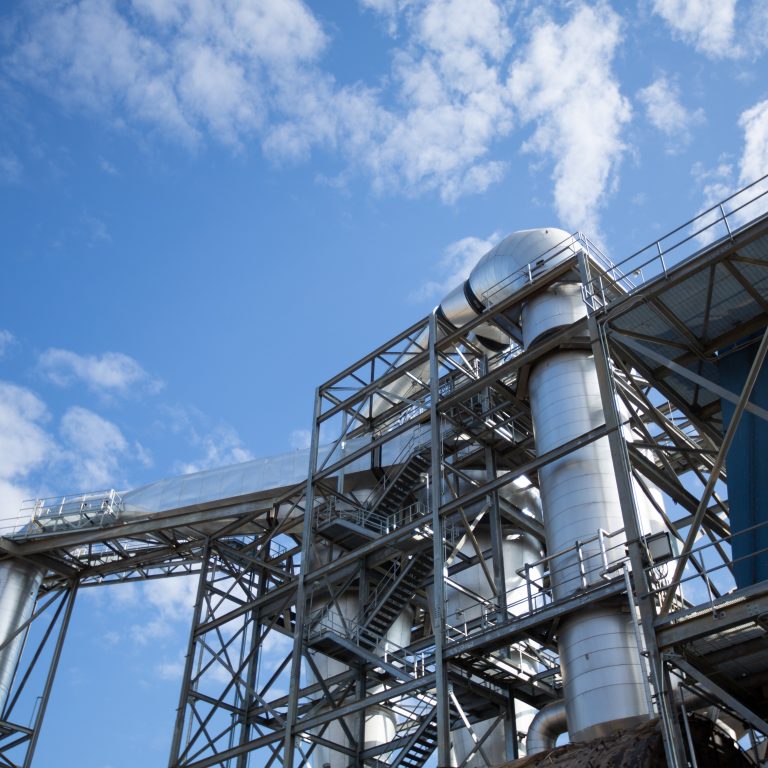
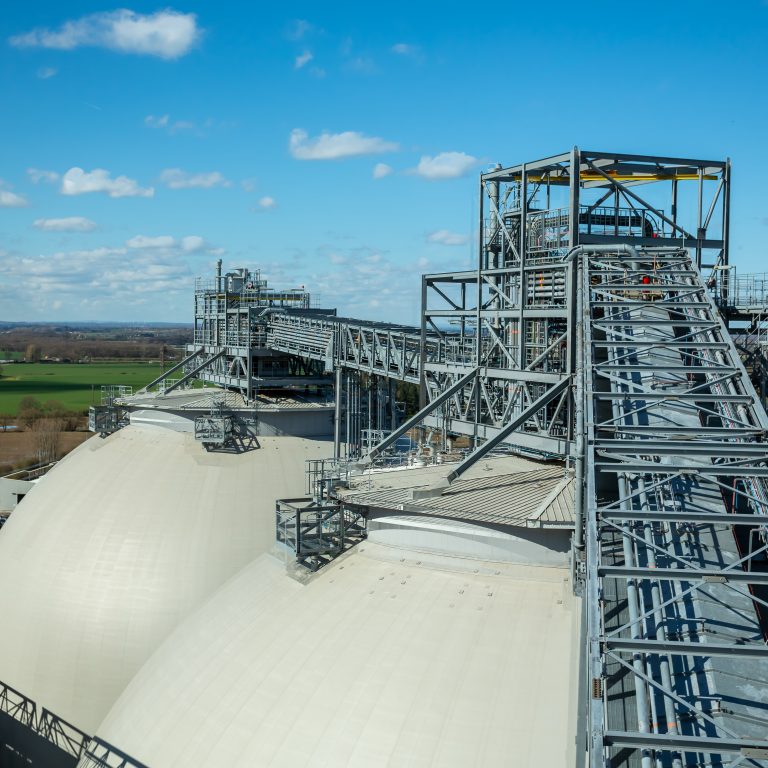
Over this quarter biomass electricity generation hit a record production figure of 4.4 TWh, which means that biomass generators ran at 95% of full capacity – higher than any other technology has achieved over the last decade.
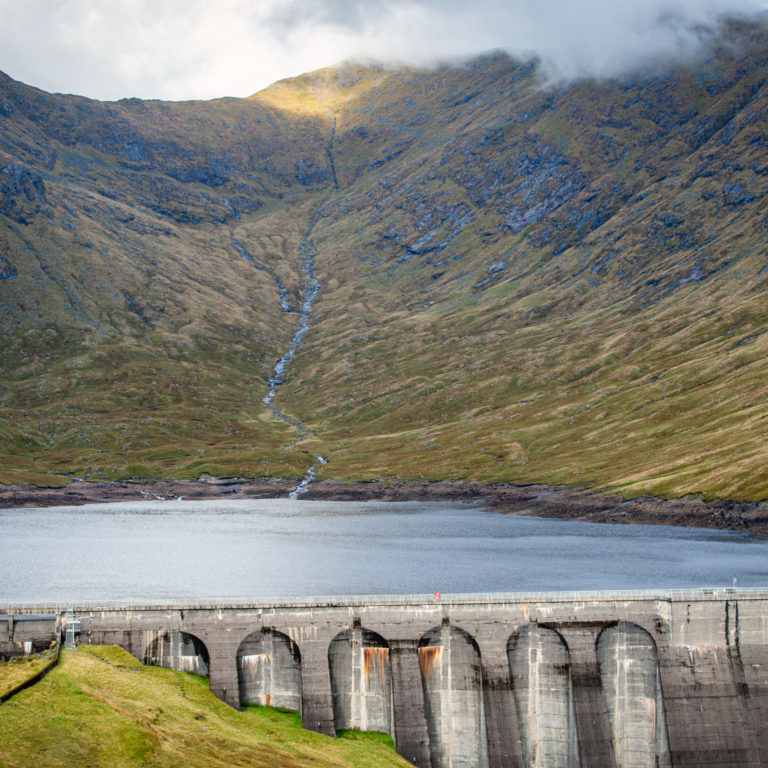
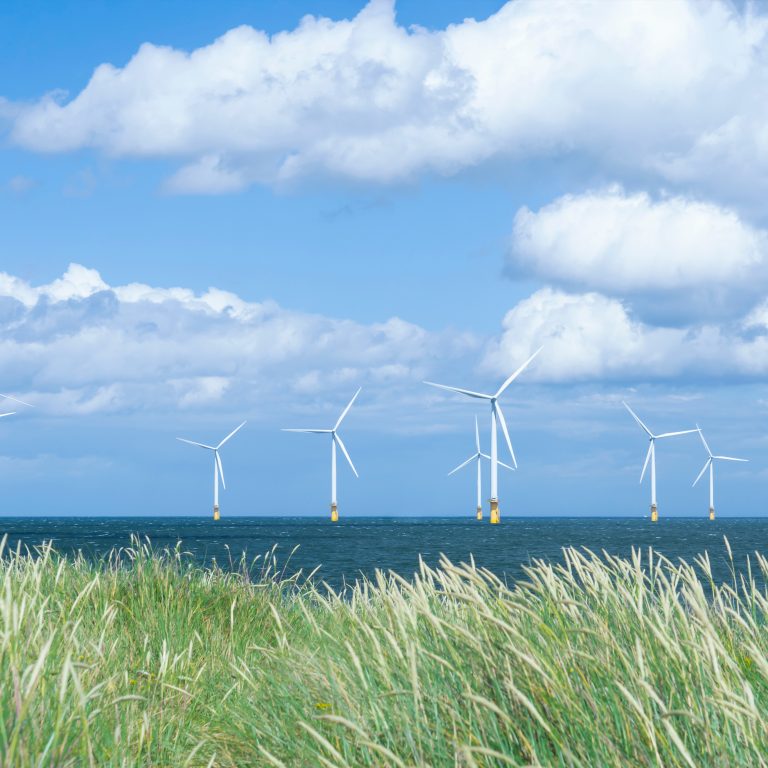
Hydro went 4% better than its previous energy production best by generating 1.6 TWh, while Britain’s wind farms produced 11.3 TWh (10% higher than the previous record, set in 2015). This was helped in part by several new farms being built which increased installed capacity by 5% over last year, but it was also indebted to the mild, windy weather.
Wind farms produced more electricity than coal, 57 days out of 90 during the first three months of 2017
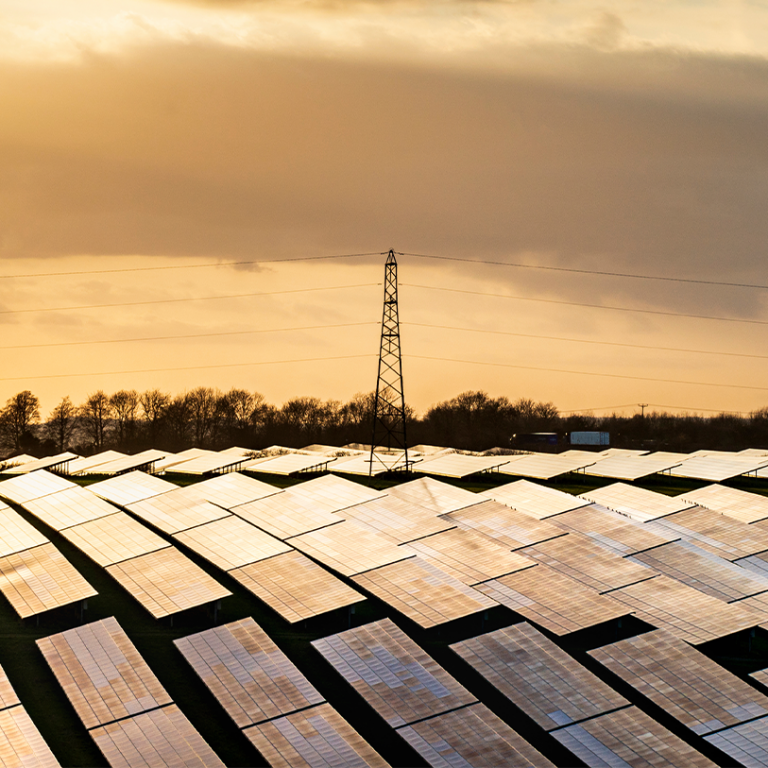
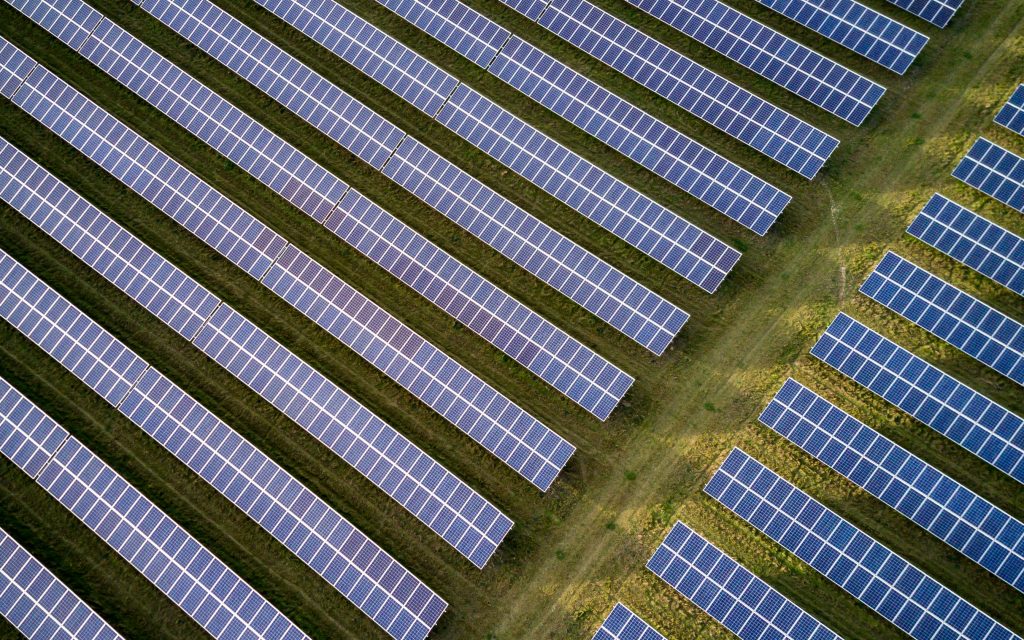
Solar hit a new record peak output at the end of March, when it generated 7.67 GW – enough to power a fifth of the country. In fact, during the last weekend of March, for the first time ever, the country’s demand for electricity from the national grid was lower during an afternoon than during the night. This was because solar panels, which only generate power when the sun is up, tend to sit outside of the national high voltage transmission grid.
Understanding how this happened is to understand how solar energy is changing our national power system.
A reverse of the trend
Electricity demand on the national grid – think of it as the power system’s motorways – is typically higher during the day and early evening (when people are most active, using lights and gadgets) than overnight. However, on the last weekend in March 2017, the opposite was true because of how much solar energy was generated.
Solar panels and some smaller onshore windfarms are ‘invisible’ – they don’t feed into the national grid. Instead, these sources either feed into the regional electricity distribution networks – the power system’s A and B roads – or, as many of them are on people’s roofs and used in their own homes or business premises, it never gets down their driveway. This can mean when solar panels are generating a lot of electricity, there is a lower demand for power from the grid, making it appear that less of the country is using electricity than it actually is.
This was the case during the last weekend of March, when solar generated enough power to satisfy a large part of Britain’s demand. And while this is another positive step towards a lower carbon energy mix, it is about to change the way our power system works, particularly when it comes to the remaining coal power stations.
What the power system needs to provide, today and in the future, is flexibility – to ramp up and down to accommodate for the shifting demand based on supply of intermittent – weather dependent – renewables. Thermal power stations such as gas, coal and biomass can meet much of this demand, but even more rapid response from technologies such as the Open Cycle Gas Turbines that Drax is developing and batteries could fulfil these needs quicker.

Today’s dirty is yesterday’s clean
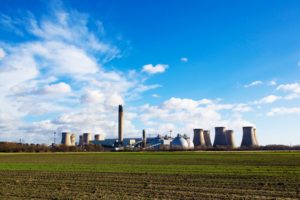
The record breaking and increased renewable generation of the period from January to March 2017 would mean nothing if it wasn’t matched by a decrease in emissions. During the first three months of 2017, emissions dropped 10% lower than the same period in 2016 and a massive 33% lower than 2015. Coal output alone fell 30% this quarter compared to Q1 2016.
To put the scale of this progress into context we need only look at the quarter’s ‘dirtiest hour’ – the hour in which carbon intensity from electricity generation is at its highest. Between January and March, it peaked on a calm and cold January evening with 424 grams of CO2 released per kWh (g/kWh). The average for generation between 2009 and 2013 was 471 g/kWh. In short, this quarter’s dirtiest hour was cleaner than the average figure just four years ago – yesterday’s average is today’s extremity.
If we want to continue to break records and further progress towards a fully decarbonised power system, this needs to be a consistent aim: making the averages of today tomorrow’s extremes.
Top line stats
Highest energy production ever
- Wind – 11.3 TWh
- Biomass – 4.4 TWh
- Hydro – 1.6 TWh
Record peak output
- Solar – 7.67 GW
- Enough to power 1/5 of the country
Yesterday’s average is today’s extremity
- Average carbon emissions per kWh – 2009-2013
- 471 g/kWh
- Average carbon emissions per kWh – Q1 2017
- 284 g/kWh
- Peak carbon emissions per kWh – 2009-2013
- 704 g/kWh
- Peak carbon emissions per kWh – Q1 2017
- 424 g/kWh
Explore the data in detail by visiting ElectricInsights.co.uk
Commissioned by Drax, Electric Insights is produced independently by a team of academics from Imperial College London, led by Dr Iain Staffell and facilitated by the College’s consultancy company – Imperial Consultants.